Tag: Kansas State Board of Education

  • Kansas school spending, through 2020

    Kansas school spending, through 2020

    Charts of Kansas school spending presented in different forms.

    Recently Kansas State Department of Education released spending figures for the 2020 school year, that is, the school year starting in 2019 and ending in 2020.

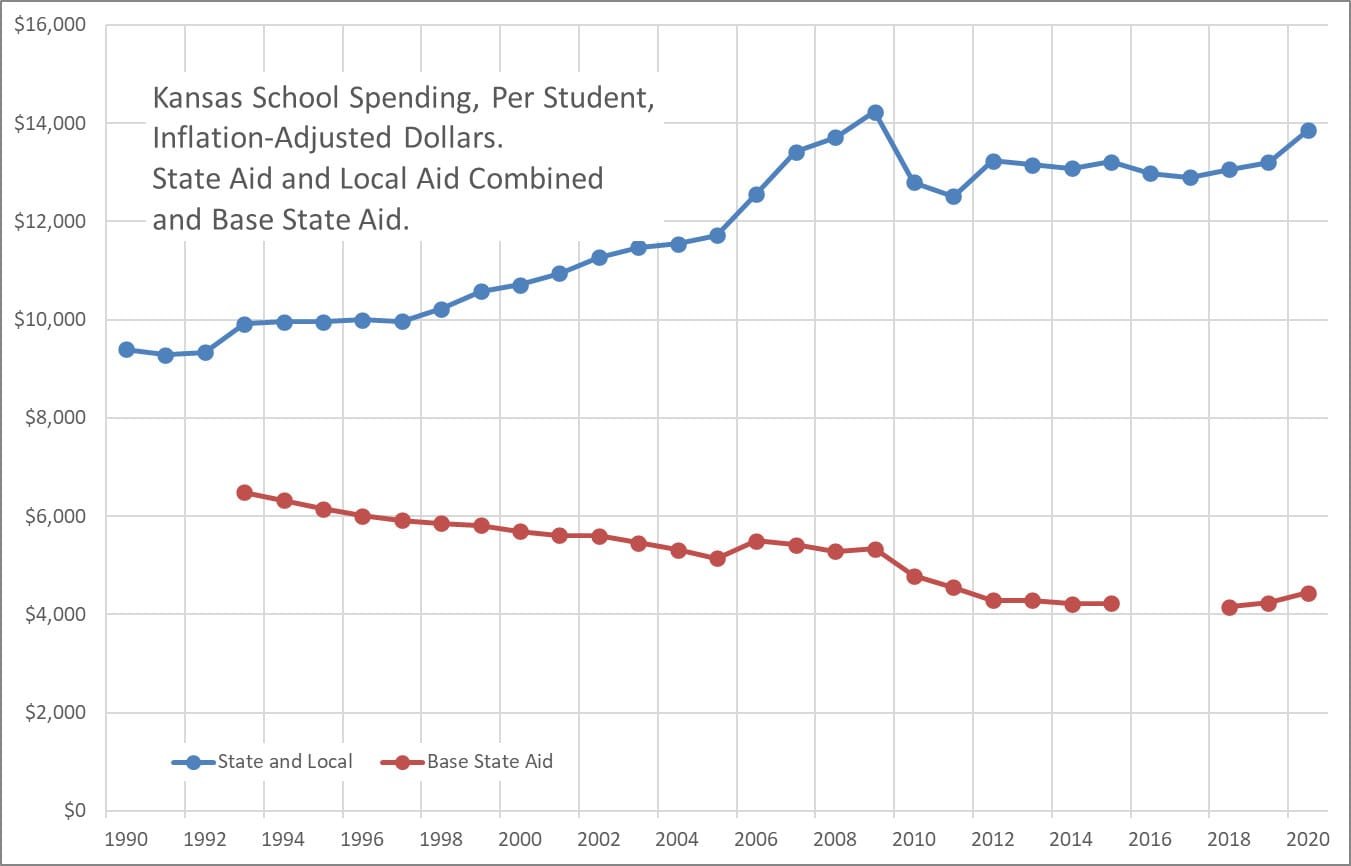
    One of the most important charts shows state spending per-pupil, adjusted for inflation. It shows the total of state and local spending, which is useful because in 2015 the state made a change in the way revenue is allocated between state and local sources. It also shows base state aid per pupil, which is an important number as it is the starting point for the school funding formula.

    Why is total state and local spending higher than base state aid? The answer is weightings. These are amounts that are added to the base to pay for things like at-risk children, English language learners, and other items. The value of weightings has grown over time, so as base state aid has generally fallen, total spending has generally risen.

    A second chart shows the ratio of total state and local spending to base state aid.

    This is not simply a technical matter. In discussions of school policy, sometimes only the base aid figure is used. As it has fallen, some formulate an argument that school spending has been cut. That is easily refuted by looking at total state and local spending.

    Of note, base state aid was not used in school years 2016 and 2017, which explains the gap in some of the series.

    I’ve gathered these charts and others and present them in a presentation. Use arrow keys to move through the charts. Click here to access.

    Kansas school spending, showing state and local aid compared to base state aid. Click for larger.

    Kansas school spending, showing ratio of state and local aid to base state aid. Click for larger.

  • Kansas school spending, through 2018

    Kansas school spending, through 2018

    Charts of Kansas school spending presented in different forms.

    Recently Kansas State Department of Education released spending figures for the 2018 school year, that is, the school year starting in 2017 and ending in 2018.

    One of the most important charts shows state spending per-pupil, adjusted for inflation. It shows the total of state and local spending, which is useful because in 2015 the state made a change in the way revenue is allocated between state and local sources. It also shows base state aid per pupil, which is an important number as it is the starting point for the school funding formula.

    Why is total state and local spending higher than base state aid? The answer is weightings. These are amounts that are added to the base to pay for things like at-risk children, English language learners, and other items. The value of weightings has grown over time, so as base state aid has generally fallen, total spending has generally risen.

    A second chart shows the ratio of total state and local spending to base state aid.

    This is not simply a technical matter. In discussions of school policy, sometimes only the base aid figure is used. As it has fallen, some formulate an argument that school spending has been cut. That is easily refuted by looking at total state and local spending.

    Of note, base state aid was not used in school years 2016 and 2017, which explains the gap in some of the series.

    I’ve gathered these charts and others and present them in a presentation. Use arrow keys to move through the charts. Click here to access.

    Kansas school spending, showing state and local aid compared to base state aid. Click for larger.
    Kansas school spending, showing ratio of state and local aid to base state aid. Click for larger.
  • Dale Dennis, sage of Kansas school finance?

    Dale Dennis, sage of Kansas school finance?

    Is the state’s leading expert on school funding truly knowledgeable, or is he untrustworthy?

    Recent events have found Kansas Department of Education’s Deputy Commissioner Dale Dennis in the news regarding a possible mistake or misapplication of school funds. The school spending establishment has rushed to his rescue, with Kansas National Education Association, Kansas Association of School Boards, United School Administrators of Kansas, Kansas School Superintendents Association, and American Federation of Teachers Kansas issuing a joint statement. Dale Dennis, says the statement, is “the best friend public education and the kids of Kansas have had.” He is described as “the most trustworthy, honest, and respected advocate for children and schools.”

    Consider, however: The goals of these institutions are more spending on schools, less accountability for schools, and stamping out any movement towards school choice. And Dale Dennis accommodates this, especially more spending. This is the basis of the complaint, that he authorized more spending than the legislature intended in statute.

    On Facebook, Kansas public school spending advocates mislead about the level of school spending. Click for larger.
    No matter how this dispute resolves, Dale Dennis is not trustworthy and honest. Below is a description of a speech he gave to the Hutchinson Rotary Club last year. He portrayed a number called “base state aid per pupil” as all that the state spends on schools. The reality is that the state spends much more. Presenting base state aid as though it was all the state spends is misleading. It’s a lie.

    Base state aid is a fairly low figure and it has not kept up with inflation. But total state (and local) spending is much higher and has risen. This is why Dale Dennis is not trustworthy and honest. This is fake government.

    But because Dennis is willing to paint Kansas school finances untruthfully and in a way that makes it look like spending is low and has declined, the public school spending establishment loves him. They cite his figures. And then: Who can argue with the Kansas Department of Education Deputy Commissioner?

    What can argue with Dennis are the facts. Here’s how to refute Dale Dennis: View spending numbers from the Kansas State Board of Education.

    Following, from April 2017, analysis of Dale Dennis and his speech to the Hutchinson rotary Club.

    Fake government spawns fake news

    Discussions of public policy need to start from a common base of facts and information. An episode shows that both our state government and news media are not helping.

    A recent Hutchinson News article1 started with this:

    Once you wake up to where Kansas was in 1992 at funding schools and what it needs to do to get caught up, said the Kansas Department of Education’s Deputy Commissioner Dale Dennis, it’s a shocker.

    In 1992, base state aid per pupil was $3,600. That amount, taking into account the Consumer Price Index, would be the equivalent of $6,001.12 in 2013. Base state aid, however, has been frozen at $3,852 since 2014-15.

    “The numbers are shocking, shocking,” Dennis told the Hutchinson Rotary Club at its Monday luncheon meeting at the Hutchinson Town Club.

    Why is a speech by a government bureaucrat, as covered in a major newspaper, important? It illustrates two problems we face in understanding, discussing, and debating important matters of public policy.

    First, can government be truthful and accurate? Dale Dennis — the state’s top official on school finance — certainly knows that the numbers he presented do not accurately characterize the totality of school spending in Kansas. But the problem is even worse than that. To use base state aid as the indicator of state spending on schools is deceptive. It’s deceptive in that, after adjusting for inflation, base state aid has declined. But total state aid to school districts has increased.

    Base state aid is a false indicator of total spending on schools by the state. It’s fake — fake government. And for a newspaper to uncritically present this as news illustrates the second problem we face.

    Background on base state aid and school spending

    Kansas school spending, showing base state aid and total state aid. See article for notes about 2015. Click for larger.
    Base state aid per pupil — the statistic Dennis presented — is an important number.2 It’s the starting point for the Kansas school finance formula used before the 2015-2016 (fiscal 2016) school year, and something like it may be used in a new formula.3

    Base state aid, however, is not the only important number. To calculate the funding a school district receives, weightings are added. If students fall into certain categories, weightings for that category are added to determine a weighted enrollment. That is multiplied by base state aid to determine total state aid to the district. 4

    While this may seem like a technical discussion that doesn’t make a difference, it’s very important, because some of the weightings are large. The at-risk weighting, intended to cover the additional costs of teaching students from low-income families, started at five percent in 1993. In other words, for every student in this category, a school district received an extra five percent of base state aid. The value of this weighting has risen by a factor of nine, reaching 45.6 percent starting with the 2008-2009 school year.

    There’s also the high-density at-risk weighting. Starting with the 2006-2007 school year districts with a high concentration of at-risk students could receive an extra weighting of four percent or eight percent. Two years later the weightings were raised to six percent and ten percent. (This formula was revised again in 2012 in a way that may have slightly increased the weightings.)

    Kansas school spending, showing ratio of total state aid to base state aid. See article for notes about 2015. Click for larger.
    Kansas school spending. See article for notes about 2015. Click for larger.
    The weightings have a large effect on school funding. For example: During the 2004-2005 school year, base state aid was $3,863 and the at-risk weighting was ten percent. An at-risk student, therefore, generated $4,249 in state funding. (Other weightings might also apply.)

    Ten years later base state aid was $3,852 — almost exactly the same — and the at-risk weighting was up to 45.6 percent. This generates funding of $5,609. For a district that qualified for the maximum high-density at-risk weighting, an additional $404 in funding was generated. (These numbers are not adjusted for inflation.)

    So even though base state aid remained (almost) unchanged, funding targeted at certain students rose, and by a large amount.

    Over time, values for the various weightings grew until by 2014 they added 85 percent to base state aid. A nearby chart shows the growth of total state aid as compared to base state aid. (Starting in fiscal 2015 the state changed the way local tax dollars are counted. That accounts for the large rise for the last year of data in the chart. For school years 2016 and 2017, block grants have replaced the funding formula, so base aid and weightings do not apply in the same way.)

    What have we learned?

    We’re left wondering a few things:

    • Did Deputy Superintendent Dale Dennis tell the audience that base state aid is just part of the school funding landscape, and not reflective of the big picture? Did he tell the audience that total state aid to schools has increased, and increased substantially? If so, why wasn’t it mentioned in the article?
    • If Dale Dennis did not tell the audience these things, what conclusions should we draw about his truthfulness?
    • Why didn’t the Hutchinson News article explain to readers that base state aid is not an accurate or total indicator of total state spending on schools?
    • What is the duty of reporters and editors? We’re told that experienced journalists add background and context to the news — things that the average reader may not know. (This article is designated as “Editor’s Pick” by the Hutchinson News.)

    By the way, the Wichita Eagle, on its opinion page, cited in a positive and uncritical manner the Hutchinson News article.5 This is notable as the writer of the Eagle piece, opinion editor Phillip Brownlee, was a certified public accountant in a previous career. This is someone we should be able to trust to delve into numbers and tell us what they mean. But that isn’t the case.

    Whatever your opinion on the level and trend of school spending, we need to start the discussion from a common base of facts and information. From this episode, we see that both our state government and news media are not helping.

    For another take on the problems with this episode, see Paul Waggoner’s column in the Hutchinson News.6 (If not able to access that link, try Shocking News about Kansas Education!)


    Notes

    1. Clarkin, Mary. Department of Education’s Dennis: Shocking number when looking at funding gap. Hutchinson News. April 17, 2017. http://www.hutchnews.com/news/local_state_news/department-of-education-s-dennis-shocking-number-when-looking-at/article_4abe359e-8421-53f9-a8d7-1eaa56e95423.html.
    2. Weeks, Bob. Kansas school weightings and effects on state aid. In making the case for more Kansas school spending, the focus on base state aid per pupil leaves out important considerations. https://wichitaliberty.org/wichita-kansas-schools/kansas-school-weightings-and-effects-on-state-aid/.
    3. For the fiscal 2016 and 2017 school years, the formula was replaced by block grants.
    4. AMENDMENTS TO THE 1992 SCHOOL DISTRICT FINANCE AND QUALITY PERFORMANCE ACT AND THE 1992 SCHOOL DISTRICT CAPITAL IMPROVEMENTS STATE AID PROGRAM (FINANCE FORMULA COMPONENTS), Kansas Legislative Research Department, May 20, 2014
      http://ksde.org/Portals/0/School%20Finance/amends_to_sdfandqpa_2015.pdf
    5. Brownlee, Philip. School funding numbers are ‘shocking.’ Wichita Eagle. April 22, 2017. http://www.kansas.com/opinion/opn-columns-blogs/now-consider-this/article146084839.html.
    6. Waggoner, Paul. Shocking news about Kansas education. Hutchinson News. April 21, 2017. http://www.hutchnews.com/opinion/columnists/shocking-news-about-kansas-education/article_2ebea7d3-6659-51fc-b3b5-409d5b0aa243.html. Or, see http://wichitaliberty.org/kansas-government/shocking-news-kansas-education/.
  • Kansas state school assessments

    Kansas state school assessments

    An interactive presentation of Kansas state school assessment scores at the state, district, and building levels.

    Kansas State Department of Education makes available school assessment results at its website Kansas Building Report Card, available at ksreportcard.ksde.org. The present assessments were first given in 2014, although results for that year were not made available.1

    KSDE background explains that scores on the tests are categorized in four levels: “Kansas assessment results are now reported in four levels. Level 1 indicates that student is not performing at grade-level standards. Level 2 indicates that the student is doing grade-level work as defined by the standards but not at the depth or level of rigor to be considered on-track for college success. Level 3 indicates that the student is performing at academic expectations for that grade and is on track to being college ready. Level 4 indicates that the student is performing above expectations and is on-track to being college ready.”

    When KSDE presents assessment results through the report card website, it shows the percent of students whose scores fall into each category. While this is useful, I present the data in a different way, using these categories:

    • Level 1
    • Level 2 or higher
    • Level 3 or higher
    • Level 4

    Thus, “Level 2 or higher” holds the percentage of students doing grade-level work or better, and “Level 3 or higher” holds the percentage of students on track to being college ready or better.

    There are three visualizations, one for building-level results, another for district-level results, and another for state-level. (Because of the differing sizes of buildings and districts, it is not possible to simply aggregate statistics to a higher level.)

    Here are the links to the visualizations:

    Example from the visualizations. Click for larger.


    Notes

  • Public education factbook for 2017

    Public education factbook for 2017

    The fifth edition of data on public schools in Kansas is available.

    Kansas Policy Institute has released a new edition of its Public Education Fact Book. KPI describes this book:

    KPI’s fifth annual Public Education Fact Book is a one-stop shop for data on public school information from The Sunflower State. Numerous scientific surveys show that citizens are grossly misinformed on many pertinent facts of public education in Kansas. Aid and spending per-pupil are much higher than many Kansans believe, and student achievement is lower than understood. This fact book series aims to rectify this situation.

    This document is available to read online here, or contact KPI for a printed copy.

  • Accountability in Kansas public schools

    Accountability in Kansas public schools

    Critics of school choice say there is no accountability outside the traditional public schools. Here are the standards Kansas used to hold its schools accountable.

    Are non-traditional public schools held properly accountable? Do charter schools and private schools escape the accountability standards states use for their traditional public schools, particularly in Kansas?

    A standard argument against school choice is that charter schools and private schools are not held accountable. Underlying this argument is the assumption that parents have neither the time nor technical expertise to properly evaluate the schools their children attend. Only those with special training can do this, goes the argument.

    This argument is troubling because it is often directed at parents of minority children, or parents who are from low-income households, or parents who may not be highly educated. Besides being elitist and bigoted, it doesn’t recognize the poor job that Kansas state education officials have done holding public schools accountable. Fortunately, Kansas school officials have corrected this, but it doesn’t make up for the years that Kansas purposefully used low standards to evaluate students, and told us students were doing well.

    The former Kansas school standards for grade four reading, showing Kansas ranking low among the states.
    The former Kansas school standards for grade four reading, showing Kansas ranking low among the states. Click for larger.
    For years Kansas schools have used low standards to evaluate students. That is, Kansas was willing to say students are “proficient” at a much lower level of performance than most other states. Worse than that, during the 2005 to 2009 time period, Kansas actually weakened its standards.1 Coincidentally, this was during the time that Kansas courts ordered more spending in Kansas schools, and the legislature generally complied.

    The new Kansas standards, however, are more in line with those of other states, and present a more truthful assessment of Kansas schoolchildren.

    This is the finding of the EducationNext report After Common Core, States Set Rigorous Standards.2 EducationNext is a scholarly journal published by the Hoover Institution and the Harvard Program on Education Policy and Governance at the Harvard Kennedy School that is committed to careful examination of evidence relating to school reform.

    The report compares the proportion of students considered “proficient” on states’ own exams with that of the National Assessment of Educational Progress (NAEP), known as “The Nation’s Report Card.” The EducationNext report explains:

    Data from both the NAEP and state tests allow for periodic assessments of the rigor of each state’s proficiency standards. If the percentage of students identified as proficient in any given year is essentially the same for both the NAEP and the state exams, we can infer that the state has established as strict a proficiency standard as that of the NAEP. But if the state identifies a higher percentage of students as proficient than the NAEP, we can conclude that the state has set its proficiency bar lower than that of the NAEP.

    From 2003 to 2013 the Kansas standards were weak, earning letter grades ranging from “C” to “D” in the EducationNext reports. In another similar study, the Mapping State Proficiency Standards Onto NAEP Scales series from National Center for Education Statistics, Kansas standards were also found to be low compared to other states. NCES is part of the United States Department of Education and the primary federal entity for collecting and analyzing data related to education. It has not yet examined the 2015 NAEP and state exam scores.

    Now, after comparing Kansas state assessments to the 2015 NAEP exam, Kansas earns a grade of “A” from EducationNext for the strength of its standards.

    This grade of “A” does not reflect the performance of Kansas schoolchildren on tests. Instead, it means that the state has raised the definition of proficient to a higher level. A presentation by Kansas State Department of Education to the Kansas State Board of Education explains the relationship of the new standards to the former:

    The Kansas College and Career Ready Standards are more rigorous than the previous Kansas Standards. The Mathematics test is more demanding than even the ACT and taken a year earlier. The assessment is also more demanding than the NAEP assessment. Kansas takes seriously the current issues of college dropout and remediation rates and feels higher standards are necessary to help remedy the problem.3 4

    Kansas is not alone in making a change, according to the EducationNext report:

    The results are striking: The last two years have witnessed the largest jump in state standards since they were established as part of the federal accountability program. Overall, 36 states have strengthened their standards since 2013, while just 5 have loosened them, and 7 have left their standards essentially unchanged.

    This is a refreshing change for Kansas. It means that after many years of evaluating students with weak standards and low expectations, Kansas now has reasonable standards.

    But who do we hold accountable for the years of having low standards and further weakening them, while at the same time telling us Kansas students were performing well on tests?


    Notes

    1. Weeks, Bob. Kansas has lowered its school standards. https://wichitaliberty.org/wichita-kansas-schools/kansas-has-lowered-its-school-standards/.
    2. http://educationnext.org/after-common-core-states-set-rigorous-standards/.
    3. Kansas State Department of Education. Cut Scores for the Kansas Assessment Program. Archived at https://drive.google.com/file/d/0B97azj3TSm9MdTJhRVBEeEg3NTA/view.
    4. Also, see Kansas State Department of Education, Office of the Commissioner. Kansas College and Career Academic Readiness Asessment. http://www.ksde.org/LinkClick.aspx?fileticket=KCpy0dXYuzc%3D&tabid=561&portalid=0&mid=3121.
  • Year in Review: 2016

    Year in Review: 2016

    Here are highlights from Voice for Liberty for 2016. Was it a good year for the principles of individual liberty, limited government, economic freedom, and free markets in Wichita and Kansas?

    Also be sure to view the programs on WichitaLiberty.TV for guests like journalist, novelist, and blogger Bud Norman; Radio talk show host Joseph Ashby; David Bobb, President of Bill of Rights Institute; Heritage Foundation trade expert Bryan Riley; Radio talk show host Andy Hooser; Keen Umbehr; John Chisholm on entrepreneurship; James Rosebush, author of “True Reagan,” Jonathan Williams of American Legislative Exchange Council (ALEC); Gidget Southway, or Danedri Herbert; Lawrence W. Reed, president of the Foundation for Economic Education; and Congressman Mike Pompeo.

    January

    Kansas legislative resources. Citizens who want to be informed of the happenings of the Kansas Legislature have these resources available.

    School choice in Kansas: The haves and have-nots. Kansas non-profit executives work to deny low-income families the school choice opportunities that executive salaries can afford.

    Kansas efficiency study released. An interim version of a report presents possibilities of saving the state $2 billion over five years.

    Wichita Eagle Publisher Roy Heatherly. Wichita Eagle Publisher Roy Heatherly spoke to the Wichita Pachyderm Club on January 15, 2016. This is an audio presentation.

    Pupil-teacher ratios in the states. Kansas ranks near the top of the states in having a low pupil-teacher ratio.

    Kansas highway conditions. Has continually “robbing the bank of KDOT” harmed Kansas highways?

    Property rights in Wichita: Your roof. The Wichita City Council will attempt to settle a dispute concerning whether a new roof should be allowed to have a vertical appearance rather than the horizontal appearance of the old.

    Must it be public schools? A joint statement released by Kansas Association of School Boards, United School Administrators of Kansas, Kansas School Superintendents’ Association, and Kansas National Education Association exposes the attitudes of the Kansas public school establishment.

    Kansas schools and other states. A joint statement released by Kansas Association of School Boards, United School Administrators of Kansas, Kansas School Superintendents’ Association, and Kansas National Education Association makes claims about Kansas public schools that aren’t factual.

    After years of low standards, Kansas schools adopt truthful standards. In a refreshing change, Kansas schools have adopted realistic standards for students, but only after many years of evaluating students using low standards.

    Brownback and Obama stimulus plans. There are useful lessons we can learn from the criticism of Kansas Governor Sam Brownback, including how easy it is to ignore inconvenient lessons of history.

    February

    Spending and taxing in Kansas. Difficulty balancing the Kansas budget is different from, and has not caused, widespread spending cuts.

    In Sedgwick County, choosing your own benchmarks. The Sedgwick County Commission makes a bid for accountability with an economic development agency, but will likely fall short of anything meaningful.

    This is why we must eliminate defined-benefit public pensions. Actions considered by the Kansas Legislature demonstrate — again — that governments are not capable of managing defined-benefit pension plans.

    Kansas transportation bonds economics worse than told. The economic details of a semi-secret sale of bonds by the State of Kansas are worse than what’s been reported.

    Massage business regulations likely to be ineffective, but will be onerous. The Wichita City Council is likely to create a new regulatory regime for massage businesses in response to a problem that is already addressed by strict laws.

    Inspector General evaluates Obamacare website. The HHS Inspector General has released an evaluation of the Obamacare website HealthCare.gov, shedding light on the performance of former Kansas Governor Kathleen Sebelius.

    Kansas highway spending. An op-ed by an advocate for more highway spending in Kansas needs context and correction.

    Brookings Metro Monitor and Wichita. A research project by The Brookings Institution illustrates the poor performance of the Wichita-area economy.

    March

    Wichita: A conversation for a positive community and city agenda. Wichita City Manager Robert Layton held a discussion titled “What are Wichita’s Strengths and Weaknesses: A Conversation for a Positive Community and City Agenda” at the February 26, 2016 luncheon of the Wichita Pachyderm Club.

    In Kansas, teachers unions should stand for retention. A bill requiring teachers unions to stand for retention elections each year would be good for teachers, students, and taxpayers.

    In Kansas, doctors may “learn” just by doing their jobs. A proposed bill in Kansas should make us question the rationale of continuing medical education requirements for physicians.

    Power of Kansas cities to take property may be expanded. A bill working its way through the Kansas Legislature will give cities additional means to seize property.

    Wichita TIF district disbands; taxpayers on the hook. A real estate development in College Hill was not successful. What does this mean for city taxpayers?

    Kansas and Colorado, compared. News that a Wichita-based company is moving to Colorado sparked a round of Kansas-bashing, most not based on facts.

    In Wichita, the phased approach to water supply can save a bundle. In 2014 the City of Wichita recommended voters spend $250 million on a new water supply. But since voters rejected the tax to support that spending, the cost of providing adequate water has dropped, and dropped a lot.

    Wichita Eagle, where are you? The state’s largest newspaper has no good reason to avoid reporting and editorializing on an important issue. But that’s what the Wichita Eagle has done.

    April

    Wichita on verge of new regulatory regime. The Wichita City Council is likely to create a new regulatory regime for massage businesses in response to a problem that is already addressed by strict laws.

    Wichita economic development and capacity. An expansion fueled by incentives is welcome, but illustrates a larger problem with Wichita-area economic development.

    Rich States, Poor States, 2106 edition. In Rich States, Poor States, Kansas continues with middle-of-the-pack performance, and fell sharply in the forward-looking forecast.

    In Wichita, revealing discussion of property rights. Reaction to the veto of a bill in Kansas reveals the instincts of many government officials, which is to grab more power whenever possible.

    ‘Trump, Trump, Trump’ … oops! An event in Wichita that made national headlines has so far turned out to be not the story news media enthusiastically promoted.

    Wichita doesn’t have this. A small Kansas city provides an example of what Wichita should do.

    Kansas continues to snub school choice reform that helps the most vulnerable schoolchildren. Charter schools benefit minority and poor children, yet Kansas does not leverage their benefits, despite having a pressing need to boost the prospects of these children.

    Wichita property tax rate: Up again. The City of Wichita says it hasn’t raised its property mill levy in many years. But data shows the mill levy has risen, and its use has shifted from debt service to current consumption.

    AFP Foundation wins a battle for free speech for everyone. Americans for Prosperity Foundation achieves a victory for free speech and free association.

    Kansas Center for Economic Growth. Kansas Center for Economic Growth, often cited as an authority by Kansas news media and politicians, is not the independent and unbiased source it claims to be.

    Under Goossen, Left’s favorite expert, Kansas was admonished by Securities and Exchange Commission. The State of Kansas was ordered to take remedial action to correct material omissions in the state’s financial statements prepared under the leadership of Duane Goossen.

    May

    Spirit Aerosystems tax relief. Wichita’s largest employer asks to avoid paying millions in taxes, which increases the cost of government for everyone else, including young companies struggling to break through.

    Wichita mayor’s counterfactual op-ed. Wichita’s mayor pens an op-ed that is counter to facts that he knows, or should know.

    Electioneering in Kansas?. An op-ed written under the banner of a non-profit organization appears to violate the ban on electioneering.

    Wichita city council campaign finance reform. Some citizen activists and Wichita city council members believe that a single $500 campaign contribution from a corporation has a corrupting influence. But stacking dozens of the same $500 contributions from executives and spouses of the same corporation? Not a problem.

    In Wichita, more sales tax hypocrisy. Another Wichita company that paid to persuade you to vote for higher taxes now seeks to avoid paying those taxes.

    Wichita student/teacher ratios. Despite years of purported budget cuts, the Wichita public school district has been able to improve its student/teacher ratios.

    June

    KPERS payments and Kansas schools. There is a claim that a recent change in the handling of KPERS payments falsely inflates school spending. The Kansas State Department of Education says otherwise.

    Regulation in Wichita, a ‘labyrinth of city processes’. Wichita offers special regulatory treatment for special circumstances, widening the gulf between the haves and have-nots.

    They really are government schools. What’s wrong with the term “government schools?”

    July

    Kansas City Star as critic, or apologist. An editorial in the Kansas City Star criticizes a Kansas free-market think tank.

    State and local government employee and payroll. Considering all state and local government employees in proportion to population, Kansas has many, compared to other states, and especially so in education.

    Kansas government ‘hollowed-out’. Considering all state and local government employees in proportion to population, Kansas has many, compared to other states, and especially so in education.

    In Wichita, Meitzner, Clendenin sow seeds of distrust. Comments by two Wichita city council members give citizens more reasons to be cynical and distrusting of politicians.

    David Dennis, gleeful regulatory revisionist. David Dennis, candidate for Sedgwick County Commission, rewrites his history of service on the Kansas State Board of Education.

    Say no to Kansas taxpayer-funded campaigning. Kansas taxpayers should know their tax dollars are helping staff campaigns for political office.

    Roger Marshall campaign setting new standards. Attacks on Tim Huelskamp reveal the worst in political campaigning.

    Wichita Metro Chamber of Commerce on the campaign trail. We want to believe that The Wichita Metro Chamber of Commerce and its PAC are a force for good. Why does the PAC need to be deceptive and untruthful?

    August

    Which Kansas Governor made these proposals?. Cutting spending for higher education, holding K through 12 public school spending steady, sweeping highway money to the general fund, reducing aid to local governments, spending down state reserves, and a huge projected budget gap. Who and when is the following newspaper report referencing?

    Wichita Business Journal editorial missed the news on the Wichita economy. A Wichita business newspaper’s editorial ignores the history of our local economy. Even the history that it reported in its own pages.

    Sedgwick County Health Department: Services provided. Sedgwick County government trimmed spending on health. What has been the result so far?

    School staffing and students. Trends for the nation and each state in teachers, administrators, and students, presented in an interactive visualization.

    Intrust Bank Arena loss for 2015 is $4.1 million. The depreciation expense of Intrust Bank Arena in downtown Wichita recognizes and accounts for the sacrifices of the people of Sedgwick County and its visitors to pay for the arena.

    School spending in the states. School spending in the states, presented in an interactive visualization.

    September

    Kansas construction employment. Tip to the Wichita Eagle editorial board: When a lobbying group feeds you statistics, try to learn what they really mean.

    Wichita has no city sales tax, except for these. There is no Wichita city retail sales tax, but the city collects tax revenue from citizens when they buy utilities, just like a sales tax.

    CID and other incentives approved in downtown Wichita. The Wichita City Council approves economic development incentives, but citizens should not be proud of the discussion and deliberation.

    Cost per visitor to Wichita cultural attractions. Wichitans might be surprised to learn the cost of cultural attractions.

    GetTheFactsKansas launched. From Kansas Policy Institute and the Kansas Chamber of Commerce, a new website with facts about the Kansas budget, economy, and schools.

    The nation’s report card and charter schools.
    * An interactive table of NAEP scores for the states and races, broken down by charter school and traditional public school.
    * Some states have few or no charter schools.
    * In many states, minority students perform better on the NAEP test when in charter schools.

    School choice and funding. Opponents of school choice programs argue the programs harm traditional public schools, both financially and in their ability to serve their remaining students. Evidence does not support this position.

    October

    Public school experts. Do only those within the Kansas public schooling community have a say?

    Kansas and Arizona schools. Arizona shows that Kansas is missing out on an opportunity to provide better education at lower cost.

    Video in the Kansas Senate. A plan to increase visibility of the Kansas Senate is a good start, and needs to go just one or two steps farther.

    Kansas, a frugal state?. Is Kansas a frugal state, compared to others?

    Topeka Capital-Journal falls for a story. The editorial boards of two large Kansas newspapers have shown how little effort goes into forming the opinions they foist upon our state.

    Kansas revenue estimates. Kansas revenue estimates are frequently in the news and have become a political issue. Here’s a look at them over the past decades.

    Kansas school fund balances.
    * Kansas school fund balances rose significantly this year, in both absolute dollars and dollars per pupil.
    * Kansans might wonder why schools did not spend some of these funds to offset cuts they have contended were necessary.
    * The interactive visualization holds data for each district since 2008.

    In Wichita, developer welfare under a cloud. A downtown Wichita project receives a small benefit from the city, with no mention of the really big money.

    Wichita, give back the Hyatt proceeds. Instead of spending the proceeds of the Hyatt hotel sale, the city should honor those who paid for the hotel — the city’s taxpayers.

    Kansas Democrats: They don’t add it up — or they don’t tell us. Kansas Democrats (and some Republicans) are campaigning on some very expensive programs, and they’re aren’t adding it up for us.

    November

    How would higher Kansas taxes help?. Candidates in Kansas who promise more spending ought to explain just how higher taxes will — purportedly — help the Kansas economy.

    Decoding the Kansas teachers union. Explaining to Kansans what the teachers union really means in its public communications.

    Kansas school spending: Visualization. An interactive visualization of revenue and spending data for Kansas school districts.

    Decoding Duane Goossen. The writing of Duane Goossen, a former Kansas budget director, requires decoding and explanation. This time, his vehicle is “Rise Up, Kansas.”

    Decoding the Kansas teachers union. Decoding and deconstructing communications from KNEA, the Kansas teachers union, lets us discover the true purpose of the union.

    Government schools’ entitlement mentality. If the Kansas personal income grows, should school spending also rise?

    December

    Wichita bridges, well memorialized. Drivers on East Twenty-First Street in Wichita are happy that the work on a small bridge is complete, but may not be pleased with one aspect of the project.

    Gary Sherrer and Kansas Policy Institute. A former Kansas government official criticizes Kansas Policy Institute.

    Wichita to grant property and sales tax relief. Several large employers in Wichita ask to avoid paying millions in taxes, which increases the cost of government for everyone else, including young companies struggling to break through.

    Economic development incentives at the margin. The evaluation of economic development incentives in Wichita and Kansas requires thinking at the margin, not the entirety.

    The Wichita economy, according to Milken Institute. The performance of the Wichita-area economy, compared to other large cities, is on a downward trend.

    State pension cronyism. A new report details the way state pension funds harm workers and taxpayers through cronyism.

    In Wichita, converting a hotel into street repairs. In Wichita, it turns out we have to sell a hotel in order to fix our streets.

    In Wichita, we’ll not know how this tax money is spent. Despite claims to the contrary, the attitude of the City of Wichita towards citizens’ right to know is poor, and its attitude will likely be reaffirmed this week.

  • Decoding the Kansas teachers union

    Decoding the Kansas teachers union

    Decoding and deconstructing communications from KNEA, the Kansas teachers union, lets us discover the true purpose of the union.

    Here, we look at a dispatch from Kansas National Education Association’s “Under the Dome” newsletter from March 14, 2013. It may be found here. The topic of this day was a charter school bill. Kansas has a law that allows charter schools, which are public schools that operate outside many of the rules and regulations that govern traditional public schools. But the Kansas law is written in a way that makes it difficult to form a charter school, and as a result, Kansas has very few charter schools.

    KNEA, the teacher union in Kansas, says: Rep. Ed Trimmer noted that a study provided by the proponents (anti-public school “think tank” Kansas Policy Institute) reported that the worst performing charter schools are in states that have multiple charter school “authorizers” — just like this bill.

    This sentence holds much of the key to understanding the motives of the teachers union, and the rest of the public school spending lobby. First, they use the term “anti-public school.” This lets us know that for all the bluster coming from the teachers union and its allies about the importance of education and Kansas schoolchildren, it is only public schools that interest them. The simple reason is that in private schools and charter schools, the teachers aren’t union members. It is those union members that the union cares about. Other schools where teachers can work free of the union and its influence are competition to the union.

    The use of “think tank” lets us know that the union doesn’t think Kansas Policy Institute is deserving of respect. KPI uses government data to show the true state of Kansas public education, so naturally the teachers union needs to suppress the tellers of truth.

    By the way, I don’t think KPI is “anti-public school.” KPI advocates for school choice, to be sure, but school choice programs comfortably co-exist with public schools in many states. And — let’s remind the teachers union that charter schools are public schools.

    Then the use of “authorizers” in quotes: Charter school authorizers oversee the charter schools they authorized. In Kansas, the only charter school authorizers are local school boards, and they have shown very little willingness to authorize charters. Here’s what is interesting: In some states with good charter school laws, authorizers must hold their charter schools accountable. In Denver, for the 2011 school year, 25 percent of the charters seeking renewal were closed.1 (There, charters are reauthorized every third year.) That type of accountability is rarely seen in the traditional public schools, where poor-performing schools live on, year after year.

    The teachers union says: The Committee reconvened at 1:30 to get a special presentation by anti-public school zealot Dave Trabert of the “think tank” Kansas Policy Institute. Trabert sold his usual snake oil denouncing Kansas public schools as failing most students and thoroughly confused the committee with his talk of NAEP, NCLB, RTTT, state assessments, cut scores and the performance of Texas schools compared to Kansas.

    See? The teachers union doesn’t like to talk about the performance of Kansas schools. Anyone who presents the data is denounced. It’s easy to see why. The U.S. Department of Education, through the National Center for Education Statistics (NCES), conducts the National Assessment of Educational Progress (NAEP) every other year. Known as “The Nation’s Report Card,” it is “the largest nationally representative and continuing assessment of what America’s students know and can do in various subject areas.”2 The important thing to remember is that the test is not under the control of states. It is the same in all states, and allows for state-to-state comparisons. (More about this in a moment.)

    Kansas and Texas NAEP scores. Click for larger.
    Kansas and Texas NAEP scores. Click for larger.
    Nearby is a chart showing performance on the NAEP test. It presents data for grade four reading over time, divided by major categories of race. It shows the percent of students scoring at the level of Basic or better, and on a separate scale, at Proficient or better.

    Looking at the first column of data, labeled “All Students,” we can see that Kansas performs better than Texas in every year. It is this finding that the teachers union and its allies use to promote the goodness of Kansas schools.

    Aggregated data like this can hide some underlying truths. Look at the third column, reporting scores for black students. For “At or above Proficient,” Kansas and Texas students perform nearly the same. For Basic or better, Texas has the clear advantage in most years.

    Similar investigation reveals that for Hispanic students, Texas and Kansas score nearly the same. For white students, Texas scores better than Kansas in each year.

    So which schools are better in fourth grade reading, Kansas or Texas? If you were the parent of a young black child learning to read, Texas is doing a better job. For that matter, if you were the parent of a young white child learning to read, Texas has been doing a better job than has Kansas.

    (By the way, Texas spends less on its schools than Kansas, on a per-pupil basis.3)

    (These charts are derived from an interactive visualization of NAEP scores that I developed. You may access it here to conduct your own investigations.)

    We can see why the teachers union demeans and demonizes those who present data like this.

    The former Kansas school standards for grade four reading, showing Kansas ranking low among the states.
    The former Kansas school standards for grade four reading, showing Kansas ranking low among the states.
    Why are NAEP scores important? Doesn’t the State of Kansas have its own tests? The answer is yes, Kansas has its own tests. And until recently these tests — the standards that the state used to measure achievement — were very weak. That is, Kansas was willing to say students are “proficient” at a much lower level of performance than most other states. In some cases, just a handful of states had lower standards than Kansas. But now the new Kansas standards are more in line with those of other states, and present a more truthful assessment of Kansas schoolchildren. Not surprisingly, scores on the new tests are lower.4

    In the past, the teachers union and its allies used the (generally good) performance on these very weak Kansas tests to conclude that Kansas schools were performing well. But that was a lie.

    The teachers union says: He was joined via Skype by noted ideological researcher Matthew Ladner. Ladner, who greatly admires Jeb Bush and Florida schools was brought to Kansas by Trabert and KPI once before. Only back then his presentation was colored by the fact that he won a “Bunkum Award” from the National Educational [sic] Policy Center (NEPC). The NEPC, located at the University of Colorado is a national consortium of education researchers and academicians who review the reports of think tanks to make sure it is based on sound research standards.

    First, Florida schools perform well on the NAEP, relative to Kansas. If you need convincing, use the visualization of NAEP scores referenced above to compare Florida and Kansas. You’ll find many cases where Florida does better than Kansas.

    (By the way, Florida spends less than Kansas on schools, on a per-pupil base.3 This is the real problem the teachers union and its allies have with Florida and Texas: These states spend less than Kansas.)

    Now: What is the National Education Policy Center (NEPC)? Just like the Kansas teachers union says, it reviews the reports of think tanks. And when it does, its criticisms are routinely shredded when placed under scrutiny. (Example criticism of one NEPC writer: “His review is deeply flawed and significantly misrepresents our data and findings.6) Almost all the reports it finds to be faulty are published by conservative/libertarian think tanks, although I did see a Brookings Institute report criticized.

    Here’s something else: The Kansas teachers union and its allies vigorously attempt to discredit KPI because of its purported funders. If that is a valid concern or criticism, consider this. NEPC’s funders include the National Education Association and the American Federation of Teachers.7 Teachers unions funding research to discredit non-union schools. Who could have figured?

    Now we ask this: Should we hold the Kansas teachers union to the same standards it expects of others?


    Notes

    1. Colorado League of Charter Schools.
    2. National Assessment of Educational Progress. About. Available at nces.ed.gov/nationsreportcard/about/.
    3. U.S. Census Bureau. Annual Survey of School System Finances: Per Pupil Amounts for Current Spending of Public Elementary-Secondary School Systems by State: Fiscal Year 2014. https://factfinder.census.gov/bkmk/table/1.0/en/SSF/2014/00A08.
    4. Weeks, Bob. After years of low standards, Kansas schools adopt truthful standards. https://wichitaliberty.org/wichita-kansas-schools/after-years-of-low-standards-kansas-schools-adopt-truthful-standards/.
    5. U.S. Census Bureau. Annual Survey of School System Finances: Per Pupil Amounts for Current Spending of Public Elementary-Secondary School Systems by State: Fiscal Year 2014. https://factfinder.census.gov/bkmk/table/1.0/en/SSF/2014/00A08.
    6. Jim Kessler, Tess Stovall, and Dee Dee Dolan. A Response to the National Education Policy Center: “NEPC review is fatally flawed.” http://www.thirdway.org/memo/a-response-to-the-national-education-policy-center-nepc-review-is-fatally-flawed.
    7. National Education Policy Center. Support. http://nepc.colorado.edu/support.
  • Public school experts

    Public school experts

    Do only those within the Kansas public schooling community have a say?

    In a letter to the Wichita Eagle, a longtime educator asks “Just how much confidence in the schooling community should taxpayers embrace?”1

    The answer should be: Some.

    The author’s primary topic in this letter was school funding. He writes that public school educators are best qualified to decide school funding issues, and we should trust their judgment.

    The problem is that public school educators have a self-interest in this matter that goes beyond the achievement of Kansas schoolchildren. Teachers complain that class sizes are too large. At what level would teachers agree that their classes are not oversized? When making that decision, do they weigh the much larger expenditures that will be required to reduce class sizes substantially?

    The success of class size reduction has a mixed record. For example, when the Brookings Institution surveyed the literature, it came to this conclusion: “Class-size reduction has been shown to work for some students in some grades in some states and countries, but its impact has been found to be mixed or not discernable in other settings and circumstances that seem similar. It is very expensive.”2

    More importantly, do educators consider that smaller class sizes mean more teachers, and that if school districts have hired the best teachers first, then any additional teachers hired must be (by definition) less qualified than current teachers? This is important because teacher quality is known to be — by far — the largest factor in student achievement.3

    Small classes are good. Most people like personalized attention. But teacher quality really matters:

    Eric Hanushek, an economist at Stanford, estimates that the students of a very bad teacher will learn, on average, half a year’s worth of material in one school year. The students in the class of a very good teacher will learn a year and a half’s worth of material. That difference amounts to a year’s worth of learning in a single year. Teacher effects dwarf school effects: your child is actually better off in a “bad” school with an excellent teacher than in an excellent school with a bad teacher. Teacher effects are also much stronger than class-size effects. You’d have to cut the average class almost in half to get the same boost that you’d get if you switched from an average teacher to a teacher in the eighty-fifth percentile. And remember that a good teacher costs as much as an average one, whereas halving class size would require that you build twice as many classrooms and hire twice as many teachers.4

    Wichita school district student-teacher ratios. While not the same measure as class size, these ratios have generally improved or remained constant.
    Wichita school district student-teacher ratios. While not the same measure as class size, these ratios have generally improved or remained constant.

    Despite this, our state’s public school establishment tells us that we must have smaller classes.

    Besides the obvious self-interest of public school educators, there is also this: They have lied to us. Blatantly. For years our state’s education leaders have told us that Kansas schoolchildren score well on the state’s achievements test. This should be good news, but the Kansas tests were much less stringent that other states’ test. The National Center for Education Statistics, part of the U.S. Department of Education, has published many studies over the years that documented the weakness of the Kansas assessments. For some years, only a handful of states had standards weaker than ours.5 6

    Finally, last year Kansas adopted realistic standards. A presentation by the Kansas State Department of Education to the Kansas State Board of Education explained the relationship of the new standards to the former: “The Kansas College and Career Ready Standards are more rigorous than the previous Kansas Standards.”7

    This admission came, however, after many years of telling us Kansas students were among the nations’ best. But Kansas students were taking easier tests.

    Undoubtedly those who work in our public schools have much knowledge about their operation and what needs to be fixed. But they have an obvious self-interest, and we need others to look at schools, too.


    Notes

    1. John H. Wilson. Trust judgment of school educators. Wichita Eagle, October 6, 2016. Available here.
    2. Grover J. “Russ” Whitehurst and Matthew M. Chingos. Class Size: What Research Says and What it Means for State Policy. Brookings Instutition. Available at http://www.brookings.edu/research/class-size-what-research-says-and-what-it-means-for-state-policy/.
    3. “For instance, the median finding across 10 studies of teacher effectiveness estimates that a teacher who is one standard deviation above the average in terms of quality produces additional learning gains for students of 0.12 standard deviations in reading and 0.14 standard deviations in math.” Dan Goldhaber. In Schools, Teacher Quality Matters Most. EducationNext. Available at educationnext.org/in-schools-teacher-quality-matters-most-coleman/.
    4. Gladwell, Malcolm. *Most Likely to Succeed.* Available at www.newyorker.com/magazine/2008/12/15/most-likely-to-succeed-malcolm-gladwell.
    5. Weeks, Bob. Kansas school standards evaluated. Available at wichitaliberty.org/wichita-kansas-schools/kansas-school-standards-evaluated/.
    6. Weeks, Bob. Kansas school standards found lower than in most states. Available at wichitaliberty.org/wichita-kansas-schools/kansas-school-standards-found-lower-than-in-most-states/.
    7. Weeks, Bob. After years of low standards, Kansas schools adopt truthful standards. Available at wichitaliberty.org/wichita-kansas-schools/after-years-of-low-standards-kansas-schools-adopt-truthful-standards/.