Tag: Education

  • New Symposium Society: Language Matters

    New Symposium Society: Language Matters

    From the New Symposium Society: Language Matters. Recorded October 15, 2019. Panelists were, in order of their first appearance:

    Russell Fox — moderator
    John Brungardt — philosopher
    Bill Coleman — linguist
    Dion Lefler — journalist
    Bob Weeks — publisher

    For more information on this event, see Language Matters.

  • In NAEP mapping study, Kansas shines

    In NAEP mapping study, Kansas shines

    In a new edition of a study that assesses the stringency of state school assessments, Kansas performs well.

    States are free to create their own tests to measure the performance of students in their schools. There is variability in how stringently states construct their tests.

    The U.S. Department of Education, through the National Center for Education Statistics (NCES), conducts the National Assessment of Educational Progress (NAEP) every other year. Known as “The Nation’s Report Card,” it is “the largest nationally representative and continuing assessment of what America’s students know and can do in various subject areas.” 1

    The value of NAEP is this, according to NCES:

    Since standards vary across states, the results of the various state assessments cannot be used to directly compare students’ progress. However, by placing a state standard onto the NAEP scale, a common metric for all states, a NAEP equivalent score of that standard is produced, which can be compared across states.

    The Mapping State Proficiency Standards report provides the results of this analysis. 2

    From the technical notes to the report: “NAEP provided a common scale on which the stringency of the various state criteria for proficiency could be compared.” The purpose of the study is to map each state’s standards to a common standard. By doing this, we can determine whether a state uses a stringent or weak standard to evaluate students. This study does not evaluate the performance — good or bad — of a state’s students. Rather, the study evaluates the state and its standards.

    In years past, the rigor of the Kansas standards have been found by this study to be low, compared to other states. 3 Then, the standards improved. 4

    Now, the recently-released mapping study shows Kansas to have high standards, in some cases the highest in the nation. This analysis by NCES is based on the 2017 administration of NAEP.

    In the nearby illustration taken from the NCES mapping study, states with stronger standards appear on the right end of the scale. Kansas is somewhat above the middle. For grade 4 math, Kansas ranked higher.

    Click for larger.

    For both grade 8 reading and math, Kansas standards were judged most stringent of all states.

    Click for larger.

    This is good news. It means that the Kansas tests are providing a more realistic assessment of Kansas students. Again, this mapping study measures the tests, not the performance of students taking the test. Regarding performance, when properly considered, Kansas often underperforms the nation. 5


    Notes

    1. National Assessment of Educational Progress. About. Available at nces.ed.gov/nationsreportcard/about/.
    2. National Center for Education Statistics. Mapping State Proficiency Standards. Available at ah.* Available at https://nces.ed.gov/nationsreportcard/studies/statemapping/.
    3. Weeks, Bob. Kansas school standards evaluated. Available at https://wichitaliberty.org/wichita-kansas-schools/kansas-school-standards-evaluated/.
    4. Weeks, Bob. Accountability in Kansas public schools. Available at https://wichitaliberty.org/wichita-kansas-schools/accountability-in-kansas-public-schools/.
    5. Weeks, Bob. NAEP results for 2017 available in interactive visualizations. Available at https://wichitaliberty.org/education/naep-results-for-2017-available-in-interactive-visualizations/.
  • Wichita public schools, by the charts

    Wichita public schools, by the charts

    Data from the annual report for USD 259, the Wichita, Kansas, public school district.

    The Comprehensive Annual Financial Report for USD 259, the Wichita public school district, provides a look at trends over the years. The document, along with those from previous years, is available here. Here are some highlights from the CAFR for the year ending June 30, 2018, known as fiscal year 2018.

    (Click charts for larger versions.)

    The following chart shows data from the CAFR along with my calculations. I took two data series, “total revenue” and “sum of state and local revenue,” then divided by FTE enrollment and adjusted for inflation. (The inflation adjustments cast past dollar values in terms of current-dollar equivalents, meaning past values are usually reduced.) I plot the sum of state and local revenue because in 2015 there was a change in the way some taxes were allocated. Plotting the sum of the two removes the effect of the change.

    While USD 259 — and schools generally — complain about funding cuts, the following chart shows funding nearly always increases, and over time, by quite a bit.

    The following chart shows spending categorized by “instruction” and “instructional support” per student in inflation-adjusted dollars. Capital spending is not included in this chart.

    In 2006, USD 259 spent $579 per student (inflation-adjusted) on administration. For 2018 the figure is $927. Could the Wichita public school district cut administration spending to 2006 levels, on a per-student, inflation-adjusted basis?

    The Wichita school district has been able to reduce its student/teacher ratios substantially over the last ten to fifteen years. (Student/teacher ratio is not the same statistic as class size.) There have been ups and downs along the way, but for all three school levels, the ratios are lower than they were years ago, and by substantial margins. This means that Wichita schools have been able to increase employment of teachers at a faster rate than enrollment has risen.

    On enrollment, the superintendent’s letter says this:

    The District’s enrollment trend over the last ten years has reflected an average increase of over 100 students a year. However, budget reduction measures and changes to Kindergarten funding at the state level are beginning to impact this trend. In FY’17, official enrollment decreased by 572 students, or one percent. Official enrollment in FY’18 increased by 80 students, but gains in virtual and alternative programs were offset by a significant decrease in elementary age students. The elementary enrollment decline continued into FY’19, with a loss of over 500 elementary students. Offsetting some of this loss, Secondary enrollment increased by 240 students. The declines in past few years can partially be attributed to cost-cutting measures under the block grant, including denial of out-of-district students, the consolidation of alternative high school programs, and the combination of a longer school day and shorter school year, which many parents viewed as negatively impacting their students. Further, now that the State fully funds all-day Kindergarten, parent who used to enroll students in the District to obtain all-day Kindergarten services can now receive those same services in the surrounding area districts. Additional FY’19 funding allowed the District to return to the longer school year, but it remains unclear if this action will bring back elementary students to the District.’

    Since 2015, Kansas test scores have been reported in a new way. Kansas State Department of Education explains:

    Kansas assessment results are now reported in four levels. Level 1 indicates that a student shows a limited ability to understand and use the mathematics skills and knowledge needed for college and career readiness. Level 2 indicates that a student shows a basic ability to understand and use the mathematics skills and knowledge needed for college and career readiness. Level 3 indicates that a student shows an effective ability to understand and use the mathematics skills and knowledge needed for college and career readiness. Level 4 indicates that a student shows an excellent ability to understand and use the mathematics skills and knowledge needed for college and career readiness.

    For Wichita, the trend is that an increasing proportion of students are at performance level 1. Correspondingly, the proportion at level 2 or better is falling.

    Following, a chart of the portion of Wichita public school students testing at performance level 1, the lowest level.

    Following, for performance level 2 or better, indicating, “a student shows a basic ability to understand and use the mathematics skills and knowledge needed for college and career readiness.”

    Following, for performance level 3 or better, indicating, “a student shows an effective ability to understand and use the mathematics skills and knowledge needed for college and career readiness.”

    Following, for performance level 4, indicating, “a student shows an excellent ability to understand and use the mathematics skills and knowledge needed for college and career readiness.”

    Following, charts of suspensions and expulsions.

  • Kansas tax credit scholarship program

    Kansas tax credit scholarship program

    An op-ed in the Wichita Eagle regarding school choice prompts uninformed and misinformed comments.

    An op-ed written by James Franko appearing in the Wichita Eagle explains the importance of the Kansas Tax Credit for Low Income Students Scholarship Program. This is a program that awards scholarships to students to attend schools of choice. It is a small program. For the school year ending in 2018, 292 students received scholarships totaling $675,892.63. This represents one of every 9,606 dollars spent on Kansas schools. For each group of 1,632 Kansas students, one received a tax credit scholarship. Yet, this program is seen as a threat to existing public schools.

    Following is Franko’s editorial, followed by some comments left by Wichita Eagle readers.

    Tax credit programs give parents power over their children’s education

    James Franko
    December 22, 2018

    James Franko is vice president and policy director at Kansas Policy Institute.

    Education in Kansas has evolved dramatically since settlers plowed out a life on the Plains. The one-room schoolhouse is gone and the local community coming together to hire a young woman to teach are left to the Little House stories that I read with my kids. Education is now a political debate where decisions are increasingly made far away from families, teachers and local communities.

    While certainly well-intended, people in Topeka and Washington, D.C., are making decisions, demanding paperwork and setting standards that remove parents and teachers from the driver’s seat. Our teachers and other educators deserve our admiration. But we’ve all heard a teacher lament “teaching to the test” or that money that doesn’t seem to reach the classroom.

    A recent column about school choice (“How school choice works in Kansas,” Nov. 29 Eagle) seems to confuse what public education is intended to be with what it currently is. Schools — public, private, and home — are tremendous parts of our community. They make our society vibrant as a by-product of preparing children to succeed.

    Dr. Sharon Iorio’s concern about expanded tax credit programs undermining public education gets it backward. The free association of people choosing a private school is equally important to “the bond that holds together our society…” as is a choice to send a child to a public school. The point is that tax credit programs, which are different from vouchers, put parents back in the primary role of educating their children. Kansas’ tax credit scholarships help low-income students attending the lowest-performing schools in our state. It is almost paradoxical, but there is evidence from around the country that achievement increases in public schools when school choice is an option.

    America and Kansas have always been a patchwork of communities and cultures. This is what makes a road trip so great. We get to experience the different flavors of American life, many of them from our immigrant history. Expanding private school choice enhances and protects this diversity by allowing parents to decide where their children are educated. Local educators and parents will decide what education looks like in a community. This is in contrast to a one-size-fits-all approach taken when standards are dictated, tests are mandated and policies are implemented from afar.

    One approach captures the diversity of our communities and helps improve achievement for all students. The other homogenizes a rich community life and too often leaves student achievement stagnant.

    Following, some comments from Eagle readers. These comments show how much there is to learn about the actual Tax Credit for Low Income Students Scholarship Program.

    Who qualifies for scholarships?

    What people think: “The Kochs, err, KPI, wants private vouchers because it gives money to the wealthy to help pay for their expensive private schools.”
    “The tax credit idea mostly benefits religious schools.”
    “It’s a regressive tax meant for the 1%.”

    First, the guidelines from KSDE state: “An educational scholarship shall not exceed $8,000 per eligible student.” Expensive private schools cost more than this, but there are many private schools that do not. Also, $8,000 is less than the state spends on each student.

    Further, the scholarship program is limited to students who are “eligible for free lunch and attends a Title I Focus School or Title I Priority School.” This means a student from a low-income family.

    Still further, students over the age of six must have attended a public school in the year prior to receiving a scholarship. Students currently enrolled in private schools of any type, including church schools, are not eligible for a scholarship. 1

    Parents already have choice

    What people think: “You have always had, in fact anyone, freedom to choose where to send their child to school. Be it private or public.”

    This is cruel. The people who need school choice the most — poor children in inner-city schools — simply can’t afford tuition at even the most inexpensive private schools. Thinking like this ensures a permanent underclass cut off from private schools or even good public schools.

    Who gets the tax credits?

    What people think: “Tax credit is only if you make enough to apply for it and I have yet to see any of these minoritys and poor demanding school choice.”
    “When one can get 100% of their tax credit refunded and another family only gets a portion of their tuition refunded due to a low tax rate your playing a KPI pretend game without the facts.”

    These writers believe that the parents of scholarship students receive tax credits. Anyone who contributes to a scholarship-granting organization may receive a tax credit. Since scholarships are limited to students from low-income families, it’s not likely these families are able to make a contribution and receive a tax credit. Also, the writer who mentioned tax rates is confusing tax deductions with tax credits.

    Education only for those who can afford one

    What people think: “Right now people have the ability to get a free education. Under the Koch’s dream land, education would be reserved for those who could afford it.”

    Somehow, there are people who think that the goal of companies like Koch Industries and others is to have a poorly-educated population. But companies spend much time and effort recruiting educated and qualified employees to work in scientific laboratories, deal with complicated financial and accounting matters, drive innovation through information technology and other means, deliver health care, and perform numerous other tasks that benefit from a competent education.

    Then, don’t these companies want customers to buy their stuff? People with better educations earn more, buy more, and invest more. Companies want more of these people, not fewer.

    Without taxes and public schools, there will be no learning

    What people think: You don’t like paying taxes? You don’t like living where people can read and write? Go live in the woods.”

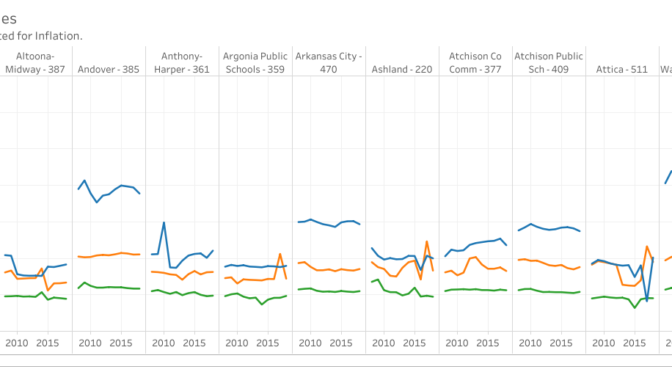
    In both the Wichita Public School System and the State of Kansas, the proportion of students testing at Level 1 rose. That’s bad. The proportion of students testing at Level 3 or better declined. That’s bad, too. 2

    The writer seems to think that public schools are teaching students to read and write. Despite a large influx of spending this year, test scores have fallen. A population of people can’t read and write is becoming larger.


    Kansas and Wichita school performance reports. Click for larger.


    Notes

    1. “Eligible students must meet the following criteria: (1) eligible for free lunch and attends a Title I Focus School or Title I Priority School; or (2) has previously received a scholarship under this program and has not graduated from high school or reached 21 years of age. 56(d)(1)(A)-(B) AND Eligible students are required to reside in Kansas while receiving a scholarship and be enrolled in a public school in the year prior to receiving the scholarship or be eligible to be enrolled in a public school, if under the age of six. 56(d)(2) and 56(d)(3)(A)-(B).” Kansas State Department of Education. Tax Credit for Low Income Students Scholarship Program Guidelines. Available at https://www.ksde.org/Portals/0/School%20Finance/Action%20Items/TCLISS%20Program–Guidelines.doc.
    2. “Kansas assessment results are now reported in four levels. Level 1 indicates that a student shows a limited ability to understand and use the English Language arts skills and knowledge needed for college and career readiness. Level 2 indicates that a student shows a basic ability to understand and use the English Language arts skills and knowledge needed for college and career readiness. Level 3 indicates that a student shows an effective ability to understand and use the English Language arts skills and knowledge needed for college and career readiness. Level 4 indicates that a student shows an excellent ability to understand and use the English Language arts skills and knowledge needed for college and career readiness.” Kansas State Department of Education, Kansas Report Card.
  • Kansas school salaries

    Kansas school salaries

    An interactive visualization of Kansas school salaries by district and category.

    This visualization holds salaries of Kansas school superintendents, principals, and teachers. The visualization shows the average for each of these categories for each school district. The values are adjusted for inflation to the most current year values. Some data is presented on a per-pupil basis using full-time equivalent student counts.

    The visualization includes both tables and charts. The source of the data is Kansas State Department of Education for salaries and enrollments, United States Bureau of Labor Statistics for price levels, and author’s calculations.

    Click here to access the visualization.

    Kansas school salaries. Click for larger.
    Kansas school salaries on a per-student basis. Click for larger.
    Example from the visualization. Click for larger.
  • Kansas school spending, through 2018

    Kansas school spending, through 2018

    Charts of Kansas school spending presented in different forms.

    Recently Kansas State Department of Education released spending figures for the 2018 school year, that is, the school year starting in 2017 and ending in 2018.

    One of the most important charts shows state spending per-pupil, adjusted for inflation. It shows the total of state and local spending, which is useful because in 2015 the state made a change in the way revenue is allocated between state and local sources. It also shows base state aid per pupil, which is an important number as it is the starting point for the school funding formula.

    Why is total state and local spending higher than base state aid? The answer is weightings. These are amounts that are added to the base to pay for things like at-risk children, English language learners, and other items. The value of weightings has grown over time, so as base state aid has generally fallen, total spending has generally risen.

    A second chart shows the ratio of total state and local spending to base state aid.

    This is not simply a technical matter. In discussions of school policy, sometimes only the base aid figure is used. As it has fallen, some formulate an argument that school spending has been cut. That is easily refuted by looking at total state and local spending.

    Of note, base state aid was not used in school years 2016 and 2017, which explains the gap in some of the series.

    I’ve gathered these charts and others and present them in a presentation. Use arrow keys to move through the charts. Click here to access.

    Kansas school spending, showing state and local aid compared to base state aid. Click for larger.
    Kansas school spending, showing ratio of state and local aid to base state aid. Click for larger.
  • Education gap on Wichita City Council

    Education gap on Wichita City Council

    Currently there is discussion in Wichita on whether higher education is valued by residents. Following, from April 2011, a look at the educational achievement of the Wichita City Council. The members of the council cited below were Lavonta Williams, Sue Schlapp, Jim Skelton, Paul Gray, Jeff Longwell, and Janet Miller. Carl Brewer was mayor.

    Before Jim Skelton left the council in January, none of the four men serving on the Wichita City Council had completed a college degree. The three women serving on the council set a better example, with all three holding college degrees.

    Of the candidates running in next week’s election for four council seats and the office of mayor, less than half hold college degrees.

    Is it necessary to complete college in order to serve in an office like mayor or city council? Apparently, none of the four men who held these offices without a degree thought so. The two running to retain their present positions — Mayor Carl Brewer and council member Jeff Longwell (district 5, west and northwest Wichita) — evidently don’t think so, or they would not be running again.

    But we tell young people that college holds the key to success. We encourage schoolchildren to consider college and to take a rigorous high school curriculum in order to prepare for it. We encourage families to save for college. Our region’s economic development agency promotes the number of people with college or advanced degrees. We promote our colleges and universities as a factor that distinguishes Wichita. We hope that our elected officials will set an example we want young people to follow.

    Once in office, we ask our city elected officials to attempt to grasp and understand complex sets of financial data, working with a budget of about half a billion dollars for the City of Wichita. We hope that they will be able to consider large and weighty issues such as the role of government in a free society. Members of the professional management staff — bureaucrats — that manage the city, county, and state are generally required to hold college degrees.

    The irony is that elected officials often are highly reliant on the bureaucratic staff for information, data, and advice, and this professional bureaucracy is often highly educated. Does this imbalance create problems?

    Elected officials compared to regular people

    Amazingly, it turns out that elected officials, as a group, are less knowledgeable about civics than the general population. That’s the finding of Intercollegiate Studies Institute, which surveyed Americans and their knowledge of civics in 2008. After analyzing the data, ISI concluded: “Simply put, the more you know about American government, history, and economics the less likely you are to pursue and win elective office.”

  • Wichita school spending, according to the Wichita Eagle

    Wichita school spending, according to the Wichita Eagle

    A recent editorial by the largest newspaper in Kansas misinforms its readers.

    “For too many years, the [Wichita public school] district was constrained by reduced state spending on public-school children. School systems across Kansas tightened belts to the point of being unable to breathe.” 1

    So says a recent editorial in the Wichita Eagle, the largest newspaper in Kansas. What does the data tell us?

    Click for larger.
    Data from the Kansas State Department of Education for the school year ending in 2017 (the most recent data available) show that state and local total spending, per pupil, adjusted for inflation, has been remarkably level since 2011. 2

    Wichita school revenue. Click for larger.
    The situation in each school district may vary, so the nearby chart shows data from the Wichita public school district comprehensive annual financial report along with my calculations. I took two data series (total revenue and the sum of state and local revenue) divided by FTE enrollment, and adjusted for inflation. I plot the sum of state and local revenue because in 2015 there was a change in the way some taxes were allocated, and using the sum of the two removes the effect of the change. 3

    As can be seen in the chart, the trend for both series is generally rising, with a few dips along the way.

    Is the Wichita Eagle editorial board aware of this data? We have to hope so. But that leaves the question as to why it claims the district is “constrained by reduced state spending.” Another excerpt from the editorial provides a clue: “State funding, amazingly, still isn’t to the levels of 10 years ago and reinforces the damage that the late 2000s recession and Brownback-era tax cuts of 2013 and 2014 had on public education. In 2008, base state funding for Wichita was $4,492 per student, or $327 more than this year. Multiplied by 50,000 students, that’s still a $16.4 million shortfall.”

    The numbers that the Eagle cites are base state aid per pupil. This number does not accurately characterize school spending in Kansas. Base state aid is an inaccurate indicator of total spending on schools by the state. It’s deceptive, in that after adjusting for inflation, base state aid has declined. But at the same time, total state aid to school districts has increased.

    For a newspaper to uncritically present base state aid as the only indicator of school spending is a big problem.

    Kansas school spending, showing base state aid and total state aid. See article for notes about 2015. Click for larger.
    Base state aid per pupil is an important number. 4 It’s the starting point for the Kansas school finance formula used before the 2015-2016 (fiscal 2016) school year. 5

    Base state aid, however, is not the only important number. To calculate the funding a school district receives, weightings are added. If students fall into certain categories, weightings for that category are added to determine a weighted enrollment. That is multiplied by base state aid to determine total state aid to the district. 6

    While this may seem like a technical discussion that doesn’t make a difference, it’s very important, because some of the weightings are large. The at-risk weighting, intended to cover the additional costs of teaching students from low-income families, started at five percent in 1993. In other words, for every student in this category, a school district received an extra five percent of base state aid. The value of this weighting has risen by a factor of nine, reaching 45.6 percent starting with the 2008-2009 school year.

    There’s also the high-density at-risk weighting. Starting with the 2006-2007 school year districts with a high concentration of at-risk students could receive an extra weighting of four percent or eight percent. Two years later the weightings were raised to six percent and ten percent. (This formula was revised again in 2012 in a way that may have slightly increased the weightings.)

    Kansas school spending, showing ratio of total state aid to base state aid. See article for notes about 2015. Click for larger.
    Kansas school spending. See article for notes about 2015. Click for larger.
    The weightings have a large effect on school funding. For example: During the 2004-2005 school year, base state aid was $3,863 and the at-risk weighting was ten percent. An at-risk student, therefore, generated $4,249 in state funding. (Other weightings might also apply.)

    Ten years later base state aid was $3,852 — almost exactly the same — and the at-risk weighting was up to 45.6 percent. This generates funding of $5,609. For a district that qualified for the maximum high-density at-risk weighting, an additional $404 in funding was generated. (These numbers are not adjusted for inflation.)

    So even though base state aid remained (almost) unchanged, funding targeted at certain students rose, and by a large amount.

    Over time, values for the various weightings grew until by 2014 they added 85 percent to base state aid. A nearby chart shows the growth of total state aid as compared to base state aid. (Starting in fiscal 2015 the state changed the way local tax dollars are counted. That accounts for the large rise for the last year of data in the chart. For school years 2016 and 2017, block grants replaced the funding formula, so base aid and weightings do not apply in the same way.)

    So yes, the Eagle editorial board is correct that base state aid per pupil is down. But total spending by the state is up.

    Opinions may vary on spending more or less on schools. But our state’s largest newspaper isn’t giving its readers the information they need to form an informed opinion.


    Notes

    1. Wichita Eagle Editorial Board. *A well-funded Wichita school district. A sight this city’s children deserve.” August 10, 2018. Available at https://www.kansas.com/opinion/editorials/article216418710.html.
    2. Weeks, Bob. Kansas school spending. Available at https://wichitaliberty.org/wichita-kansas-schools/kansas-school-spending-2017/.
    3. Weeks, Bob. Wichita school revenue. Available at https://wichitaliberty.org/wichita-kansas-schools/wichita-school-revenue-2017/.
    4. Weeks, Bob. Kansas school weightings and effects on state aid. In making the case for more Kansas school spending, the focus on base state aid per pupil leaves out important considerations. https://wichitaliberty.org/wichita-kansas-schools/kansas-school-weightings-and-effects-on-state-aid/.
    5. For the fiscal 2016 and 2017 school years, the formula was replaced by block grants.
    6. Amendments to the 1992 School District Finance and Quality Performance Act and the 1992 School District Capital Improvements State Aid Program (Finance Formula Components), Kansas Legislative Research Department, May 20, 2014
      http://ksde.org/Portals/0/School%20Finance/amends_to_sdfandqpa_2015.pdf
  • Kansas teachers union compliance instructions released

    Kansas teachers union compliance instructions released

    If you’re running for office in Kansas and want the support of the teachers union, here are questions you’ll need to answer their way.

    Kansas National Education Association (KNEA), our state’s teachers union has a questionnaire for candidates running for elective office. It’s really not a series of questions; instead it is a list of things the union wants. Candidates seeking union backing are expected to comply.

    Following are a sample of questions with some commentary. The full questionnaire may be viewed here.

    Question: “Do you support requiring that bonuses and/or incentive pay including any form of ‘merit pay’ be a mandatorily negotiable topic under the PNA given such plans would have the impact of reducing the earning potential of other teachers?”

    Teachers unions oppose merit pay because, they say, it may not be fair to some teachers. But opposing teacher merit pay based on fairness issues isn’t being fair to students. Instead, it’s cruel to students. If we retain the worst teachers and pay them the same as the best teachers, we aren’t being fair to students. But here we see the union’s interest is teachers, not students. 1

    Question: “Do you support high standards for entry into the profession of teaching including comprehensive training and licensure upon recommendation of an accredited degree-granting institution of higher education? Will you oppose legislation that would grant access as teacher of record to the classroom by persons without a license granted by the State Board of Education?”

    One of the main effects for occupational licensure is to reduce competition for people who already hold the license. This is also the main thrust of labor unions: fewer jobs, but with better pay and perks for those who have unionized jobs.

    Question: “Do you support the stabilization, maintenance, and improvement of the KPERS defined benefit pension system for all educators including paying back with interest all monies diverted from KPERS?”

    Defined-benefit pension plans like KPERS are incompatible with elected politicians, as they can’t resist delaying required funding until some future year, and a future generation of taxpayers. 2

    Question: “Do you support state funding for student support services in public schools including counseling and nursing services, social workers, and physical and occupational therapists?”

    Questions like this make it seem as though the state does not fund these functions.

    Question: “Do you support a safe and secure working environment in which educators can teach and children can learn without fear, including allowing local units of government to enact reasonable restrictions on the carrying of firearms?”

    There is not much evidence that local restrictions on firearms will do anything to increase school safety.

    Question: “Do you approve of and support the actions of the 2017 legislature that repealed the ‘march to zero’ income tax plan?”
    Question: “Do you approve of and support the actions of the 2017 legislature that repealed the LLC income tax loophole?”
    Question: “Do you approve of and support the actions of the 2017 legislature that restored the third income tax bracket?”
    Question: “Do you support the three-legged stool of income, sales, and property taxes as foundational to a balanced and fair tax system?”
    Question: “Do you support the establishment of an additional income tax bracket for high-income earners?”

    These five questions point to one of the most important priorities of teachers unions: More taxes and higher spending on schools.

    Question: “Please explain your position on the use of public monies to support students in private schools. Include tax credits, vouchers, and scholarships.”

    Any form of school choice is anathema to teachers unions. They want no competition. Plus, schools without labor unions reveal just how harmful the union is for children trapped in their schools.

    Question: “Do you support a school finance formula that addresses the needs of all student populations including bilingual students, at-risk students, students in poverty, and students with special needs (special education)?”

    This is another question that makes it seems as though there is no support for these needs. But the Kansas school finance formula provides extra funding for these.

    Question: “Do you oppose all efforts to divert funding from public schools through voucher or ‘scholarship’ plans, tuition tax credits, and the expansion of unaccountable charter schools?”

    Again, a question that exposes the union attitude towards school choice. By the way, charter schools are accountable in ways that public schools are not. For example, students can’t be forced to go to charter schools. Also: Until recently, Kansas schools rated themselves using standards that were among the weakest in the nation, but were telling Kansans that standards were high and schools were good. 3

    Question: “Do you support efforts to adopt an inflation measure appropriate to public education on which to base annual increases in funding?”

    For many years the school spending establishment has contended they face a “special” rate of inflation that is higher than other industries.


    Notes

    1. Weeks, Bob. Merit pay fairness is not about teachers. Available at https://wichitaliberty.org/wichita-kansas-schools/merit-pay-fairness-is-not-about-teachers/.
    2. Weeks, Bob. This is why we must eliminate defined-benefit public pensions. Available at https://wichitaliberty.org/kansas-government/we-must-eliminate-defined-benefit-public-pensions/
    3. Weeks, Bob. Kansas school standards remain high. Available at https://wichitaliberty.org/wichita-kansas-schools/kansas-school-standards-remain-high/.