Tag: Downtown Wichita revitalization
-
Should Wichitans care when ballpark development starts?
This article discusses the financial implications of the delayed development around Riverfront Stadium in Wichita.
-

Downtown Wichita Business Activity
Business activity in downtown Wichita continues to rise.
-
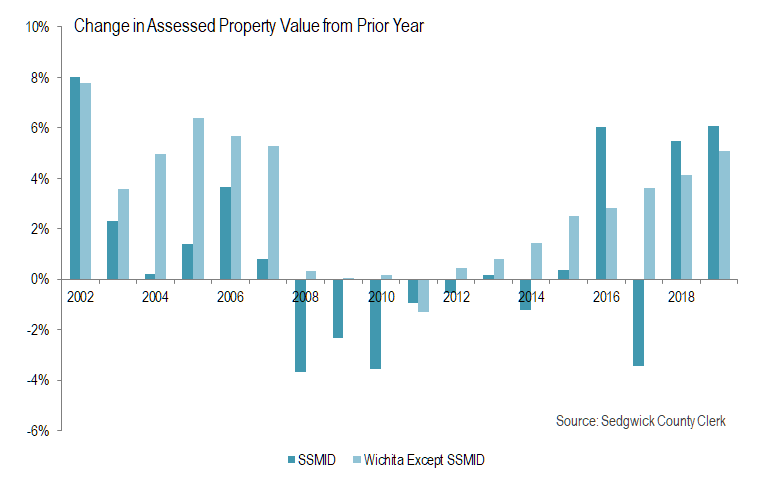
Downtown Wichita Tax Base
There’s been much investment in downtown Wichita. But it isn’t evident in the assessed value of property, although the recent trend is positive.
-

Naftzger Park event management agreement still ambiguous
This week the Wichita City Council will update an agreement from last year, but it appears important issues were not addressed.
-

Downtown Wichita jobs rise
The reported number of jobs in Downtown Wichita rose in 2018, but there is an issue with the data.
-

Downtown Wichita population is up
New Census Bureau data shows the population growing in downtown Wichita.
-

Downtown Wichita attraction attendance
Attendance at downtown Wichita attractions presented in an interactive visualization.
-

Intrust Bank Arena loss for 2019 nears $5 million
A truthful accounting of the finances of Intrust Bank Arena in downtown Wichita shows a large loss.
-

Rethinking the city and the community for a post-pandemic world
How has the pandemic affected cities in general and Wichita specifically, and what are implications for the future?
-

Naftzger Park on the web: Do we care?
A badly outdated portion of Wichita’s website makes me wonder: Does anyone care?
-
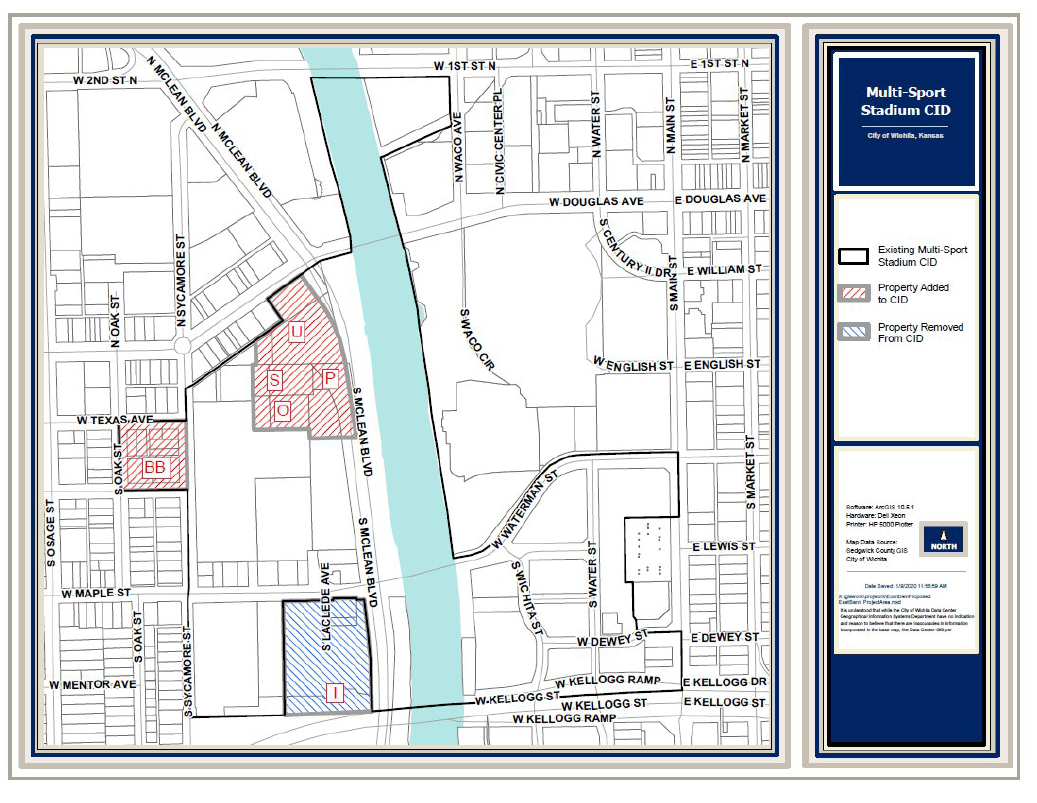
Wichita taxing district to expand
The City of Wichita plans to expand a special tax district.
-
Naftzger Park event management agreement ambiguous
The profit-sharing agreement for Naftzger Park event management contains ambiguity that could lead to disputes.