Wichita continues to decline in economic vitality, compared to other areas.
NewGeography.com is a joint venture of Joel Kotkin and Praxis Strategy Group. Its annual “Best Cities for Jobs” project ranks metropolitan areas according to growth in employment.
Of 422 metropolitan areas considered, Wichita ranked 383, dropping 28 spots since the previous year.
Among 100 medium size metropolitan areas, Wichita ranked 93, dropping 5 spots from the previous year.
NewGeography.com uses employment data from the United States Bureau of Labor Statistics from November 2006 to January 2018. 1 Last year’s publication contains a more detailed explanation of how the rankings capture current year-growth, mid-term growth, and momentum. 2
In the analysis for 2017, Wichita had also fallen in ranking.
Wichita has momentum, they say
Despite this news, Wichita leaders are in denial. Recently Greater Wichita Partnership president Jeff Fluhr told a group of young people this:
From the innovation campus at Wichita State University and development along the Arkansas River in downtown, including a new baseball stadium, to the conversations happening now about a new convention center and performing arts facility, Fluhr said the momentum is pushing to keep Wichita on par with the development of other communities around the country.
That development, which has in recent years expanded to incorporate the entire region, is a critical component to attracting and retaining talent — the exact kind of talent in the ICT Millennial Summit crowd. 3
In January Wichita Mayor Jeff Longwell said, “It’s hard to find a time when we’ve had more momentum.” 4
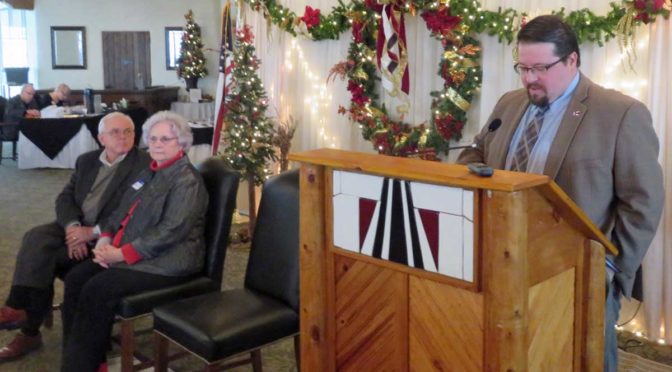
In March Sedgwick County Commissioner David Dennis penned a column for the Wichita Eagle praising the county’s efforts in economic development. 5 Dennis is also chair of the commission this year. In his column, the commissioner wrote: “Economic development is a key topic for the Board of County Commissioners and for me in particular. Right now we have a lot of momentum to make our community a more attractive place for people and businesses.”
At the same time, the Wichita Eagle editorialized: “Wichita’s economy struggled to rebound from the last recession, which held the city back. But there have been positive economic signs of late, including a renewed focus on innovation and regional cooperation. … There also is a sense of momentum about Wichita. Yes, challenges remain, but the city seems to have turned a corner, with even greater things ahead.”6
In announcing his candidacy for Sedgwick County Commission, Wichita city council member Wichita City Council Member Pete Meitzner (district 2, east Wichita) said, “We have enjoyed great progress and growth during my two terms as a City Council member and I plan to do my part to assure Sedgwick County is part of this continued success.” 7
Given all this, it ought to be easy to find economic data supporting momentum, progress, and growth. Besides the NewGeography.com report cited above, let’s look at some other indicators.
Personal income. For the Wichita metropolitan statistical area, personal income in 2016 rose slightly from the 2015 level, but is still below the 2014 level. In real (inflation-adjusted) dollars, personal income fell in 2016. 8

Population. In 2000 Wichita was the 80th largest metropolitan area. In 2017 its ranking had fallen to 89. See Wichita metropolitan area population in context for more on this topic.

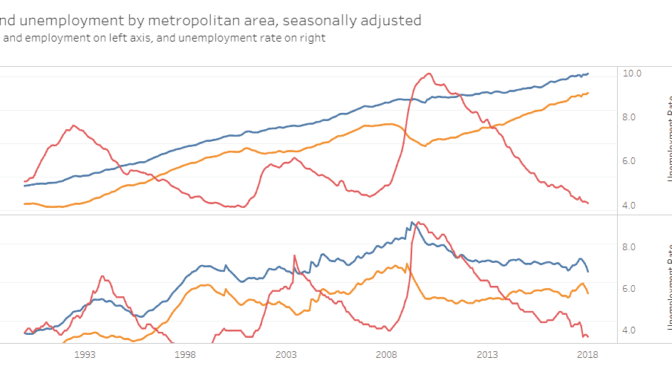
Employment. While officials promote the low Wichita-area unemployment rate, there is an alternative interpretation. First, the good news: The unemployment rate for the Wichita metro area declined to 3.9 percent in March 2018, down from 4.2 percent in March 2017. The number of unemployed persons declined by 8.3 percent for the same period. 10
Is Wichita’s declining unemployment rate good news, or a byproduct of something else? The unemployment rate is the ratio of the number of unemployed persons to the labor force. While the number of unemployed persons fell, so too did the labor force. It declined by 3,367 persons over the year, while the number of unemployed persons fell by 1,056. This produces a lower unemployment rate, but a shrinking labor force is not the sign of a healthy economy.

A further indication of the health of the Wichita-area economy is the number of nonfarm jobs. This number declined by 1,200 from March 2017 to March 2018, a decline of 0.4 percent. This follows a decline of 0.7 percent from February 2017 to February 2018.
Of the metropolitan areas in the United States, BLS reports that 308 had over-the-year increases in nonfarm payroll employment, 72 (including Wichita) had decreases, and 8 had no change.
Growth in output. The worst news, however, is that the Wichita-area economy shrank from 2015 to 2016. In real (inflation-adjusted) dollars, the Wichita metropolitan area gross domestic product fell by 1.4 percent. For all metropolitan areas, GDP grew by 1.7 percent. Since 2001, GDP for all metropolitan areas grew by 29.3 percent, while Wichita had 12.3 percent growth. 11

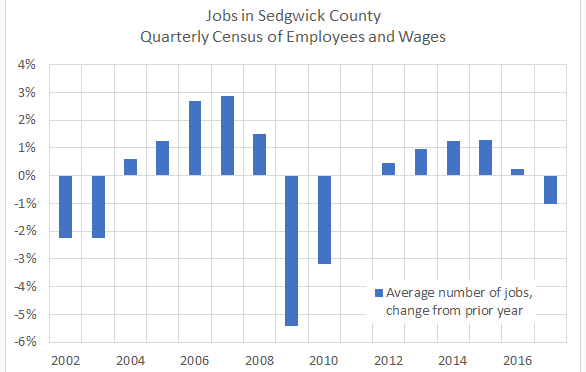
While GDP figures aren’t available, jobs numbers are. For the year 2016, total nonfarm employment in the Wichita metropolitan area grew by 0.62 percent. For 2017, the growth rate was 0.56 percent — a slowdown in the rate of job growth. These job growth figures are far below the rate for the nation, which were 1.79 and 1.58 percent respectively.

Furthermore, Wichita’s job growth rate in 2016 was lower than 2015’s rate of 1.07 percent. This is momentum in the wrong direction. Nearby charts illustrate. 12
What to do?
The failure of the Wichita-area economy to thrive is a tragedy. This is compounded by Wichita leaders failing to acknowledge this, at least publicly. While we expect people like the mayor, council members, and the chamber of commerce to be cheerleaders for our city, we must wonder: Do these people know the economic statistics, or do they choose to ignore or disbelieve them?
From private conversations with some of these leaders and others, I think it’s a mix of both. Some are simply uninformed, while others are deliberately distorting the truth about the Wichita economy for political or personal gain. The people who are uninformed or misinformed can be educated, but the liars are beyond rehabilitation and should be replaced.
—
Notes
- “The methodology for our 2018 ranking largely corresponds to that used in previous years. We seek to measure the robustness of metro areas’ growth both recently and over time, with some minor corrections to mitigate the volatility that the Great Recession has introduced into the earlier parts of the time series. The ranking is based on three-month rolling averages of the U.S. Bureau of Labor Statistics’ ‘state and area’ unadjusted employment data reported from November 2006 to January 2018.” 2018 How We Pick The Best Cities For Job Growth. Available at http://www.newgeography.com/content/005973-2018-how-we-pick-best-cities-job-growth. ↩
- 2017 How We Pick The Best Cities For Job Growth. Available at http://www.newgeography.com/content/005618-2017-how-we-pick-best-cities-job-growth. ↩
- Daniel McCoy. ICT Millennial Summit: Wichita is having a moment. Wichita Business Journal, November 30, 3017. Available at https://www.bizjournals.com/wichita/news/2017/11/30/ict-millennial-summit-wichita-is-having-a-moment.html. ↩
- Heck, Josh. Emerging Leaders panel offers insight into eco-devo strategies. Available at https://www.bizjournals.com/wichita/news/2018/01/11/emerging-leaders-panel-offers-insight-into-eco.html. ↩
- David Dennis. Sedgwick County part of drive to strengthen area workforce. Wichita Eagle, March 5, 2018. Available at http://www.kansas.com/opinion/opn-columns-blogs/article203559734.html. ↩
- Wichita is moving forward. March 1, 2018. Available at http://www.kansas.com/opinion/editorials/article135573253.html. ↩
- Bill Wilson. Wichita council member unveils bid for county commission. Wichita Business Journal, November 30, 3017. Available at https://www.bizjournals.com/wichita/news/2018/02/13/wichita-council-member-unveils-bid-for-county.html. ↩
- Weeks, Bob. Wichita personal income up, a little. Available at https://wichitaliberty.org/wichita-government/wichita-personal-income-up-2016/. ↩
- Weeks, Bob. Downtown Wichita business trends. Available at https://wichitaliberty.org/wichita-government/downtown-wichita-business-trends/. ↩
- Weeks, Bob. Wichita unemployment rate falls. Available at https://wichitaliberty.org/economics/wichita-unemployment-rate-falls-2018-03/. ↩
- Weeks, Bob. Wichita economy shrinks. Available at https://wichitaliberty.org/economics/wichita-economy-shrinks/. ↩
- In some presentations these figures may differ slightly due to data revisions and methods of aggregation. These differences are small and not material. ↩


 There are at least two ways of looking at the finance of the arena. Nearly all attention is given to the “profit” (or loss) earned by the arena for the county according to an operating agreement between the county and


 Many will undoubtedly cheer the Spirit announcement as an economic development win on a large scale. It will add many jobs. But the Wichita-area economy is so far behind it will take much more growth than this to catch up with the rest of the nation. In fact, the Wichita-area economy shrank last year.