As part of the Community Investments Plan process, citizens have told the City of Wichita they’re concerned about future water supply.
Through both the mailed survey and direct feedback obtained in citizen forums, creating a reliable source of water was the top priority, according to city documents released this week.
Those who have been paying attention might be surprised that there is a water crisis, and that citizens are concerned. That’s because when Bob Knight was mayor, he was told that Wichita had sufficient water for the next 50 years. That was about ten years ago.
City of Wichita Aquifer Storage and Recovery Program schematic diagram.
Reading the document, published just last spring, one might be led to believe that everything is fine, water-wise: “In 1993 the Wichita City Council adopted an Integrated Local Water Supply Plan that identified cost effective water resources that would be adequate to meet Wichita’s water supply needs through the year 2050.”
But this month the Wichita Eagle reported “Wichita’s $240 million aquifer storage and recovery program — promoted to taxpayers in the early 1990s as a way to supply the city with water for 50 years — could soon be relegated to serving as a bit player in the city’s long-term water future.”
Later in the same article, the newspaper reported “The ASR project has been plagued by problems, city officials said, including equipment failures and a significant drought that idled the project because of low water levels in the Little Arkansas River.”
Despite this investment on nearly one-quarter billion dollars, and despite the plan’s boasts, Wichitans have been threatened with huge fines for excessive water usage. The Wichita City Council forced citizens to spend up to $1 million so that other people may install low-water usage appliances, and city decorative fountains were dry for a time in an effort to save water. Fortunately, not all the potential rebates were claimed.
What went wrong? Where’s Wichita’s water?
Last summer there was severe drought for a time, and it was easy to attribute Wichita’s water problems to that lack of rain. But that’s not the message we’re getting now.
It appears that the plans the city made for a future water supply were not adequate, and the spending to implement the plan has been, largely, wasted.
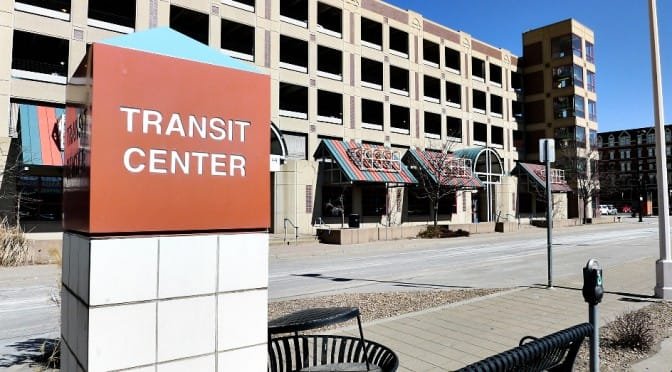
Located across the street from the Transit Center, the city-owned garage on William Street suffers from maintenance issues that diminish its value for its intended use: retail space.
Commercial retail space owned by the City of Wichita in a desirable downtown location was built to be rented. But most is vacant, and maintenance issues go unresolved.
At one time it was thought that the Wichita city-owned parking structure in the 400 block of East William Street would house retail shops along the street. But the present state of the property should cause us to be wary of government economic development efforts.
As reported by the Wichita Eagle twenty years ago on Wednesday, October 20, 1993:
The council also approved a plan to spend about $76 a square foot to construct roughly 6,000 square feet of retail space on the first floor of the parking garage. The space would lease for an estimated $8.70 a square foot.
Council member Sheldon Kamen questioned that part of the plan. ”I just can’t visualize spending $76 a square foot,” he said. “If I was a developer I wouldn’t spend $76 a square foot for retail space on William street.”
Council member Joan Cole disagreed with Kamen, calling $8.70 a “very good price” that would attract tenants. ”It is my feeling there are small operations that would find this kind of small space very attractive,” she said.
(Adjusted for inflation, these prices would be $122 and $14 today)
What has been the results of the city’s venture into commercial real estate? As can be seen in this video from September, a Wichita city government office occupied some of the space, but the office had moved to another location. Now, Wichita Festivals occupies some of the space, but much is still empty.
Rusted awnings near retail space in the city-owned garage on William Street in Wichita,
Inspecting the building last September, I found that this city-owned property had maintenance issues that might, in some circumstances, be considered as contributing to blight. As can be seen in the nearby photos taken this week (click them for larger versions), maintenance hasn’t improved in the nearly six months since then. Maybe that’s why there’s apparently little demand to rent this space.
At the city-owned garage on William Street in Wichita, a duct tape repair is still in use after six months.
It’s not as though the building has many of advantages that city planners tell us are needed for a vital downtown Wichita. There are hundreds of state employees parking in the garage each workday. It’s adjacent to the block with the Eaton Hotel and the Wichita Downtown Development Corporation, the agency charged with promoting downtown. This retail space is right across the street from the city’s bus transit center. It’s also one block away from the Intrust Bank Arena, which was promoted as a driver of commerce and activity for the surrounding area. Its Walk Score — a measure promoted by city planners — is 71, which is deemed “Very Walkable.”
Considering all the advantages this government-owned property has, it’s failing. It’s becoming blighted. The best thing the city could do is sell this property so that the benefits of markets and the profit-and-loss system can replace city bureaucrats.
Wichita/Sedgwick County Community Investment Plan logo.
This week the City of Wichita held a workshop where the Community Investments Plan Steering Committee delivered a progress report to the city council. The documents hold information that ought to make Wichitans think, and think hard. The amounts of money involved are large, and portions represent deferred maintenance. That is, the city has not been taking care of the assets that taxpayers have paid for.
The time frame of this planning process is the period 2013 to 2035. Under the heading “Trends & Challenges” we find some troubling information. Wichita Mayor Carl Brewer hinted at the problem last year in his State of the City Address when he said the city would need to spend $2.1 billion over 30 years on maintenance and replacement of water and sewer systems. The city’s performance measure report also told us that our pavement condition index has been deteriorating, and is projected to continue to decline.
So if we’ve been paying attention, it should not have been a surprise to read this in the presentation: “Decades of under-investment in infrastructure maintenance … 38% of Wichita’s infrastructure is in ‘deficient/fair’ condition.”
The cost to remedy this lack of maintenance is substantial. The document says that on an annual basis, Wichita needs to spend $180 million on infrastructure depreciation/replacement costs. Currently the city spends $78 million on this, the presentation indicates.
The “cost to bring existing deficient infrastructure up to standards” is given as an additional $45 to $55 million per year.
This is a lot of money. To place these numbers in context, here are some figures that help illustrate Wichita city finances:
Property tax collected in 2013: $105 million
Budgeted 2014 expenditures for fire department: $44 million
Budgeted 2014 expenditures for police department: $79 million
It’s thought that an additional one cent per dollar city sales tax would generate around $80 million per year.
The amounts by which the city is deficient in maintaining its assets is staggering, compared to other expenses the city has. The size of the deficiency overwhelms possible sources of new revenue. A one cent per dollar increase in sales tax would not cover the deficiencies in maintaining our current assets. Then, remember the things Wichita wants to increase spending on — a new library, economic development, expanded public transit, new convention center, economic development, and perhaps other things.
The report lists three scenarios for future growth: Maintaining current trends, constrained suburban growth, and suburban and infill growth mix. Whenever we see words like “constrained” we need to be cautious. We need to be on guard. The Wichita Eagle reported this: “In the city’s recently completed series of 102 public meetings, citizens were clear, City Manager Robert Layton said: Redevelop the core. We’ve had enough suburban growth for awhile.”
It’s unclear how closely the findings from the public meetings reflects actual citizen preference. Cynics believe that these meetings are run in a way that produces a predetermined outcome aligned with what city officials want to hear. At any rate, when you ask people about their preferences, but there is no corresponding commitment to act on their proclaimed preferences, we have to wonder how genuine and reliable the results are.
There is a very reliable way to find out what people really want, however. Just let them do it. If people want to live downtown on in an inner city neighborhood, fine. If they want suburban-style living, that’s fine too. Well, it should be fine. But reading between the lines of city documents you get the impression that city planners don’t think people should live in suburban-style settings.
Sometimes we don’t have to read between the lines. Sometimes the attitude of planners is explicit. In 2010 the city — actually the Wichita Downtown Development Corporation — employed Goody Clancy, a Boston-based planning firm, to help plan the revitalization of downtown Wichita. In the article Goody Clancy market findings presented to Wichita audience I reported on some of what the planners said. For example, David Dixon, the Goody Clancy principal for this project, told how that in the future, Wichitans will be able to “enjoy the kind of social and cultural richness” that is found only at the core. “Have dinner someplace, pass a cool shop, go to a great national music act at the arena, and then go to a bar, and if we’re lucky, stumble home.”
This idea that only downtown people are socially and culturally rich is an elitist attitude that we ought to reject. By the way, when I presented to the Wichita City Council on this topic, I noted that no council members, except for possibly one, lived in neighborhoods that might be described as in “the core.”
Other speakers from Goody Clancy revealed a condescending attitude towards those who hold values different from this group of planners. One presenter said “Outside of Manhattan and Chicago, the traditional family household generally looks for a single family detached house with yard, where they think their kids might play, and they never do.”
This, again, is an elitist attitude. No, it’s worse than that. It’s condescending. It reveals that the professional planning class thinks that the ordinary people of Wichita can’t decide for themselves what they really want. Somehow, people are duped into buying homes that don’t really meet their needs, and they’re not smart enough to realize that. That is the attitude of the professional planning class. It’s an elitism that Wichitans ought to reject.
The planning process
The planners tells us that the process is based on data. “Data-driven” is a term they use. But when we look under the covers at the data, we realize that we need to be very skeptical of claims.
Returning to the Goody Clancy plan for downtown Wichita, the principal planner used Walk Score in a presentation delivered in Wichita. Walk Score is purported to represent a measure of walkability of a location in a city. Walkability is a key design element of the master plan Goody Clancy has developed for downtown Wichita.
Walk Score is not a project of Goody Clancy, as far as I know, and Dixon is not responsible for the accuracy or reliability of the Walk Score website. But he presented it and relied on it as an example of the data-driven approach that Goody Clancy takes.
Walk Score data for downtown Wichita, as presented by planning firm Goody Clancy. Click image for a larger version.
The score for 525 E. Douglas, the block the Eaton Hotel and Wichita Downtown Development Corporation is located in and mentioned by Dixon as a walkable area, scored 91, which means it is a “walker’s paradise,” according to the Walk Score website.
But here’s where we can start to see just how bad the data used to develop these scores is. For a grocery store — an important component of walkability — the website indicates a grocery store just 0.19 miles away. It’s “Pepsi Bottling Group,” located on Broadway between Douglas and First Streets. Those familiar with the area know there is no grocery store there, only office buildings. The claim of a grocery store here is false.
There were other claimed amenities where the data is just as bad. But the chairman of the Wichita Downtown Development Corporation at that time said that Walk Score has been updated. I should no longer be concerned with the credibility of this data, he told me through a comment left on my website.
He was correct in one regard: Walk Score had been updated. For the same location the walk score was revised to 85%, which is considered “very walkable.” The “grocery store” is no longer the Pepsi Bottling Group. It’s now “Market Place,” whose address is given as 155 N. Market St # 220.
Someone strolling by that location would notice that address, 155 N. Market number 220, is the management office for an office building whose name is Market Place.
Still no grocery store. Nothing even resembling a grocery store.
I looked this week at the Walk Score website. It’s been updated and redesigned. Now for the same block in the heart of downtown Wichita the walk score is 74, which is “very walkable,” according to the site. In a narrative explanation, the site says this: “The closest grocery stores are Ray Sales Co, Market Place and The Hot Spot Detox Shop.”
Ray Sales Co., in the shadow of Intrust Bank Arena.
I don’t know if you’ve been to Ray Sales, but it’s a tiny store with a very limited product selection. It’s not the type of place that will attract people to downtown Wichita. We know that because officials say a grocery store is one of downtown’s most pressing needs, despite the existence of Ray Sales.
Market Place is listed again as evidence of a grocery store in downtown Wichita. Remember, Market Place is the name of an office building located on Market Street. It’s not a grocery store.
The third location listed as a grocery store is a shop that sells kits to help people pass drug tests. It’s nothing like a grocery store.
Again, David Dixon and Goody Clancy did not create the Walk Score data. But they presented it to Wichitans as an example of the data-driven, market-oriented approach to planning that they use. Dixon cited Walk Score data as the basis for higher real estate values based on the walkability of the area and its surrounding amenities. But anyone who relies on the evidence Dixon and Goody Clancy presented would surely get burnt unless they investigated the area on their own.
Keep in mind that the presentation of this Walk Score data was made after Goody Clancy staff had spent considerable time in Wichita. That someone there could not immediately recognize how utterly bogus the data is: That should give us cause for concern that the entire planning process is based on similarly shoddy data and analysis.
Constraining growth
Returning to the city’s presentation: How does the city “constrain” suburban growth? By taking away the freedom for people to live where they want. Why would the city want do that? City leaders say that suburban development is expensive. It’s not sustainable. Suburban living depends on the personal automobile. And remember the attitude of the professional planners Wichita Downtown Development Corporation hired: People can’t be trusted to know what they really want for themselves.
Special taxes paid on a residential home.
If it really is more expensive to develop new suburban areas, the city should simply charge what it costs. To some extent this already happens. Anyone who builds a new home in a new area will pay for the residential street and other infrastructure through special taxes. If the city feels it needs to charge for building arterial streets to serve new suburban areas, it should do so. But the city should realize that people spending their own money to buy or rent a residence — this is the best indication of their true preferences. What people say in focus groups or on paper survey forms is nowhere near as reliable.
Community input
The survey that Wichita used has its own problems. Here’s an example of a question respondents were asked to agree or disagree with: “Local government, the school district, community organizations and the business community should work together to create an investment climate that is attractive to business.”
The meaning of an attractive investment climate means different things to different people. Some people want an investment climate where property rights are respected, where government refrains from meddling in the economy and transferring one person’s property to another. An environment free from cronyism, in other words. But the Wichita way is, unfortunately, cronyism, where government takes an active role in managing economic development. We in Wichita never know when our local government will take from us to give to politically-favored cronies, or when city hall will set up and subsidize a competitor to your business.
Wichita flights compared to the nation.
Sometimes the questions are misleading. A question relating to the subsidy program at the Wichita airport read “I’m willing to pay increased taxes or fees to support investment … that uses public dollars to reduce the cost and increase the number of commercial flights at Mid-Continent Airport.”
On these and other issues, the Wichita Eagle quoted mayor Brewer: “We’ve put them off for too long. We didn’t want the challenges. We didn’t want the tax bills. But now, to maintain our quality of life, we’ve got to catch up.”
It’s almost as if the mayor is speaking as a bystander. But he’s been mayor for nearly seven years, and was on the city council before that time. During that time, he and other city leaders have boasted of not increasing property taxes. While the property tax rate has been stable, property tax revenue has increased due to development of new property and rising assessment values. In spite of this, the city has a huge backlog of deferred maintenance. The way to interpret this is that the city has really been engaging in deficit spending under Brewer’s leadership. We didn’t spend what was needed to maintain our assets, and now the mayor tells us we need to increase spending to make up for this.
The economist Milton Friedman told us that it’s more important to look at government spending rather than the level of taxation. That’s because spending must eventually be paid for, either through current taxes or future taxation. The federal government generate deficits and can pay for spending through creating inflation. Fortunately, cities and states can’t do that.
But, as we’ve seen, cities like Wichita can incur costs without paying for them. This is a form of deficit spending. By deferring maintenance of our infrastructure, the city has pushed spending to future years. The report released this week gives an idea of the magnitude of this deferred spending: It’s huge.
This form of deficit spending is “off the books” and doesn’t appear in city financial statements. But it’s real, as the mayor now admits. The threat to our freedom to live where we want is real, too. We must be watchful and diligent.
Jim Pinkerton, the journalist, Fox News contributor, and co-founder of the RATE (Reforming America’s Taxes Equitably) Coalition told an audience this: “The purpose of high taxes on the rich is not to get the rich to pay money, it’s to get the middle class to feel better about paying high taxes.”
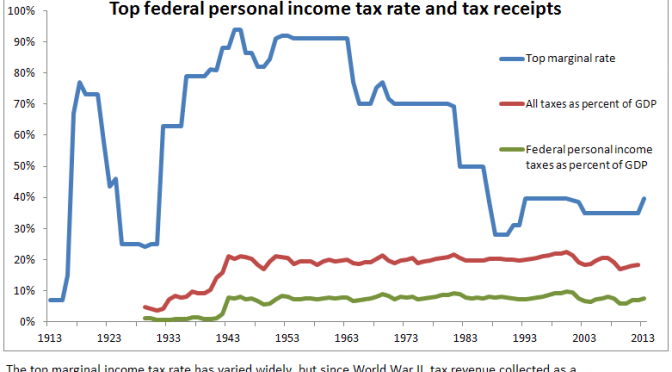
Pinkerton was speaking last week at a conference titled “The Tax & Regulatory Impact on Industry, Jobs & The Economy, and Consumers” produced by the Franklin Center for Government and Public Integrity. His remarks, as he told the conference attendees, were based on the work of economist F.A. Hayek. Others have also noted that changes to marginal tax rates often have little impact on the amount of taxes actually paid. The top marginal tax rate — that’s the rate that applies to high income earners on most of their income — was above 90 percent during most of the 1950s. From 2003 to 2012 it was 35 percent, and is now 39.6 percent.
The top marginal tax rate is the rate that applies to income. It’s not the same as what is actually paid. This fact is unknown or ignored by those who clamor for higher taxes on the rich. They often cite the rising prosperity of the 1950s as caused by the high marginal tax rate in effect at the time.
A common mistake is equating tax rates with the tax actually paid. For many taxpayers, there is a direct relationship. For those who earn a paycheck, there’s not much they can do to change the timing of their income, find tax shelters, or shift income to capital gains. When income tax rates rise, they have to pay more. But rich people can use these (and other) strategies to reduce the taxes they pay.
Click image for larger version.
In The purpose of high tax rates on the rich I showed that despite wide fluctuations in the top marginal tax rate, the tax revenue collected since World War II is remarkably constant, when measured as a percent of gross domestic product.
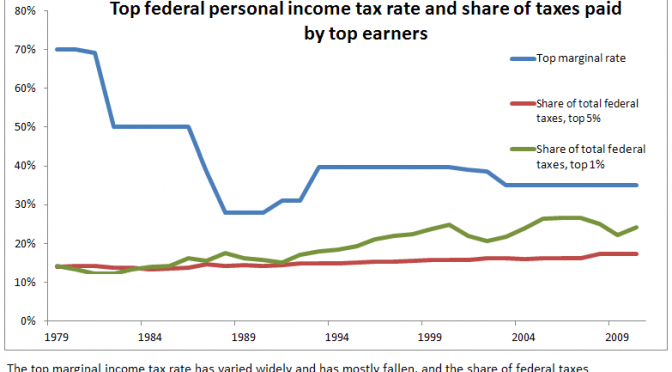
This is not the only way to consider the effect of tax rates. Using data from the Internal Revenue Service and Congressional Budget Office, I developed two charts. One shows the share of total federal taxes paid by top income earners, in this case the top five percent and the top one percent. For the range of years for which CBO provides data, the top marginal income tax rate has varied widely and has mostly fallen, and the share of federal taxes paid by top income earners has risen slightly.
Click image for larger version.
A second chart shows the average federal tax rate for these two groups of top earners. The average federal tax rates paid by top earners has varied much less than the variation in tax rates.
As Pinkerton told the Franklin Center conference attendees, high tax rates make the middle class feel better about paying their own taxes. They may take comfort in the fact that someone else is worse off — that rich people are paying higher tax rates. But as the data shows, it’s a misconception that high tax rates mean rich people actually pay taxes at correspondingly higher rates.
Stephen Moore. Credit: Willis Bretz/Heritage Foundation
The oil and gas boom in America boosts our competitiveness in the world economy while at the same time reducing carbon emissions, says economist Stephen Moore.
Moore recently left the Wall Street Journal to accept a position at Heritage Foundation as chief economist. He presented to an audience at a conference titled “The Tax & Regulatory Impact on Industry, Jobs & The Economy, and Consumers” produced by the Franklin Center for Government and Public Integrity.
A large portion of his presentation was on energy and its important role in the economy, and how radical environmentalists — the “green” movement — are harming our economy and people. An irony, he said, is that while President Barack Obama is in the “hip pocket” of radical environmentalists, he is presiding over the greatest oil and gas boom in American history. This boom is proceeding in spite of government, not because of it.
Moore emphasized the importance of energy costs to low-income people. Rising energy costs are like taxes on them, he said, while the wealthy can more easily absorb higher energy costs. “To be green is to be against capitalism, against progress, against poor people, against jobs.”
The boom in oil and gas production in America, made possible by horizontal drilling and fracking, is ahead of the rest of the world. While European countries have in the past embraced green energy technologies, these policies have failed, and the countries are retreating from them. Now, European countries want to use American drilling technologies, he said.
The lower electricity prices in America are a competitive advantage over Europe and China. German auto manufacturers are shutting plants in Europe and moving them to the United States, he said.
Of radical environmentalist groups. Moore said: “They don’t even care about global warming. If they really cared about global warming, they would be cheerleading fracking. Because fracking is making natural gas the new fuel for America. And guess what? Natural gas emits less carbon. It’s a great antidote to global warming.”
(According to the U.S. Energy information Administration, when generating electricity, coal emits from 2.08 to 2.18 pounds of carbon dioxide per kilowatt-hour electricity generated. Natural gas emits 1.22 pounds, or about 43 percent less carbon dioxide.)
Moore went on to tell the attendees that it is the United States that has reduced its carbon emissions the greatest amount in the last five years. He said this is remarkable in light of the fact that the U.S. didn’t sign the Kyoto Treaty, the U.S. didn’t implement cap-and-trade, and didn’t implement a carbon tax. “You would think these environmental groups would be applauding natural gas. Now these environmentalist groups have a new campaign called ‘beyond natural gas,’” he said.
Moore explained that at first, environmentalists said they could accept natural gas as a “bridge fuel” to solar power and wind. They were in favor of natural gas, he said, up until the time it became cheap and plentiful. Now, they are against gas. “My point is, the left and environmentalists are against any energy source that works.”
Over the past six years the U.S. has spent $100 billion promoting wind and solar power, but these two sources together account for just 2.2 percent of electricity generation. Even if the country were to quadruple the portion of electricity generated by these two renewable sources over the next 10 to 20 years, the nation would still need to get 90 percent of its electricity from other sources. Moore was doubtful that the country could quadruple the output from wind and solar.
Trends in carbon emissions
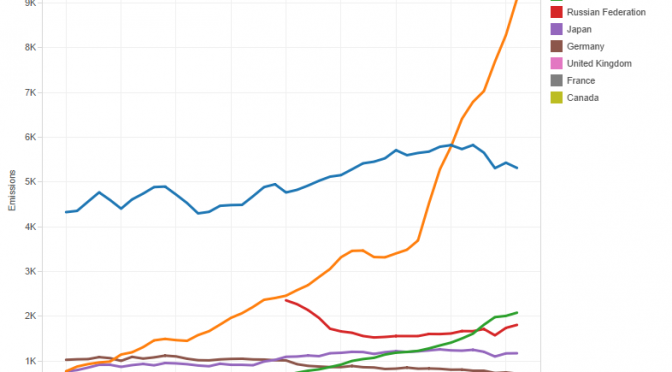
To further investigate the topics Moore raised, I gathered data from Global Carbon Atlas and prepared interactive visualizations using Tableau Public. You may access and use the visualizations by clicking here. Following are static excerpts from the visualizations. Click on each image for a larger version.
Click image for larger version.
Looking at the amount of total carbon emissions, we see two important facts. First, after rising slowly, carbon emissions by the United States have declined in recent years. Second, carbon emissions by China are soaring. China surpassed the U.S. around 2005, and the gap between the two countries is increasing.
Click image for larger version.
Note also that carbon emissions in India are rising. Emissions in most advanced economies are steady or falling. These trends are emphasized in the chart that shows carbon emissions for each country indexed from a common starting point. Emissions from China and India are rapidly rising, while emissions from countries with advanced economies have risen slowly or have declined.
Click image for larger version.
A chart that shows the carbon emissions efficiency of countries, that is, the carbon emitted per unit of GDP, shows that in general, countries are becoming more efficient. Advanced economies such as the U.S., Japan, and Germany have an advantage in this metric. These countries emit about one-fourth as much carbon per unit GDP as does China.
Click image for larger version.
The chart of carbon emissions per person in each country show that the United States leads in this measure. In 2011, the U.S. emitted about 17 tons of carbon dioxide per person. China was at 6.6, and India at 1.7. But, the trend in the U.S. is downward, that is, less carbon emitted per person. In China and India, the trend is up, and rising rapidly in China.
In this episode of WichitaLiberty.TV: There are efforts to have the Kansas Legislature expand the open records law to include the spending records of several taxpayer-funded agencies, but the City of Wichita wants to keep the records secret. Then, did you know the Kansas teachers union has a media response team? Finally, Arthur Brooks makes the moral case for free enterprise. Episode 32, broadcast February 23, 2014. View below, or click here to view at YouTube.
“The purpose of high taxes on the rich is not to get the rich to pay money, it’s to get the middle class to feel better about paying high taxes.”
This is what Jim Pinkerton, the journalist, Fox News contributor, and co-founder of the RATE (Reforming America’s Taxes Equitably) Coalition told an audience at a conference titled “The Tax & Regulatory Impact on Industry, Jobs & The Economy, and Consumers” produced by the Franklin Center for Government and Public Integrity.
Pinkerton was referring to the economist F.A. Hayek. Others have also noted that changes to marginal tax rates often have little impact on the amount of taxes actually paid. The top marginal tax rate — that’s the rate that applies to high income earners on most of their income — was above 90 percent during most of the 1950s. From 2003 to 2012 it was 35 percent, and is now 39.6 percent.
The top marginal tax rate is the rate that applies to income. It’s not the same as what is actually paid. This fact is unknown or ignored by those who clamor for higher taxes on the rich. They often cite the rising prosperity of the 1950s as caused by the high marginal tax rate in effect at the time.
The mistake the progressives make is equating tax rates with the tax actually paid. For many people, there is a direct relationship. For workers who earn a paycheck, there’s not much they can do to change the timing of their income, find tax shelters, or shift income to capital gains. When income tax rates rise, they have to pay more. But rich people can use these and other strategies to reduce the taxes they pay.
But as Pinkerton told the conference attendees, the high tax rates make the middle class feel better about paying their own taxes. They may take comfort in the fact that someone else is worse off, at least based on the misconception that high tax rates mean rich people actually pay correspondingly higher tax.
In 2010 W. Kurt Hauser explained in The Wall Street Journal: “Even amoebas learn by trial and error, but some economists and politicians do not. The Obama administration’s budget projections claim that raising taxes on the top 2% of taxpayers, those individuals earning more than $200,000 and couples earning $250,000 or more, will increase revenues to the U.S. Treasury. The empirical evidence suggests otherwise. None of the personal income tax or capital gains tax increases enacted in the post-World War II period has raised the projected tax revenues. Over the past six decades, tax revenues as a percentage of GDP have averaged just under 19% regardless of the top marginal personal income tax rate. The top marginal rate has been as high as 92% (1952-53) and as low as 28% (1988-90). This observation was first reported in an op-ed I wrote for this newspaper in March 1993. A wit later dubbed this ‘Hauser’s Law.’”
Incentives matter, economists tell us. People react to changes in tax law. As tax rates rise, people seek to reduce their taxable income. A common strategy is to make investments in economically unproductive tax shelters. There is less incentive to work, to save and build up capital stocks, and invest. These are some of the reasons why tax rate hikes usually don’t generate the promised revenue.
Click image for larger version
The subtitle to Hauser’s article is “Tax revenues as a share of GDP have averaged just under 19%, whether tax rates are cut or raised. Better to cut rates and get 19% of a larger pie.” The nearby chart illustrates. The top line, the top marginal tax rate in effect for year year, varies widely. The other two lines show total taxes and federal income taxes as a percent of gross domestic product. Since World War II, these lines are fairly constant, even as the top marginal tax rate varies.
Data is from Bureau of Economic Analysis (part of the U.S. Department of Commerce) along with my calculations.
This week the Wichita City Council will consider its legislative agenda. This document contains many items that are contrary to economic freedom, capitalism, limited government, and individual liberty. Yet, Wichitans pay taxes to have someone in Topeka promote this agenda. I’ve excerpted the document here, and following are some of the most problematic items.
Agenda: Existing economic development tools are essential for the continued growth and prosperity of our community.
First. The premise of this item is incorrect. We don’t have growth and prosperity in Wichita. Compared to a broad group of peer metropolitan areas, Wichita performs very poorly. See For Wichita’s economic development machinery, failure for details.
Second: In general, these incentives don’t work to increase prosperity. Click here for a summary of the peer-reviewed academic research that examines the local impact of targeted tax incentives from an empirical point of view. “Peer-reviewed” means these studies were stripped of identification of authorship and then subjected to critique by other economists, and were able to pass that review.
Third: Wichita leaders often complain that Wichita doesn’t have enough “tools in the toolbox” to compete effectively in economic development. The city’s document lists the tools the city wants the legislature to protect:
GWEDC/GO WICHITA: Support existing statutory records exemptions
Industrial Revenue Bond tax abatements (IRBX)
Economic Development Exemptions (EDX)
Tax Increment Financing (TIF)
Sales Tax Revenue (STAR) Bonds
Community Improvement Districts (CID)
Neighborhood Revitalization Area (NRA) tax rebates
Special Assessment financing for neighborhood infrastructure projects, facade improvements and abatement of asbestos and lead-based paint.
State Historic Preservation Tax Credits (HPTC)
State administration of federal Low Income Housing Tax Credits (LIHTC)
High Performance Incentive Program (HPIP) tax credits
Investments in Major Projects and Comprehensive Training (IMPACT) grants
Promoting Employment Across Kansas (PEAK) program
Economic Revitalization and Reinvestment Act bonding for major aviation and wind energy projects
Kansas Industrial Training (KIT) and Kansas Industrial Retraining (KIR) grants
Network Kansas tax credit funding
State support for Innovation Commercialization Centers in Commerce Department budget
Agenda: GWEDC/GO WICHITA: Support existing statutory records exemptions
This may refer to the city wanting to prevent these agencies from having to fulfill records requests under the Kansas Open Records Act. (If so, I wonder why the Wichita Downtown Development Corporation was left off.) City leaders say Wichita has an open and transparent government. But Kansas has a weak records law, and Wichita doesn’t want to follow the law, as weak as it is. This is an insult to citizens who are not able to access how their taxes are spent. For more on this issue, see Open Records in Kansas.
Agenda: The Wichita City Council opposes any legislative attempts to restrict the taxing and spending authority of local governments.
As Wichita city leaders prepare to ask for a higher sales tax rate in Wichita, we can hope that the legislature will save us from ourselves. At best, we can hope that the legislature requires that all tax rate increases be put to popular vote.
Agenda: The Wichita City Council opposes any restrictions on the use of state and/or local public monies to provide information to our citizens and to advocate on their behalf.
This is the taxpayer-funded lobbying issue. As you can see in this document, many of the things that Wichita city leaders believe people want, or believe that will be good for their constituents, are actually harmful. Additionally, many of the methods the city uses to engage citizens to determine their needs are faulty. See In Wichita, there’s no option for dissent for an example. Also, see Wichita survey questions based on false premises.
Agenda: The Wichita City Council supports the current framework for local elections, continuing the current February/April schedule of local primary and general elections, as well as the local option allowing non-partisan elections.
The present system of non-partisan elections held in the spring results in low voter turnout that lets special interest groups exercise greater influence than would be likely in fall elections. See my legislative testimony in Kansas spring elections should be moved.
Agenda: The Wichita City Council supports the development of appropriate state and local incentives to nurture and preserve arts activity throughout the City of Wichita and the State of Kansas.
Translation: The city knows better than you how to provide for your entertainment and cultural edification, and will continue to tax you for your own benefit.
Agenda: Public support and awareness of the possibility of passenger rail service connecting Oklahoma City and Wichita/Newton has grown over the past two years.
I’m not sure where the claim of public support and awareness growing comes from, but people are definitely not informed about the economics of passenger rail. In 2010, when the state rolled out several plans for this passenger rail service link, I reported as follows:
Expansion of rail service in Kansas is controversial, at least to some people, in that any form of rail service requires taxpayer involvement to pay for the service. First, taxpayer funding is required to pay for the start-up costs for the service. There are four alternatives being presented for rail service expansion in Kansas, and the start-up costs range from $156 million up to $479 million.
After this, taxpayer subsidies will be required every year to pay for the ongoing operational costs of providing passenger rail service. The four alternatives would require an annual operating subsidy ranging from $2.1 million up to $6.1 million. Taking the operating subsidy and dividing by the estimated number of passengers for each alternative, the per-passenger subsidy ranges from $35 up to $97 for every passenger who uses the service.
It would be one thing if tickets sales and other revenue sources such as sale of food and beverage paid for most of the cost of providing passenger rail service, and taxpayers were being asked to provide a little boost to get the service started and keep it running until it can sustain itself. But that’s not the case. Taxpayers are being asked to fully fund the start-up costs. Then, they’re expected to pay the majority of ongoing expenses, apparently forever.
For the Heartland Flyer route, which runs from Fort Worth to Oklahoma, and is proposed by taxpayer-funded rail supporters to extend into Kansas through Wichita and Kansas City, we find these statistics about the finances of this operation:
Amtrak reports a profit/loss per passenger mile on this route of $-.02, meaning that each passenger, per mile traveled, resulted in a loss of two cents. Taxpayers pay for that.
But this number, as bad as it is, is totally misleading. Subsidyscope calculated a different number. This number, unlike the numbers Amrak publishes, includes depreciation, ancillary businesses and overhead costs — the types of costs that private sector businesses bear and report. When these costs are included, the Heartland Flyer route results in a loss of 13 cents per passenger mile, or a loss of $26.76 per passenger for the trip from Fort Worth to Oklahoma City.
Asking the taxpayers of Wichita to pay subsidies each time someone boards an Amtrak train: This doesn’t sound like economic development, much less a program that people living in a free society should be forced to fund.
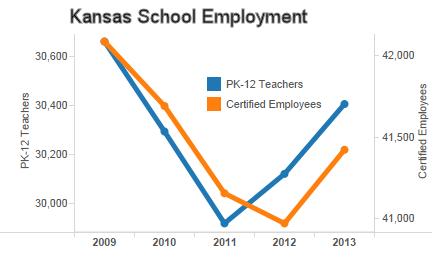
Claims made about Kansas schools don’t match the state’s statistics.
Responding to the State of the State Address delivered by Kansas Governor Sam Brownback, Kansas House of Representatives Minority Leader and gubernatorial candidate Paul Davis provided figures regarding Kansas public schools, telling Kansans: “On top of that, public school class sizes are growing, [and] teachers have been laid off by the thousands.”
Statistics from Kansas State Department of Education, however, show that school employment has rebounded, both in terms of absolute numbers of teachers and certified employees, and the ratios of pupils to these employees.
The story is not the same in every district. But considering the entire state, two trends emerge. For the past two years, the number of teachers employed in Kansas public schools has risen. Correspondingly, the pupil-teacher ratio has fallen. (This ratio is not the same statistic as average class size, but it’s the data we have. Plus, if schools are hiring teachers at a rate higher than the increase in students, we should expect class sizes to fall.)
The trend for certified employees is a year behind that of teachers, but for the last year, the number of certified employees has risen, and the ratio to pupils has fallen.
I’ve created interactive visualizations that let you examine the employment levels and ratios in Kansas school districts. Click here for the visualization of employment levels. Click here for the visualization of ratios (pupil-teacher and pupil-certified employee). Data is from Kansas State Department of Education. Visualization created by myself using Tableau Public.
It’s quite astonishing to see CAP cite evidence from Eric Hanushek of the Hoover Institution and Caroline Hoxby of Stanford and Hoover. These two researchers are usually condemned by the public education establishment and bureaucracy, including teachers unions. These are some of the key constituents CAP usually caters to.
In a nutshell, class size reduction produces very little benefit for students. It’s also very expensive, and there are other things we should be doing instead if we really want to increase student achievement.
The report summarizes the important studies in class size reduction. The upshot is that there is only one study showing positive results from class size reduction, and that effect was found only among the early grades. The effect decreased after a few years, even though small class sizes were still used.
The report also notes that class size reduction is very expensive to implement. Because it is, the report says we should look to other ways to increase student achievement, such as policies relating to teacher effectiveness: “The emerging consensus that teacher effectiveness is the single most important in-school determinant of student achievement suggests that teacher recruitment, retention, and compensation policies ought to rank high on the list.”
On teacher quality and teacher effectiveness: When Sandi Jacobs of National Council for Teacher Quality appeared in Kansas a few years ago, we learned that Kansas ranks below average on its policies that promote teacher quality.
In the example she illustrated, third graders who had teachers in the top 20 percent of effectiveness for the next three years went from the 50th percentile in performance to the 90th. For students with teachers in the lowest 20 percent for the same period, their performance dropped from the 50th percentile to the 37th percentile. More on this topic is at Kansas ranks low in policies on teacher quality.

 As part of the Community Investments Plan process, citizens have told the City of Wichita they’re concerned about future water supply.


 This week the