Tag: Featured

  • State employment visualizations

    State employment visualizations

    Kansas CapitolThere’s been dueling claims and controversy over employment figures in Kansas and our state’s performance relative to others. I present the actual data in interactive visualizations that you can use to make up your own mind.

    (Let’s keep in mind that jobs are not necessarily the best measure of economic growth and prosperity. Russell Roberts relates an anecdote: “The story goes that Milton Friedman was once taken to see a massive government project somewhere in Asia. Thousands of workers using shovels were building a canal. Friedman was puzzled. Why weren’t there any excavators or any mechanized earth-moving equipment? A government official explained that using shovels created more jobs. Friedman’s response: ‘Then why not use spoons instead of shovels?’”)

    It’s important to note there are two series of employment data provided by the U.S. Bureau of Labor Statistics, which is part of the U.S. Department of Labor. The two series don’t measure exactly the same thing. Nearby is an example of just how different the two series can appear.

    cps-ces-difference-example-2013-12

    A document from BLS titled Employment from the BLS household and payroll surveys: summary of recent trends explains in brief: “The Bureau of Labor Statistics (BLS) has two monthly surveys that measure employment levels and trends: the Current Population Survey (CPS), also known as the household survey, and the Current Employment Statistics (CES) survey, also known as the payroll or establishment survey. … These estimates differ because the surveys have distinct definitions of employment and distinct survey and estimation methods.”

    State employment based on Current Employment Statistics (CES) survey, also known as the payroll or establishment survey.
    State employment based on Current Employment Statistics (CES) survey, also known as the payroll or establishment survey.
    Another BLS document explains in detail the differences between the CPS and CES data. For example: CES: “Designed to measure employment, hours, and earnings with significant industrial and geographic detail” CPS: “Designed to measure employment and unemployment with significant demographic detail.”

    Another difference: CES: “Self-employed persons are excluded.” CPS: “Self-employed persons are included.” (See Understanding the employment measures from the CPS and CES survey.)

    State employment based on Current Population Survey (CPS), also known as the household survey.
    State employment based on Current Population Survey (CPS), also known as the household survey.
    I’ve gathered data from BLS and made it available in two interactive visualizations. One presents CPS data; the other holds CES data. You can compare states, select a range of dates, and choose seasonally-adjusted or not seasonally-adjusted data. I’ve create a set that allows you to easily choose Kansas and our nearby states, since that seems to be relevant to some people. (I included Texas in this set, as we often compare ourselves to that state.) The visualizations are indexed, meaning that each shows the percentage change in values from the first data shown.

    Using the visualization.
    Using the visualization.
    Here is the visualization for CES data, and here is visualization for CPS data.

  • Wichita City Council to consider entrenching power of special interest groups

    Wichita City Council to consider entrenching power of special interest groups

    city-council-chambers-sign-800On Tuesday the Wichita City Council will consider a resolution in support of the status quo for city elections. Which is to say, the council will likely express its support for special interest groups whose goals are in conflict with the wellbeing of the public.

    The proposed resolution expresses support for retaining the present system in which city council and school board members are elected in non-partisan elections held in the spring. Candidates for all other offices (county commissioner, district court judge, district attorney, county clerk, county treasurer, register of deeds, sheriff, state representative, state senator, governor, attorney general, secretary of state, state treasurer, insurance commissioner, state board of education member, president, U.S. senator, U.S. representative, etc.) compete in partisan elections held in August and November.

    Yes, the proposed resolution is full of language supporting lofty ideals. It mentions local control, concern over low voter turnout, the complexity of making changes, partisan politics, and even the Hatch Act, whatever that is.

    (The Hatch Act restricts the ability of federal executive branch employees and certain state and local government employees to participate in some political activities, such as running for office in partisan elections. Non-partisan elections — that’s okay. The city is concerned that this could “disqualify many local candidates and office holders.” As if anyone already working for government also should also be an officeholder, non-partisan election or not.)

    Why should we be concerned? Why would the city council support the current system of spring elections? Doesn’t the city council always act in the best interests of the body politic?

    Here’s the answer, quite simply: In the spring elections, voter turnout is low. This makes it easier for special interest groups to influence the election outcomes. These special interest groups are not your friends (unless you are a member of one of the special groups).

    Voter turnout is low in spring elections. Really low. I’ve gathered statistics for elections in Sedgwick County, and these numbers show that voter turnout in spring elections is much lower than in fall elections. (For these statistics I count the August primary as part of the fall election cycle.) Since 2000, turnout for fall elections, both primary and general, has been 44 percent. Over the same period, spring elections turnout has been 18 percent.

    Remarkably, a special Wichita citywide election in February 2012 with just one question on the ballot had voter turnout of 13.7 percent. One year earlier, in April 2011, the spring general election had four of six city council districts contested and a citywide mayoral election. Turnout was 12.8 percent. That’s less than the turnout for a single-question election on year later.

    The problem of low voter participation in off-cycle elections is not limited to Sedgwick County or Kansas. In her paper “Election Timing and the Electoral Influence of Interest Groups,” Sarah F. Anzia writes “A well developed literature has shown that the timing of elections matters a great deal for voter turnout. … When cities and school districts hold elections at times other than state and national elections, voter turnout is far lower than when those elections are held at the same time as presidential or gubernatorial elections.”

    In the same paper, Anzia explains that when voter participation is low, it opens the door for special interest groups to dominate the election: “When an election is separated from other elections that attract higher turnout, many eligible voters abstain, but interest group members that have a large stake in the election outcome turn out at high rates regardless of the increase in the cost of voting. Moreover, interest groups’ efforts to strategically mobilize supportive voters have a greater impact on election outcomes when overall turnout is low. Consequently, the electoral influence of interest groups is greater in off-cycle elections than in on-cycle elections. As a result, the policy made by officials elected in off-cycle elections should be more favorable to dominant interest groups than policy made by officials elected in on-cycle elections.” (Election Timing and the Electoral Influence of Interest Groups, Sarah F. Anzia, Stanford University, Journal of Politics, April 2011, Vol. 73 Issue 2, p 412-427, version online here.)

    Moving the spring elections so they are held in conjunction with the fall state and national elections will help reduce the electoral power and influence of special interest groups.

    An example of special interests influencing elections

    In January 2013 candidates for Wichita City Council filed campaign finance reports covering calendar year 2012. That year was the ramp-up period for elections that were held in February and March 2013. Two filings in particular illustrate the need for campaign finance and election reform in Wichita and Kansas.

    Two incumbents, both who had indicated their intent to run in the spring 2013 elections, received campaign contributions in 2012 from only two sources: A group of principals and executives of Key Construction, and another group associated with theater owner Bill Warren.

    The incumbent candidates receiving these contributions are Wichita City Council Member James Clendenin (district 3, southeast and south Wichita) and Wichita City Council Member Lavonta Williams (district 1, northeast Wichita).

    Except for $1.57 in unitemized contributions to Clendenin, these two groups accounted for all contributions received by these two incumbents during an entire year. Those associated with Key Construction gave a total of $7,000. Williams received $4,000, and $3,000 went to Clendenin. Those associated with Warren gave $5,000, all to Clendenin.

    You may be wondering: Do these two groups have an extraordinarily keen interest in Wichita city government that’s not shared by anyone else?

    Yes they do, and it’s not benevolent. Both have benefited from the cronyism of the Wichita City Council, in particular members Williams and Clendenin. Both groups are symptomatic of the problem of special interests influencing low-turnout elections. See Campaign contributions show need for reform in Wichita for details.

    [gview file=”http://wichitaliberty.org/wp-content/uploads/2014/03/Opposition-of-Legislation-regarding-Municipal-Elections.pdf”]

  • WichitaLiberty.TV: Wichita’s city tourism fee, Special taxes for special people

    WichitaLiberty.TV: Wichita’s city tourism fee, Special taxes for special people

    In this episode of WichitaLiberty.TV: The Wichita City Council will hold a meeting regarding an industry that wants to tax itself, but really is taxing its customers. Also, the city may be skirting the law in holding the meeting. Then: The Kansas Legislature is considering special tax treatment for a certain class of business firms. What is the harm in doing this? Episode 35, broadcast March 16, 2014. View below, or click here to view at YouTube.

  • Kansas school employment: Mainstream media notices

    Kansas school employment: Mainstream media notices

    Row of lockers in school hallwayWhen two liberal newspapers in Kansas notice and report the lies told by a Democratic candidate for governor, we know there’s a problem. (Okay, the Kansas City Star is really a Missouri newspaper, but covers Kansas too.)

    Peter Hancock wrote in the Lawrence Journal World: “Rep. Paul Davis, D-Lawrence, the presumptive Democratic nominee for governor, reportedly claimed again last week that school funding cuts under Gov. Sam Brownback’s administration have led to ‘thousands’ of teacher layoffs, a claim that has already been shown to be greatly exaggerated.” (Davis still exaggerating teacher layoff claims, March 12, 2013)

    On the same day Steve Kraske of the Star reported: “Kansas Democratic gubernatorial candidate Paul Davis appears to be exaggerating the number of teacher layoffs under Gov. Sam Brownback. In an Overland Park forum last week, Davis said said that the governor’s budget cuts to education had resulted in thousands of teacher layoffs. But an annual personnel report from the state Education Department showed that a total of only 201 teachers were the victims of a ‘reduction in force’ in the 2011 and 2012 school years.” (Davis exaggerates teacher layoff figures)

    None of this is news, at least to those who have been paying attention and are willing to dig into the Kansas State Department of Education for statistics. Well, the part about Paul Davis telling lies is news, as it is ongoing and contrary to the facts that Rep. Davis must surely know. (If he doesn’t know, what does that tell us?)

    Kansas school employment

    Last July I obtained, analyzed, and reported on Kansas school employment trends. I found that the situation is not the same in every school district. But considering the entire state, two trends emerge. For the past two years, the number of teachers employed in Kansas public schools has risen. Correspondingly, the pupil-teacher ratio has fallen.

    Kansas school employment ratios

    The trend for certified employees is a year behind that of teachers, but for the last year, the number of certified employees has risen, and the ratio of these employees to pupils has fallen.

    There’s also a video explaining these statistics. View it below, or click here to view in high definition at Youtube.

    Davis and others complain that class sizes in Kansas schools are rising. I understand that the ratio of teachers to pupils is not the same statistic as class size. They measure different things. But if Kansas schools, considered as a whole, have rising teacher and certified employment levels that leads to decreasing pupil to teacher ratio, and at the same time class sizes are increasing — we have to wonder about the management of schools.

    I’ve created interactive visualizations that let you examine the employment levels and ratios in Kansas school districts. Click here for the visualization of employment levels. Click here for the visualization of ratios (pupil-teacher and pupil-certified employee).

    Data is from Kansas State Department of Education. Visualization created by myself using Tableau Public.

  • Alternative measures of unemployment

    Alternative measures of unemployment

    visualization-example

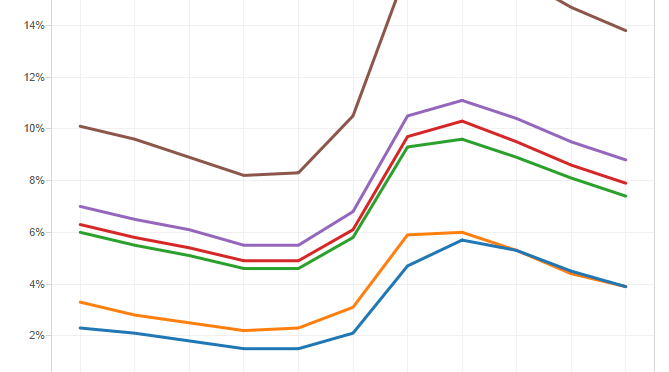
    Besides the official unemployment rate that is the topic of news each month, the Bureau of Labor Statistics (part of the U.S. Department of Labor) tracks and publishes five other series. These are called alternative measures of labor underutilization.

    BLS defines the six measures as follows, along with the seasonally adjusted value for February 2014:

    • U-1, persons unemployed 15 weeks or longer, as a percent of the civilian labor force, 3.5%
    • U-2, job losers and persons who completed temporary jobs, as a percent of the civilian labor force, 3.5%
    • U-3, total unemployed, as a percent of the civilian labor force (this is the definition used for the official unemployment rate), 6.7%
    • U-4, total unemployed plus discouraged workers, as a percent of the civilian labor force plus discouraged workers, 7.2%
    • U-5, total unemployed, plus discouraged workers, plus all other marginally attached workers, as a percent of the civilian labor force plus all marginally attached workers, 8.1%
    • U-6, total unemployed, plus all marginally attached workers, plus total employed part time for economic reasons, as a percent of the civilian labor force plus all marginally attached workers, 12.6%

    As the above definitions indicate, U-3 is the “official” or most often mentioned unemployment rate. Those who fit the profile of U-4, U-5, or U-6 are called “discouraged workers.” In particular, those in category U-6 are called “involuntary part-time workers.” The rate for this category, 12.6 percent, is 1.88 times the level of U-3, the official unemployment rate.

    Alternative measures of unemployment in the United States, from Bureau of Labor Statistics
    Alternative measures of unemployment in the United States, from Bureau of Labor Statistics
  • Zoltan Kesz on collectivism and racism in Hungary

    Zoltan Kesz on collectivism and racism in Hungary

    Cronyism and Collectivism in Central EuropeZoltan Kesz, founder of the Free Market Foundation in Hungary, speaks to a luncheon gathering at the Wichita, Kansas Pachyderm Club on February 21, 2014. For more about this topic, see In Hungary, the rise of nationalism and racism. View the video below, or click here to view at YouTube. Paul Soutar is the videographer.

  • Rally for school choice in Kansas

    Rally for school choice in Kansas

    Rally for school choice, Topeka, 2014-02-11A grassroots coalition of educators, advocates, parents, and Kansans came together to make the case for school choice in the Kansas State Capitol on 11 February 2014. This was the first capitol rally in Kansas’ history focused on school choice.

    Participants included
    – Andrea Hillebert of Mater Dei Catholic School in Topeka
    – Becky Elder of The Northfield School for the Liberal Arts in Wichita
    – James Franko of Kansas Policy Institute
    – Jeff Glendening of Americans for Prosperity
    – Cristina Fischer of the Kansas Education Freedom Movement
    – Chiquita Coggs, co-founder of Holman Academy in Kansas City, KS
    – Tammy Hope, Decoding Dyslexia-Kansas
    – Derrell Bradford, Better Education for Kids in New Jersey
    – Pastor Wade Moore, Christian Faith Centre in Wichita

    There is also a podcast holding audio from some of the speakers. View the video below, or click here to view at YouTube.

  • Special interests defend wind subsidies at taxpayer cost

    Special interests defend wind subsidies at taxpayer cost

    man-digging-coinsThe spurious arguments made in support of the wind production tax credit shows just how difficult it is to replace cronyism with economic freedom. From October, 2012.

    We often see criticism of politicians for sensing “which way the wind blows,” that is, shifting their policies to pander to the prevailing interests of important special interest groups. The associated negative connotation is that politicians do this without regard to whether these policies are wise and beneficial for everyone.

    So when a Member of Congress takes a position that is literally going against the wind in the home district and state, we ought to take notice. Someone has some strong convictions.

    This is the case with U.S. Representative Mike Pompeo, a Republican representing the Kansas fourth district (Wichita metropolitan area and surrounding counties.)

    The issue is the production tax credit (PTC) paid to wind power companies. For each kilowatt-hour of electricity produced, the United States government pays 2.2 cents. Wind power advocates contend the PTC is necessary for wind to compete with other forms of electricity generation. Without the PTC, it is said that no new wind farms would be built.

    Kansas wind turbinesThe PTC is an important issue in Kansas not only because of the many wind farms located there, but also because of wind power equipment manufacturers that have located in Kansas. An example is Siemens. That company, lured by millions in local incentives, built a plant in Hutchinson. Employment was around 400. But now the PTC is set to expire on December 31, and it’s uncertain whether Congress will extend the program. As a result, Siemens has laid off employees. Soon only 152 will be at work in Hutchinson, and similar reductions in employment have happened at other Siemens wind power equipment plants.

    Rep. Pompeo is opposed to all tax credits for energy production, and has authored legislation to eliminate them. As the wind PTC is the largest energy tax credit program, Pompeo and others have written extensively of the market distortions and resultant economic harm caused by the PTC. A recent example is Puff, the Magic Drag on the Economy: Time to let the pernicious production tax credit for wind power blow away, which appeared in the Wall Street Journal.

    The special interests that benefit from the PTC are striking back. An example comes from Dave Kerr, who as former president of the Hutchinson/Reno County Chamber of Commerce played a role in luring Siemens to Hutchinson. Kerr’s recent op-ed in the Hutchinson News is notable not only for its several attempts to deflect attention away from the true nature of the PTC, but for its personal attacks on Pompeo.

    There’s no doubt that the Hutchinson economy was dealt a setback with the announcement of layoffs at the Siemens plant that manufactures wind power equipment. Considered in a vacuum, these jobs were good for Hutchinson. But we shouldn’t make our nation’s policy in a vacuum, that is, bowing to the needs of special interest groups — sensing “which way the wind blows.” When considering everything and everyone, the PTC paid to producers of power generated from wind is a bad policy. We ought to respect Pompeo for taking a principled stand on this issue, instead of pandering to the folks back home.

    Kerr is right about one claim made in his op-ed: The PTC for wind power is not quite like the Solyndra debacle. Solyndra received a loan from the Federal Financing Bank, part of the Treasury Department. Had Solyndra been successful as a company, it would likely have paid back the government loan. This is not to say that these loans are a good thing, but there was the possibility that the money would have been repaid.

    But with the PTC, taxpayers spend with nothing to show in return except for expensive electricity. And spend taxpayers do.

    Kerr, in an attempt to distinguish the PTC from wasteful government spending programs, writes the PTC is “actually an income tax credit.” The use of the adverb “actually” is supposed to alert readers that they’re about to be told the truth. But truth is not forthcoming from Kerr — there’s no difference. Tax credits are government spending. They have the same economic effect as “regular” government spending. To the company that receives them, they can be used — just like cash — to pay their tax bill. Or, the company can sell them to others for cash, although usually at a discounted value.

    From government’s perspective, tax credits reduce revenue by the amount of credits issued. Instead of receiving tax payments in cash, government receives payments in the form of tax credits — which are slips of paper it created at no cost and which have no value to government. Created, by the way, outside the usual appropriations process. That’s the beauty of tax credits for big-government spenders: Once the program is created, money is spent without the burden of passing legislation.

    If we needed any more evidence that PTC payments are just like cash grants: As part of Obama’s ARRA stimulus bill, for tax years 2009 and 2010, there was in effect a temporary option to take the federal PTC as a cash grant. The paper PTC, ITC, or Cash Grant? An Analysis of the Choice Facing Renewable Power Projects in the United States explains.

    Astonishingly, the wind PTC is so valuable that wind power companies actually pay customers to take their electricity. It’s called “negative pricing,” as explained in Negative Electricity Prices and the Production Tax Credit:

    As a matter of both economics and public policy, no government production tax subsidy should ever be so large that it creates an incentive for a business to actually pay customers to take its product. Yet, the federal Production Tax Credit (“PTC”) for wind generation is doing just that with increasing frequency in electricity markets across the United States. In some “wind-rich” regions of the country, wind producers are paying grid operators to take their generation during periods of surplus supply. But wind producers more than make up the cost of the “negative price” payment, because they receive a $22/MWH federal production tax credit for every MWH generated.

    In western Texas since 2008, wind power generators paid the electrical grid to take their electricity ten percent of the hours of each day.

    Once we recognize that tax credits are the same as government spending, we can see the error in Kerr’s argument that if the PTC is ended, it is the same as “a tax increase on utilities, which, because they are regulated, will pass on to consumers.” Well, government passes along the cost of the PTC to taxpayers, illustrating that there really is no free lunch.

    Kerr attacks Pompeo for failing to “crusade” against two subsidies that some oil companies receive: Intangible Drilling Costs and the Percentage Depletion Allowance. These programs are deductions, not credits. They do provide an economic benefit to the oil companies that can use them (“big oil” can’t use percentage depletion at all), but not to the extent that tax credits do.

    Regarding these deductions, last year Pompeo introduced H. Res 267, titled “Expressing the sense of the House of Representatives that the United States should end all subsidies aimed at specific energy technologies or fuels.”

    In the resolution, Pompeo recognized the difference between deductions and credits, the latter, as we’ve seen, being direct subsidies: “Whereas deductions and cost-recovery mechanisms available to all energy sectors are different than credits, loans and grants, and are therefore not taxpayer subsidies; [and] Whereas a deduction of costs and cost recovery with respect to timing is not a subsidy.”

    Part of what the resolution calls for is to “begin tax simplification and reform by eliminating energy tax credits and deductions and reducing income tax rates.”

    Kerr wants to deflect attention away from the cost and harm of the PTC. Haranguing Pompeo for failing to attack percentage depletion and IDC with the same fervor as tax credits is only an attempt to muddy the waters so we can’t see what’s happening right in front of us. It’s not, as Kerr alleges, “playing Clintonesque games of semantics with us.” As we’ve seen, Pompeo has called for the end of these two tax deductions.

    If we want to criticize anyone for inconsistency, try this: Kerr criticizes Pompeo for ignoring the oil and gas deductions, “which creates a glut in natural gas that drives down the price to the lowest levels in a decade.” These low energy prices should be a blessing to our economy. Kerr, however, demands taxpayers pay to subsidize expensive wind power so that it can compete with inexpensive gas. In the end, the benefit of inexpensive gas is canceled. Who benefits from that, except for the wind power industry? The oil and gas targeted deductions also create market distortions, and therefore should be eliminated. But at least they work to reduce prices, not increase them.

    By the way, Pompeo has been busy with legislation targeted at ending other harmful subsidies: H.R. 3090: EDA Elimination Act of 2011, H.R. 3994: Grant Return for Deficit Reduction Act, H.R. 3308: Energy Freedom and Economic Prosperity Act, and the above-mentioned resolution.

    I did notice, however, that Pompeo hasn’t called for the end to the mohair subsidy. Will Kerr attack him for this oversight?

    Finally, Kerr invokes the usual argument of government spenders: Cut the budget somewhere else. That’s what everyone says.

    Creating entire industries that exist only by being propped up by government subsidy means that we all pay more to support special interest groups. A prosperous future is best built by relying on free enterprise and free markets in energy, not on programs motivated by the wants of politicians and special interests. Kerr’s attacks on Pompeo illustrate how difficult it is to replace cronyism with economic freedom.

  • Energy subsidies for electricity production

    Energy subsidies for electricity production

    Kansas wind turbinesWhen comparing federal subsidies for the production of electricity, it’s important to look at the subsidy values in proportion to the amount of electricity generated. That’s because the scales vary widely. For example, in 2010 for the United States, as can be seen in the accompanying table, coal accounted for the production of 1,851 billion kWh (or megawatt hours) of electricity production. That’s 44.9 percent of all electricity produced. Solar power accounted for the production of 1,851 billion kWh, which is 0.025 percent of all electrical production.

    Solar power, however, received 8.2 percent of all federal subsidies, or about 328 times its share of production.

    Click table for larger version.
    Click table for larger version.

    The nearby table and chart are based on data from the Energy Information Administration (EIA), Direct Federal Financial Interventions and Subsidies in Energy in Fiscal Year 2010 through the Congressional Research Service, along with the author’s calculations.

    Of particular interest is wind power, as it receives subsidy in the form of cash equivalent tax credits, and many states (including Kansas) have mandates forcing its use. For the year covered in the table, wind accounted for 2.3 percent of U.S. electricity generation. It received 42.0 percent of federal energy subsidies.

    Electricity production and subsidy, 2010