Tag: Wichita Downtown Development Corporation
-

More Wichita planning on tap
We should be wary of government planning in general. But when those who have been managing and planning the foundering Wichita-area economy want to step up their management of resources, we risk compounding our problems.
-

Wichita considers a new stadium
The City of Wichita plans subsidized development of a sports facility as an economic driver. Originally published in July 2017.
-

In Wichita, respecting the people’s right to know
The City of Wichita says it values open and transparent government. But the city’s record in providing information and records to citizens is poor, and there hasn’t been much improvement.
-

Business improvement district proposed in Wichita
The Douglas Design District proposes to transform from a voluntary business organization to a tax-funded branch of government (but doesn’t say so).
-

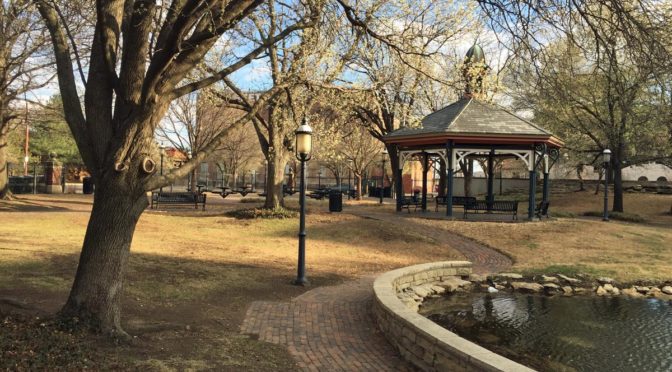
Downtown Wichita business trends
There has been much public and private investment in Downtown Wichita. What has been the trend in business activity during this time?
-

Wichita in ‘Best Cities for Jobs 2018’
Wichita continues to decline in economic vitality, compared to other areas.
-

Project Wichita right to look ahead at city’s future
We can understand self-serving politicians and bureaucrats. It’s what they do. But a city’s newspaper editorial board ought to be concerned with the truth.
-
Naftzger Park private use plans unsettled
An important detail regarding Naftzger Park in downtown Wichita is unsettled, and Wichitans have reason to be wary.
-

Living in downtown Wichita
Wichita economic development officials use a circuitous method of estimating the population of downtown Wichita, producing a number much higher than Census Bureau estimates.
-
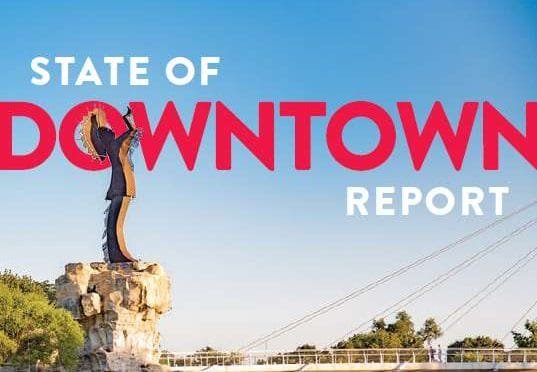
Downtown Wichita report omits formerly prominent data
The new State of Downtown Wichita report for 2017 is missing something. What is it, and why is it missing?
-
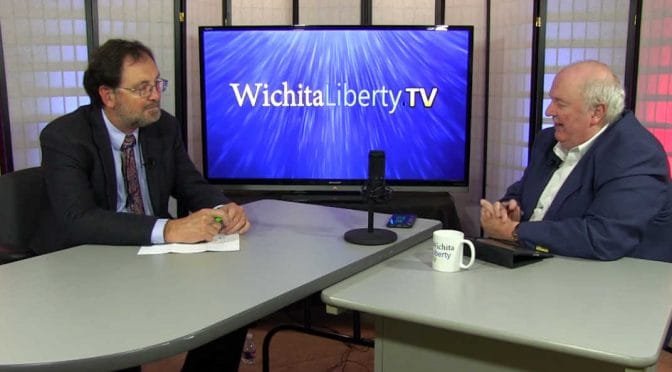
WichitaLiberty:TV: Wichita economy, Kansas schools
Karl Peterjohn and Bob Weeks discuss some statistics regarding downtown Wichita and then the Kansas school finance court decision.
-
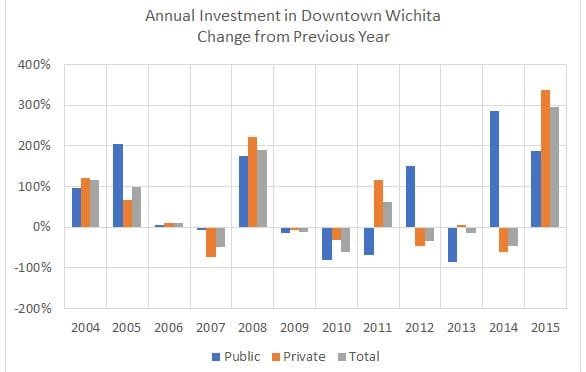
Investment in Downtown Wichita
Charts and tables of investment in Downtown Wichita.