Tag: Wichita and Kansas schools

  • Kansas and Iowa schools

    Kansas and Iowa schools

    Should Kansas schools aspire to be more like Iowa schools?

    The Kansas Association of School Boards lists Iowa as an “aspirational” state, that is, one that Kansas should consider a role model.

    I’ve gathered some data from both states. The United States Census Bureau collects data from the states as part of its Annual Survey of School System Finances program. 1 Data is available through fiscal year 2015. The National Education Association also gathers data. 2 The following table displays some data from both sources.

    Note that Iowa spends much more than Kansas. Iowa school teacher salaries are higher, although the student-teacher ratio is nearly the same. (Student-teacher ratio is not the same as average class size, but it’s the data that is collected and reported.)

    Since Iowa spends more on schools than Kansas on a per-student basis, we might be concerned that Kansas students are not doing as well as Iowa students. The National Assessment of Educational Progress (NAEP) is the best way to compare students in different states. 3 The following table shows NAEP data for Kansas and Iowa for 2015, the most recent year for data.

    Click for larger.

    Considering all students, Iowa has a larger percentage of students testing at “proficient” or better in all four subject/grade combinations.

    Looking at subgroups, however, is important, because states vary in the composition of their student bodies. When we look at subgroups, we find that Kansas usually outperforms Iowa for black and Hispanic students. Even for white students alone, Kansas and Iowa tie twice and split the other two subject/grade combinations.

    So let’s ask a few questions: Why is Iowa considered an aspirational state for Kansas? Is it because Iowa students perform better, or because Iowa spends more?


    Notes

    1. U.S. Census Bureau. Annual Survey of School System Finances. Available at https://www.census.gov/programs-surveys/school-finances.html.
    2. National Education Association. Rankings of States and Estimates of School Statistics. Available at http://www.nea.org/home/44479.htm.
    3. National Center for Education Statistics. National Assessment of Educational Progress (NAEP). Available at https://nces.ed.gov/nationsreportcard/.
  • Colorado and Kansas schools

    Colorado and Kansas schools

    A writer claims that Colorado schools are well-funded, while Kansas schools are not.

    From the Wichita Eagle Opinion Line:

    The economy of our neighbor, Colorado, is growing fast. New residents cite that state’s well-funded schools as a key reason. Meanwhile in Kansas, Susan Wagle says our public schools don’t deserve an extra nickel of help from legislators.” 1

    First, thinking like this ignores and disrespects the sacrifice Kansans make to fund our schools. This is a problem with government funding. The recipients rarely say “thank you” to those who provide the funding — they just get mad and agitate for more.

    Second, I believe the writer is arguing that Colorado spends more on schools than Kansas. If so, the writer is incorrect.

    The United States Census Bureau collects data from the states as part of its Annual Survey of School System Finances program. 2 Data is available through fiscal year 2015. The National Education Association also gathers data. 3 The following table displays some data from both sources.

    Since Colorado spends less on schools than Kansas on a per-student basis, we might be concerned that Colorado students are not doing as well as Kansas students. The National Assessment of Educational Progress (NAEP) is the best way to compare students in different states. 4 The following table shows NAEP data for Kansas and Colorado for 2015, the most recent year for data. In almost every case, Colorado students perform better.

    Click for larger.


    Notes

    1. Wichita Eagle, Opinion Line, March 29, 2018.
    2. U.S. Census Bureau. Annual Survey of School System Finances. Available at https://www.census.gov/programs-surveys/school-finances.html.
    3. National Education Association. Rankings of States and Estimates of School Statistics. Available at http://www.nea.org/home/44479.htm.
    4. National Center for Education Statistics. National Assessment of Educational Progress (NAEP). Available at https://nces.ed.gov/nationsreportcard/.
  • WichitaLiberty.TV: Kansas State of the State for 2018

    WichitaLiberty.TV: Kansas State of the State for 2018

    In this episode of WichitaLiberty.TV: Vice president and policy director of Kansas Policy Institute James Franko joins Karl Peterjohn to discuss Governor Brownback’s State of the State Address for 2018. Topics include schools and Medicaid expansion. Bob Weeks hopes to be back next week. View below, or click here to view at YouTube. Episode 179, broadcast January 13, 2018.

    Shownotes

  • From Pachyderm: Local legislative priorities

    From Pachyderm: Local legislative priorities

    From the Wichita Pachyderm Club: Local government officials present their legislative priorities. Appearing are James Clendenin for the City of Wichita, Dave Unruh for Sedgwick County, and Sheril Logan for the Wichita Public School District. This was recorded December 22, 2017.

  • Wichita school student/teacher ratios

    Wichita school student/teacher ratios

    During years of purported budget cuts, what has been the trend of student/teacher ratios in the Wichita public school district?

    When discussing school funding, there is controversy over how spending should be measured. What funds are included? Is KPERS included? Should we adjust for enrollment and inflation? What about bond and interest funds and capital outlay?

    The largest expenditures of schools — some 80 percent nationwide — is personnel costs. In Kansas, and Wichita in particular, we’re told that budget cuts are causing school class sizes to increase.

    When we look at numbers, we see that the USD 259, the Wichita public school district has been able to reduce its student/teacher ratios over the last ten years. (Student/teacher ratio is not the same statistic as class size.) There have been a few ups and downs along the way, but for all three levels of schools, student/teacher ratios are lower than they were ten years ago. (For middle schools, the trend over the past nine years is rising, although the ratio is lower than elementary and high schools.)

    So however spending is categorized in funds, whether KPERS contributions are included or not, whether the funding comes from state or local sources, whether or not spending is adjusted for inflation, the Wichita school district has been able to improve its student/teacher ratios over the past ten years.

    Data is from USD 259 Comprehensive Annual Financial Report for various years.

  • Wichita school revenue

    Wichita school revenue

    Revenue for the Wichita public school district continues its familiar trend.

    Wichita school revenue. Click for larger.
    Now that USD 259, the Wichita public school district, has finally published its Comprehensive Annual Financial Report for the year ending June 30, 2017, we can start to look at some figures.

    The nearby chart shows data from the CAFR along with my calculations. I took two data series, total revenue and the sum of state and local revenue, divided by FTE enrollment, and adjusted for inflation. I plot the sum of state and local revenue because in 2015 there was a change in the way some taxes were allocated. Plotting the sum of the two removes the effect of the change.

    As can be seen in the chart, the trend for both series is generally rising, with a few dips along the way.

  • Briefs

    Briefs

    He didn’t participate

    Wichita Eagle Opinion Line, November 24, 2017: “The kindest word that can be ascribed to State Senator Susan Wagle, when she criticizes the Kansas Supreme Court? Disingenuous. She never mentions Brownback appointee, Justice Caleb Stegall; he has repeatedly agreed with his colleagues on school finance.”

    The likely reason Senator Wagle doesn’t mention Justice Stegall when criticizing the Court on school finance matters is that he, along with another judge, hasn’t participated. The recent opinions are signed “BEIER and STEGALL, JJ., not participating. MICHAEL J. MALONE and DAVID L. STUTZMAN, Senior Judges, assigned.” Why? “Justices Carol Beier and Caleb Stegall have both recused themselves from the Gannon case — Stegall because he served as Brownback’s chief counsel before he was appointed to the Kansas Court of Appeals in 2014; Beier did not provide a reason for her recusal.” See Kansas Supreme Court rejects lawmakers’ school finance changes, threatens in new ruling to close schools.

    Quality of life, or a boatload of cash

    Ron Sylvester in The Hutchinson News: “It’s all about quality of life. [Wichita Mayor Jeff] Longwell said Wichita drew Cargill and its $60 million investment downtown by investing in its arts community, parks, trails and a new library. Businesses move to town, not because of tax breaks and cash incentives, Longwell said, but because the people who work for those companies want to live there.”

    First, Wichita didn’t draw Cargill downtown. It was already located in downtown Wichita. Wichita merely retained Cargill. No new jobs are anticipated.

    As to the role of quality of life: Possibly that was a factor. More likely? The millions in subsidy Cargill will receive. Cargill tapped pretty much every economic development incentive program it could, along with a few innovative additions, such as renting its parking garage to the city during the times Cargill doesn’t need it.vSee More Cargill incentives from Wichita detailed.

    Let’s ask the mayor this question: If tax breaks and cash incentives were not needed, why did the city (and the state) award so much in incentives?

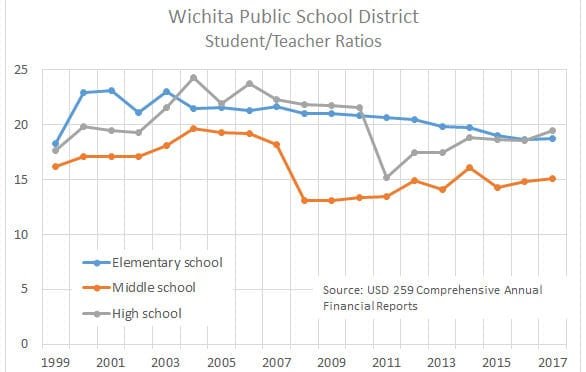
    Who oversaw Wichita schools when this happened?

    Teachers ‘fearful’ about escalating violence at Southeast High (Wichita Eagle, December 1, 2017): Some employees at Southeast High School in Wichita say they have ‘grave concerns’ about escalating violence and unruly behavior at the school, and they’re urging leaders to take ‘decisive and strong actions’ to combat it.” This continues a theme from this summer, as further reported in Behavior is getting worse in Wichita classrooms, data shows. (Wichita Eagle, June 16, 2017): “Discipline problems have increased substantially in Wichita schools over the past four years, particularly among the district’s youngest students, according to data obtained by The Eagle. The situation is frustrating teachers, prompting some of them to leave the profession, and has inspired a new program aimed at teaching elementary school students how to pay attention, follow directions and control their emotions.”

    I was surprised to learn of these problems that have been developing in the Wichita Public Schools. That’s because John Allison, the immediate past superintendent, was universally praised by the school board and district administration. Allison left at the end of June after serving eight years to become superintendent in Olathe. Hopefully that district will not experience the erosion in discipline that Allison presided over in Wichita.

    Amtrak affordable for whom?

    Wichita Eagle Opinion Line, December 3, 2017: “How I long for affordable rail service connecting Wichita to major cities. Traveling to family for the holiday reminds me of how sad it is to live in such a remote, isolated, inaccessible place as Wichita.” Inaccessible? We were told that subsidies to discount airlines and a new airport terminal would fix that. Then, the only reason Amtrak is affordable is that taxpayers pay a lot to keep Amtrak running. (That’s if Amtrak prices are really affordable. I just compared a few Amtrak trips with airline trips, and airfares aren’t much more, and offer many more options as to time. And if you value your time, there is no better way to waste it than on a train.) Other forms of travel receive subsidy too, but peanuts compared to Amtrak. From Randal O’Toole, Stopping the Runaway Train: The Case for Privatizing Amtrak:

    According to the U.S. Bureau of Transportation Statistics, after adjusting for inflation to 2011 dollars, subsidies to domestic air travel averaged about $14 billion a year between 1995 and 2007. Considering that the airlines carried an average of more than 500 billion passenger miles a year during those years, average subsidies work out to about 2.8 cents per passenger mile (see Figure 2).

    Using Bureau of Transportation Statistics’ numbers, highway subsidies over the same time period averaged about $48 billion a year. Highways carried about 4.1 trillion passenger miles per year, for an average subsidy of 1.1 cents per passenger mile. While 95 percent of the airline subsidies came from the federal government, all of the highway subsidies came from state and local governments.

    By comparison, federal Amtrak subsidies over the same time period averaged 25 cents per passenger mile. State subsidies averaged another 2.8 cents. Per-passenger-mile subsidies to Amtrak were nearly 9 times subsidies to air travel and nearly 22 times subsidies to highway travel.

    Airline, Highway, and Amtrak Subsidies per Passenger Mile, Cato Institute, 2012

  • From Pachyderm: Kansas Senate President Susan Wagle

    From Pachyderm: Kansas Senate President Susan Wagle

    Kansas Senate President Susan Wagle addressed members and guests of the Wichita Pachyderm Club on November 10, 2017. School finance and the Kansas Supreme Court was a prominent topic.

  • Kansas school spending

    Kansas school spending

    New data for spending in Kansas schools is available.

    Through its Data Central section, Kansas State Department of Education has made spending figures available for the school year ending in spring 2017, or the fiscal 2017 school year.

    These are amounts per pupil, adjusted for inflation to 2016 dollars, showing change from 2016 to 2017.

    State aid: $8,613 to $8,714
    Federal aid: $1,058 to $1,082
    Local: $3,460 to 3,441
    Total: $13,144 to $13,326

    In 2015 there was a shift in the way state and local figures are allocated, so it’s important to look at state and local spending as a sum. This figure increased from $12,073 to $12,155.

    In the charts below, state and local total spending, per pupil, adjusted for inflation, has been remarkably level since 2013. At the same time, schools are telling us spending has been slashed.

    Click charts for larger versions.