Tag: Kansas state government

Articles about Kansas, its government, and public policy in Kansas.

  • Government employee costs in the states

    Government employee costs in the states

    The states vary widely in levels of state government and local government employees and payroll costs, calculated on a per-person basis. Kansas ranks high in these costs, nationally and among nearby states.

    Two states have annual payroll costs of over $4,000, calculated by taking the total payroll cost and dividing by population. Many states operate on little more than half that. Only ten states have total government employee payroll costs greater than Kansas, on a per-person basis. (This does not include federal government employees.)

    When looking at a selection of nearby states, we see that only Nebraska has higher payroll costs for state and local government employees, when calculated on a per-person basis using the state’s population.

    This data is from the U.S. Census Bureau for 2012, the most recent year available. Using Tableau Public, I created an interactive visualization. I show the full-time equivalent employees divided by the population for each state. Also, the annual payroll divided by population. (The Census Bureau supplies payroll data for only one month, the month of March, so I multiply by 12 to produce an approximation of annual payroll cost.)

    Using the visualization: Sorting and selecting.
    Using the visualization: Sorting and selecting.
    There are two series of data, “Local government” and “State government.” The first series refers to the number of local government employees in each state, such as city and county employees. The second series refers to the number of state government employees in each state. Check boxes allow you to include either or both series in the chart.

    By clicking on column headers or footers (“State,” “Annual payroll per person,” Full-time equivalent employees per person”) you can sort by these values.

    Click here to open the visualization in a new window. Data is from United States Census Bureau, Government Employment & Payroll, released March 2014.

  • Tax collections by the states

    Tax collections by the states

    Kansas state government collects more tax revenue than most surrounding states. Additionally, severance taxes are a minor contribution to collections, even in Texas.

    Note: this visualization has been updated. Click here for the most recent version.

    The United States Census Bureau conducts an Annual Survey of State Government Tax Collections. It’s useful to gather figures for Kansas and some nearby states.

    The data considers only tax collections by state government. It does not include cities, counties, school districts, or the many other taxing jurisdictions that states may have formed. I have computed this data on a per-person basis. Data is for 2013.

    State tax collections for Kansas and some nearby states. Click for a larger version.
    State tax collections for Kansas and some nearby states. Click for a larger version.
    Considering total tax collections by state governments, note that Kansas, at $2,633 per person per year, is only slightly below the average for all states. For a group of nearby states, Arkansas and Iowa have higher state tax collections than Kansas. Nebraska, Oklahoma, Colorado, Texas, and Missouri are lower.

    In some cases, state tax collections are substantially lower. Texas collects $1,955 per person per year, which is 25.75 percent less than Kansas.

    Using the visualization.
    Using the visualization.
    Of note are severance taxes, which are taxes collected based on the extraction of oil, gas, and sometimes minerals. Kansas has a severance tax that produces, on a per person basis, $26 per year. In Texas the same tax produces $176 per person per year, and in Oklahoma, $134.

    I’ve created an interactive visualization of this data that you may use. Click here to open the visualization in a new window.

  • Kansas City Star’s dishonest portrayal of renewable energy mandate

    Kansas City Star’s dishonest portrayal of renewable energy mandate

    Commentary from Kansas Policy Institute.

    Kansas City Star’s dishonest portrayal of renewable energy mandate

    By Dave Trabert

    A recent Kansas City Star editorial criticizing opponents of Kansas’ renewal energy mandate for being disingenuous was itself a fine example of disingenuity.

    Kansas law mandates that utility companies purchase specific levels of renewable energy, which means that Kansans are forced to purchase wind energy and pay higher energy prices. The degree to

    Wind farm near Spearville, Kansas.
    Wind farm near Spearville, Kansas.
    which it is more expensive is a matter of dispute, but even the Star admits that wind is more expensive than fossil fuel alternatives. The Star describes this mandate as “consumer-friendly.”

    They falsely say “these laws encourage electric facilities to supplement their use of fossil fuels with renewables.” The law does not “encourage;” it requires.

    The Star touts economic gains to the wind industry but ignores the reality that those gains come at the expense of everyone else in the form of higher taxes, higher electricity prices and other unseen economic consequences.

    They conclude by saying people “deserve a choice”, but mandates are the opposite of choice. Real choice would not only allow citizens to individually decide whether to purchase renewable energy, but to choose their energy supplier as well. Maybe it’s time to look at breaking up the utility monopoly in Kansas as other states have done.

  • Wichita property taxes compared

    Wichita property taxes compared

    An ongoing study reveals that generally, property taxes on commercial and industrial property in Wichita are high. In particular, taxes on commercial property in Wichita are among the highest in the nation.

    The study is produced by Lincoln Institute of Land Policy and Minnesota Center for Fiscal Excellence. It’s titled “50 State Property Tax Comparison Study, March 2014” and may be read here. It uses a variety of residential, apartment, commercial, and industrial property scenarios to analyze the nature of property taxation across the country. I’ve gathered data from selected tables for Wichita. A pdf version of the table is available here.

    A pdf version of this table is available.
    A pdf version of this table is available; click here.
    In Kansas, residential property is assessed at 11.5 percent of its appraised value. (Appraised value is the market value as determined by the assessor. Assessed value is multiplied by the mill levy rates of taxing jurisdictions in order to compute tax.) Commercial property is assessed at 25 percent of appraised value, and public utility property at 33 percent.

    This means that commercial property pays 25 / 11.5 or 2.18 times the property tax rate as residential property. (The study reports a value of 2.263 for Wichita. The difference is likely due to the inclusion on utility property in their calculation.) The U.S. average is 1.716.

    Whether higher assessment ratios on commercial property as compared to residential property is good public policy is a subject for debate. But because Wichita’s ratio is high, it leads to high property taxes on commercial property.

    For residential property taxes, Wichita ranks below the national average. For a property valued at $150,000, the effective property tax rate in Wichita is 1.324 percent, while the national average is 1.508 percent. The results for a $300,000 property were similar.

    Wichita commercial property tax rates compared to national average
    Wichita commercial property tax rates compared to national average
    Looking at commercial property, the study uses several scenarios with different total values and different values for fixtures. For example, for a $100,000 valued property with $20,000 fixtures (table 25), the study found that the national average for property tax is $2,591 or 2.159 percent of the property value. For Wichita the corresponding values are $3,588 or 2.990 percent, ranking ninth from the top. Wichita property taxes for this scenario are 38.5 percent higher than the national average.

    In other scenarios, as the proportion of property value that is machinery and equipment increases, Wichita taxes are lower, compared to other states and cities. This is because Kansas no longer taxes this type of property.

  • What is the record of economic development incentives?

    What is the record of economic development incentives?

    On the three major questions — Do economic development incentives create new jobs? Are those jobs taken by targeted populations in targeted places? Are incentives, at worst, only moderately revenue negative? — traditional economic development incentives do not fare well.

    Money GrabberJudging the effectiveness of economic development incentives requires looking for the unseen effects as well as what is easily seen. It’s easy to see the groundbreaking and ribbon cutting ceremonies that commemorate government intervention — politicians and bureaucrats are drawn to them, and will spend taxpayer funds to make sure you’re aware. It’s more difficult to see that the harm that government intervention causes.

    That’s assuming that the incentives even work as advertised in the first place. Alan Peters and Peter Fisher, in their paper titled The Failures of Economic Development Incentives published in Journal of the American Planning Association, wrote on the effects of incentives. A few quotes from the study, with emphasis added:

    Given the weak effects of incentives on the location choices of businesses at the interstate level, state governments and their local governments in the aggregate probably lose far more revenue, by cutting taxes to firms that would have located in that state anyway than they gain from the few firms induced to change location.

    On the three major questions — Do economic development incentives create new jobs? Are those jobs taken by targeted populations in targeted places? Are incentives, at worst, only moderately revenue negative? — traditional economic development incentives do not fare well. It is possible that incentives do induce significant new growth, that the beneficiaries of that growth are mainly those who have greatest difficulty in the labor market, and that both states and local governments benefit fiscally from that growth. But after decades of policy experimentation and literally hundreds of scholarly studies, none of these claims is clearly substantiated. Indeed, as we have argued in this article, there is a good chance that all of these claims are false.

    The most fundamental problem is that many public officials appear to believe that they can influence the course of their state or local economies through incentives and subsidies to a degree far beyond anything supported by even the most optimistic evidence. We need to begin by lowering their expectations about their ability to micromanage economic growth and making the case for a more sensible view of the role of government — providing the foundations for growth through sound fiscal practices, quality public infrastructure, and good education systems — and then letting the economy take care of itself.

    Following is the full paper, or click here.

  • Kauffman index of entrepreneurial activity

    Kauffman index of entrepreneurial activity

    The performance of Kansas in entrepreneurial activity is not high, compared to other states.

    The Ewing Marion Kauffman Foundation prepares the Kauffman Index of Entrepreneurial Activity. According to the Foundation, “The Kauffman Index of Entrepreneurial Activity is a leading indicator of new business creation in the United States. Capturing new business owners in their first month of significant business activity, this measure provides the earliest documentation of new business development across the country.”

    Kauffman Index of Entrepreneurial Activity, showing Kansas highlighted against neighboring states. Click for larger version.
    Kauffman Index of Entrepreneurial Activity, showing Kansas highlighted against neighboring states. Click for larger version.
    As shown by the data, Kansas ranks low in entrepreneurial activity. This is true when Kansas is compared to the nation, and also when compared to a group of nearby states.

    I’ve prepared two visualizations that present this data. One holds data for all states. Click here to open it in a new window.

    Instructions for using the visualization of Kauffman data. Click for larger version.
    Instructions for using the visualization of Kauffman data. Click for larger version.
    A second visualization presents the data for Kansas and some nearby states. Click here to open it in a new window.

    Visualization created using Tableau Public.

  • Kansas economy has been lagging for some time

    Kansas economy has been lagging for some time

    Critics of tax reform in Kansas point to recent substandard performance of the state’s economy. The recent trend, however, is much the same as the past.

    real-gdp-state-2014-05-19There are a number of ways to measure the performance of an economy. Often the growth of jobs is used. That’s fine. Here I present an alternative: the gross domestic product for a state. As with job growth, it is not the only measure of a state’s economy. It is a comprehensive measure, encompassing changes in population, employment, and productivity. The nearby static illustration from an interactive visualization shows Kansas (highlighted in blue) compared to some neighboring states.

    real-gdp-state-2014-05-19-instructionsThe visualization holds data from the U.S. Bureau of Economic Analysis. You may click on a state’s name to highlight it. You may choose different industry sectors, such as government or private industry.

    Use the visualization below, or click here to open it in a new window, which may work best. Visualization created using Tableau Public.

  • Debunking CBPP on tax reform and school funding — Part 4

    From Kansas Policy Institute.

    Debunking CBPP on tax reform and school funding — Part 4

    By Dave Trabert

    kansas-policy-institute-logoWe continue our debunking of the Center on Budget and Policy Priorities (CBPP) latest report entitled “Lessons for Other States from Kansas’ Massive Tax Cuts.” Part 1 dealt with state revenues. Part 2 covered state spending in general and school funding in particular. Part 3 addressed claims that that tax reform hasn’t boosted the economy. Today we tackle their assertion that tax cuts won’t lead to economic growth.

    CBPP claim #4 — Little Evidence to Suggest That Tax Cuts Will Improve Kansas’ Economy in the Future

    Actually, there is a lot of evidence; CBPP just conveniently avoids it. Instead, they substitute their opinion and employ their standard tactic of making claims without disclosing supporting data; they also reference predictions that Kansas will trail the nation next year in some economic indicators.

    We’ll start the debunking with a brief history lesson. Private sector job growth in Kansas trailed the national average in ten of the last fifteen years (1998-2013). Kansas’ private sector gross domestic product trailed eight times (1997-2012) and personal income trailed eleven of the last fifteen years (1998-2013). Indeed, Kansas’ history of economic stagnation was the impetus for tax reform. As we explained in Part 3, the full economic impact of tax reform will take years to unfold. It’s intellectually dishonest of CBPP to imply that tax reform isn’t working because a long term negative trend hasn’t suddenly created tremendous gains.

    Now let’s look at the evidence. The adjacent table compares the performance of the ten states with the lowest state and local tax burdens with the ten states with the highest burdens, based on the most recent rankings from the Tax Foundation. The low-burden states are Wyoming, Alaska, South Dakota, Texas, Louisiana, Tennessee, New Hampshire, Nevada, South Carolina and Alabama. The high-burden states are New York, New Jersey, Connecticut, California, Wisconsin, Minnesota, Maryland, Rhode Island, Vermont and Pennsylvania.

    The low-burden states increased jobs at twice the rate of high-burden states. Low-burden states have superior growth in Wages and Salaries and Private Sector Gross Domestic Product. Low-burden states have positive domestic migration while high-burden states have negative domestic migration. In other words, US residents are choosing to move to low-burden states and choosing to leave high-burden states.

    Tax reform critics like to attribute the superior economic performance of low-burden states to weather and access to ports and natural resources. But you’ll notice that both groups have states with good weather, bad weather, coastal, land-locked and natural resources. But there is one category which really separates the two groups of states — spending. High-burden states spend 40 percent more per resident to provide the same basket of essential services. States with an income tax spend 49 percent more than those without an income tax.

    The key to having low taxes is to keep spending under control by providing services at a better price. A state could be awash in oil revenue and still have a high tax burden if it spent more. Texas, by the way, gets less than 3 percent of revenue from oil; they have a low tax burden because they only spent $2,293 per resident to provide the same basic basket of services on which Kansas spent $3,409 (2012 actual per NASBO).

    The moral of the story is pretty clear: states that spend less, tax less — and grow more.

  • Myth: The Kansas tax cuts haven’t boosted its economy

    From Kansas Policy Institute.

    Debunking CBPP on tax reform and school funding — Part 3

    By Dave Trabert

    kansas-policy-institute-logoWe continue our debunking of the Center on Budget and Policy Priorities (CBPP) latest report entitled “Lessons for Other States from Kansas’ Massive Tax Cuts.” Part 1 dealt with state revenues and Part 2 covered state spending in general and school funding in particular. Today we debunk their claims that tax reform hasn’t boosted the economy.

    CBPP claim #3 – Kansas’ tax cuts haven’t boosted its economy.

    While tax reform hasn’t produced the “shot of adrenaline” predicted by Governor Brownback, the problem is one of political enthusiasm rather than economics. Most elected officials are prone to effusive optimism for their ideas, just as opponents to their ideas can often be counted upon to distort and deliberately misstate information in pursuit of their own beliefs.

    The data pretty clearly shows that states with lower tax burdens have much stronger economic growth and job creation over time; we’ll review the facts in Part 4. Today’s post covers some of the reasons why the benefits of Kansas’ tax reform will unfold over several years rather than overnight and explain a number of misleading claims by the Center on Budget and Policy Priorities (CBPP).

    Many employers are also awareFirst of all, tax reform was implemented while coming out of a recession. It’s impossible to know the extent to which this impacts employers’ decision-making on adding jobs or relocating, but having run a few businesses, I can appreciate how the initial benefits of tax reform might be used to shore up the business while continuing to work through the recession.

    Concurrent federal changes are also a factor. Pass-through income on LLCs, Subchapter S corps, partnerships and proprietorships was not subject to state income tax in 2013 but those employers were simultaneously hit with higher federal income taxes (marginal rates and on capital gains) and multiple changes related to Obamacare.

    Predictability is an important element of tax policy, and some of the mixed signals coming out of Topeka over the last two years may also be prompting taxpayers to proceed cautiously. The 2012 tax reform legislation would have reduced income taxes by $4.5 billion over the first five years but changes implemented in 2013 took back about $700 million. While still a very positive net effect, the 2013 changes sent a number of mixed signals.

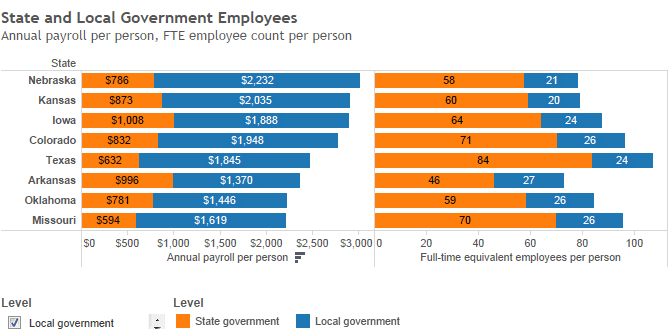
    Many employers are also well aware that a majority of legislators and Governor Brownback have not yet made the necessary (and quite feasible) spending reductions that will be required to fully implement tax reform. Kansas’ General Fund budget in 2012 was 25 percent more per-resident than states with no income taxtotal budgeted spending was 39 percent higher on a per-resident basis. Every state provides the same basic services – public education, highways, social services programs, etc. — but some states provide those services at a much better price and keep taxes low.

    The fiscal year 2015 General Fund budget of $6.273 billion is a new record for Kansas and is 2.9 percent higher than the 2012 budget. Until government is made to operate more efficiently, taxpayers must consider the possibility of further modifications to the tax plan — and that uncertainty will continue to impact economic growth.

    Relocating a business is also not something that happens quickly. For starters, leases might have several years to run before a move is feasible.

    CBPP uses a combination of unsubstantiated claims, fails to put a lot of information in context and exploits the unrealistic notion that tax reform would have an immediate, explosive impact on the state’s economy. “Data from” is not how intellectually honest people substantiate a position; they show you all their data or at least tell you exactly what data they used and where to find it. Claiming that a one-year change in jobs or earnings is proof that something as complex as major tax reform failed is just a political statement; it is certainly not an intellectually honest economic analysis.

    Yes, private sector job grew a little slower in 2013 than in 2012, but that was not a Kansas phenomenon. In fact, private sector job growth nationwide in 2012 was 2.2% but dipped to 2.1% in 2013.[1] This is a good example of CBPP ignoring context.

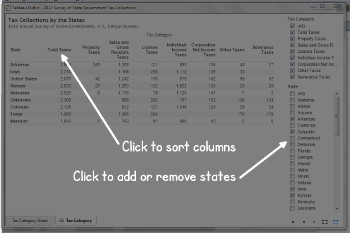
    It’s also important to examine the underlying factors that contribute to a state average. The adjacent table shows that Kansas did better than all but one adjacent state in 2013. Colorado did better, but then Colorado has historically had a better tax structure than Kansas and also did a better job of controlling spending. Less favorable tax and spending policy has been introduced in Colorado over the last few years but, just as it takes time for upward momentum to build, it does as well for the full measure of bad policy to be seen.

    Digging deeper, we find that the Kansas City, Kansas metro area not only outperformed the national average but also grew at five times the rate of the Kansas City, Missouri metro area. The Wichita metro lost jobs in aerospace but that is a reflection of the global economy; the balance of the Wichita metro was almost at the national average.

    CBPP dismisses the increase in new business filings but if history is any guide, these gains are quite significant. Research conducted by the Center for Applied Economics at the University of Kansas found that, if not for jobs created by new startups in their first year of existence, Kansas would have only had two years of net job growth between 1997 and 2010.

    Dr. Arthur Hall, who conducted the research at KU, says “Economic development is a numbers game. The more that an economic environment motivates entrepreneurs to try new business ideas, the more likely a gazelle will be born.” Dr. Hall cites Garmin Industries as an example of what he calls a “gazelle” — a company founded by two people in Lenexa, Kansas in 1989 that is now a multi-billion dollar company.

    Hall’s views are similar to those of Carl Schramm, former CEO of the Ewing Marion Kauffman Foundation, a leading entrepreneurial think tank in Kansas City. In 2010, Schramm told Forbes Magazine “The single most important contributor to a nation’s economic growth is the number of startups that grow to a billion dollars in revenue within 20 years.”[3]

    The initial economic signs are encouraging but the true economic impact of tax reform won’t be known for several years. Snap judgments based on partial one-year data are the hallmark of politicians and special interest groups looking for justification to support their beliefs — whether in support of or opposition to tax reform.

    [1] Bureau of Labor Statistics, average annual private sector employment not seasonally adjusted.

    [2] The Kansas City, Kansas metro is comprised of Franklin, Johnson, Leavenworth, Linn, Miami and Wyandotte counties.  The Kansas City, Missouri metro is comprised of Bates, Caldwell, Cass, Clay, Clinton, Jackson, Lafayette, Platte and Ray counties.

    [3] “What Grows an Economy,” Forbes Magazine.