Tag: Kansas State Department of Education

  • School choice and funding

    School choice and funding

    Opponents of school choice programs argue the programs harm traditional public schools, both financially and in their ability to serve their remaining students. Evidence does not support this position.

    The prevalent argument is that charter schools and other school choice programs drain funds from public schools. That is, if a public school student chooses to attend a charter or private school, and if the money follows the student to the other school, the public school district loses money that it otherwise would have received. Therefore, the public school district is worse off, and so too are its students.

    A rebuttal is that since a public school has shed the responsibility for schooling the student, its costs should fall correspondingly. This would be true if all the costs of a public school are variable. Some costs are fixed, however, meaning they can’t be adjusted quickly — in the short run, that is. An example is the cost to maintain a classroom. If a school has one less student than the year before, it still requires the same support for utilities. One or several fewer students doesn’t mean that fewer teachers are needed.

    Public schools and their lobbyists, therefore, argue that school choice programs are a financial burden to public schools. Under school choice programs, they say, public schools lose students and their accompanying funding, but the public schools retain their fixed costs.

    The Fiscal Effects of School Choice Programs on Public School Districts (cover)The question, then, is what portion of a school’s costs are variable, meaning costs that schools can adjust quickly, and what portion are fixed, meaning they can’t be adjusted quickly? Benjamin Scafidi, professor of economics at Kennesaw State University, has examined schools looking for the answer to this question. His paper The Fiscal Effects of School Choice Programs on Public School Districts, published by EdChoice (formerly The Friedman Foundation for Educational Choice), holds answers to these questions.

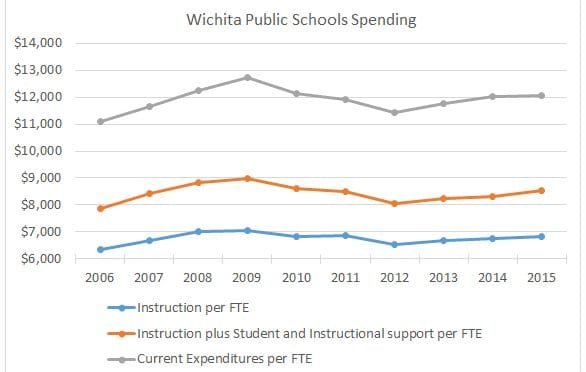
    The first question is this: What is the relation of school choice programs to school districts’ variable costs? Scafidi has endeavored to determine the breakdown between variable and fixed costs in each state. In Kansas, for the 2008 – 2009 school year, total spending per student was $11,441. Of that, Scafidi estimates $3,749, or 32.8 percent, were fixed costs. Variable costs were $7,692, or 67.2 percent. Since then spending has risen, but there’s no reason to think the allocation of costs between fixed and variable has changed materially. For the school year ending in 2015 total spending per student was $13,1241. That implies fixed costs per student of $4,305 and variable costs per student of $8,819.

    Now, how much money would a public school lose if a student chose to attend a school other than the traditional public schools? For Kansas this question is complicated by recent changes in the way public schools are funded. Prior to the school year ending in 2016, Kansas used a school funding formula that started with a figure called “base state aid per pupil.” For 2015 the value was $3,852, and that is the starting point for calculating state spending per student.

    In a recent presentation on this topic, Scafidi said: “Any school choice program where about $8,000 per student or less, on average, follows the child to the school of his or her choice, improves the fiscal situation of the public school district, on average, and students who remain in public schools have more resources available for their education.” Considering only base state aid per pupil, a typical Kansas school district, which has variable costs of $8,819 per student, has its fiscal situation improved when it loses a student and the accompanying $3,852 in state funding.

    Kansas School Finance Formula, from Kansas Policy Institute, August 2014
    Kansas School Finance Formula, from Kansas Policy Institute, August 2014
    Many Kansas students, however, trigger much more funding due to weightings that compensate for the purported higher costs of some situations. The largest weighting in Kansas, based magnitude, is the “at-risk” weighting. It adds 45.6 percent to base state aid. So if a Kansas public school loses such a student and weighting, it loses $5,608 in funding. That is far less than its variable costs of $8,819. State funding for Kansas schools in the school year ending in 2015 was $8,5672 per student, still less than school districts’ variable costs.

    I asked Scafidi what is the dividing line between variable and fixed costs? The answer is that within two or three years, schools should be able to adjust their fixed costs to be in line with their needs. This is in line with the economic and accounting reality that says in the long run, all costs are variable.

    Can school districts adjust their costs quickly in response to changing enrollments? This may be a problem for the very smallest districts, those with just one or two teachers per grade, Scadifi concedes. In his paper, Scafidi illustrates two examples of districts in Georgia with just over 1,000 students making adjustments. In Kansas, there are 286 school districts. Of these, 207 have enrollment of less than 1,000 students, but only 20 percent if the state’s students are in these small districts.

    School districts often dispute the contention that they are able to reduce their variable costs rapidly in response to enrollment changes. Scafidi notes that if school districts say they cannot reduce costs when they lose students, the implication is that all of their costs are fixed. If that is true, then schools should not receive additional funding when enrollment rises. If all their costs truly are fixed, the total cost of running a school district does not change with enrollment — either up or down.

    Going forward in Kansas

    Kansas is in the process of formulating a new school financing method. For the school years ending in 2016 and 2017 the state has used a block grant method, whereby state funding to school districts was frozen at the 2015 level with some increases programmed into the law. Current law anticipates a new funding formula being passed in the 2017 legislative session and applied to the school year ending in 2018.

    One of the most important goals for the new funding method should be transparency and flexibility. The prior school finance formula was criticized as being complex and difficult to understand. For example, in June the Kansas Legislature held a special session in order to increase school funding in response to a decision by the Kansas Supreme Court. But, more than half of the higher funding the Wichita school district received went to property tax reduction, rather than being spent on schools.3 Citizens have trouble understanding how increasing state school funding means a reduction in property tax instead of more teachers or schoolbooks. This illustrates a problem with transparency in the prior funding formula.

    Remaining students

    We have seen that school choice programs do not harm the finances of local school districts. The second question concerns the quality of education for the students who remain in public schools.

    To answer this question, we must recognize the wide variation of teacher efficacy. Some are very good, and some very poor. Further, the difference between good and bad is large. Eric A. Hanushek and others have found that very good teachers routinely produce 1.5 years of gain in achievement during an academic year. Bad teachers produce 0.5 years of gain.4 If a student is unfortunate enough to experience ineffective teachers two or three years in a row, the student may be so far behind as to never catch up.

    What does this have to do with school choice programs? If public schools have to downsize due to students lost for any reason — including school choice programs — this gives public schools an opportunity to shed their least effective teachers. This means that students who remain in public schools have a higher likelihood of experiencing the most effective teachers.


    Notes

    1. Kansas State Department of Education. Total Expenditures by District. Available at www.ksde.org/Agency/Fiscal-and-Administrative-Services/School-Finance/Budget-Information/Total-Expenditures-by-District.
    2. ibid.
    3. Lowry, Brian. Kansas schools will stay open as court OKs funding fix. Wichita Eagle, June 28, 2016. Available at www.kansas.com/news/local/education/article86508017.html.
    4. Hanushek and Rivkin. Teacher Quality. Available here.
  • VIDEO: KPERS payments and Kansas schools

    VIDEO: KPERS payments and Kansas schools

    There is a claim that a recent change in the handling of KPERS payments falsely inflates school spending. The Kansas State Department of Education says otherwise. View below, or click here to view at YouTube.

    Click here for more about this topic.

  • School staffing and students

    School staffing and students

    Trends for the nation and each state in teachers, administrators, and students, presented in an interactive visualization.

    Each year states report data to the National Center for Education Statistics. While NCES provides methods for extracting data, it isn’t an easy process, and opportunities to produce charts are limited. Here I present trends in teachers, administrators, and students for each state from 1998 to the school year ending in summer 2014, the most recent year of data that is available.

    For each state, the charts show the growth in teachers, administrators, and students. For both teachers and students, the value used is full-time equivalency. A table also shows pupil/teacher ratio and pupil/administrator ratio.

    There are some obvious mistakes in the data. An example is the number of administrators reported for Kansas for years 2007 through 2009. Figures obtained directly from Kansas State Department of Education show no sudden drop and increase in the count of administrators. Nonetheless, I have presented the data as retrieved from NCES.

    Sorting on columns.
    Sorting on columns.
    For the nation as a whole, the count of students has increased 8.5 percent since 1998. The count of teachers (full-time equivalent) rose by 13.4 percent, and the number of administrators by 19.4 percent. Individual states vary widely, with many having increased administrators at a far faster pace than either students or teachers. Some states, however, have reduced the number of administrators, or the rate has grown slower than students and teachers.

    Click here to open and use the visualization.

    Data is from the Elementary/Secondary Information System (ElSi) at National Center for Education Statistics, part of the U.S. Department of Education and the Institute of Education Sciences. The number of administrators is calculated as the sum of “LEA Administrators” and “LEA Administrative Support Staff.” LEA Administrators is defined by NCES as “The count of Local education agency superintendents, deputy and assistant superintendents, and other persons with district-wide responsibilities such as business managers and administrative assistants. Excludes supervisors of instructional or student support staff.” LEA Administrative Support Staff is defined as “The count of Staff members who provide direct support to LEA administrators, including secretarial and other clerical staff.”

    Using the visualization. Click for larger.
  • Kansas government ‘hollowed-out’

    Kansas government ‘hollowed-out’

    Is Kansas government “hollowed-out” even though spending is rising?

    In the Wichita Eagle, Burdett Loomis writes: “In 2011, Gov. Sam Brownback and a far-right Kansas House of Representatives began to hollow out state government, all in the name of smaller, more efficient, more private administration.”1

    Loomis doesn’t define what he means by “hollow out” but the measure of the size of government is spending. Not taxation, but spending, because if government spends without taxing by the same amount, someone has to pay, eventually. Or, in the case of Kansas, we spent funds saved from years when Kansas collected more than it spent. (Yes, Kansans were over-taxed.) Then, we raised taxes.

    Kansas General Fund. Click for larger version.
    Kansas General Fund. Click for larger version.
    In recent history Kansas general fund spending hasn’t fallen, except for one year, and that doesn’t “hollow out” government. Tax revenue declined, but what did Kansas do in response? Instead of cutting spending, the state engaged in deficit spending. For two years in a row, Kansas spent over $300 million each year from its savings in order to support (mostly) increasing spending. When that savings ran out, the state raised taxes rather than cutting spending.2

    Charts at the end of this article show Kansas government spending, from general fund and all funds spending. One chart shows total dollars spent, and one shows per-capita spending. Both are adjusted for inflation. On these charts it’s difficult to see where total spending has been cut or slashed in recent years. All funds spending continues its upward trend, with a few exceptions. General fund spending remains level or trending slightly upwards.

    Loomis: “But the value of a stable, reliable state government that delivers core programs in education, transportation, health and social services remains a bedrock element of most successful American states.”

    An example from the visualization. This shows statewide spending, per pupil, adjusted for inflation. Click for larger version.
    An example from the visualization. This shows statewide spending, per pupil, adjusted for inflation. Click for larger version.
    Education spending in Kansas is not falling.3 Tables at Kansas State Department of Education have the numbers.4 Now we hear that the increases in spending are “all KPERS,” meaning contributions to the state retirement fund for teachers, and the state has recently changed to method of reporting KPERS contributions in a way that artificially inflates school spending. But Kansas State Department of Education says the method of reporting KPERS has not changed for ten years.5 Maybe we should ask former governor Kathleen Sebelius why she changed the method of reporting KPERS contributions in a way that (purportedly) artificially inflates school spending.

    Kansas students compared to national. Click for larger.
    Kansas students compared to national. Click for larger.
    By the way, when writing about “reliable” state services, I wish Loomis would take notice of the huge gaps in achievement in our state’s schools between white students and minority students. For Kansas white students, 42 percent are proficient in reading at grade 4. For Kansas black students, only 15 percent are proficient, and 20 percent of Kansas Hispanic students. Similar gaps appear in reading at grade 8, and in math at grades 4 and 8.6 The sad fact is that this gap is reliable, occurring year after year.

    KDOT spending on major road programs. Click for larger version.
    KDOT spending on major road programs. Click for larger version.
    As for transportation, there have been transfers from the state’s transportation fund to the general fund. This has been going on for a long time. But look at actual spending on roads. KDOT’s Comprehensive Annual Financial Report shows spending in the categories “Preservation” and “Expansion and Enhancement” has grown rapidly over the past five years. Spending in the category “Maintenance” has been level, while spending on “Modernization” has declined. For these four categories — which represent the major share of KDOT spending on roads — spending in fiscal 2015 totaled $932,666 million, up from a low of $698,770 in fiscal 2010. This is actual spending on roads without regard to transfers in or out of the highway fund.7

    Transfers from Sales Tax to KDOT. Click for larger.
    Transfers from Sales Tax to KDOT. Click for larger.
    And while critics of the current administration focus on transfers from the highway fund, look at transfers to the fund. Nearby is a chart showing how many sales tax dollars were transferred to the highway fund. In 2006 the transfer was $98,914 million, and by 2015 it had grown to $511,586 million, an increase of 417 percent. Inflation rose by 18 percent over the same period.8

    I’ll leave it to someone else to research spending on health and social services.

    Near the end of the article, Loomis writes: “Over the past few years, much of the political discourse has focused on shrinking revenues from tax cuts.” But we should really be looking at the level of spending.

    Now: Could it be possible that even with rising state spending that services are, in fact, being “hollowed out?” Yes. Absolutely. It is, after all, government providing these services.

    Kansas Spending Adjusted for CPI 2016-01

    Kansas Spending, Per Capita, Adjusted for CPI 2016-01

    Notes for charts:
    Data is from Kansas Fiscal Facts 2015
    2015 through 2017 are approved figures, not actual spending
    2015 and beyond population are my estimates
    CPI is Consumer Price Index – All Urban Consumers, CUUR0000AA0


    Notes

    1. Loomis, Burdett. Kansas is becoming a hollowed-out state. Wichita Eagle, July 9, 2016. Available at www.kansas.com/opinion/opn-columns-blogs/article88555862.html.
    2. Kansas has been borrowing, however. See: Weeks, Bob. Kansas transportation bonds economics worse than told. Available at wichitaliberty.org/kansas-government/kansas-transportation-bonds-economics-worse-than-told/.
    3. Weeks, Bob. Kansas school spending: Visualization. Available at wichitaliberty.org/wichita-kansas-schools/kansas-school-spending-visualization/.
    4. Kansas State Department of Education. Total Expenditures by District. Available at www.ksde.org/Agency/Fiscal-and-Administrative-Services/School-Finance/Budget-Information/Total-Expenditures-by-District.
    5. Weeks, Bob. KPERS payments and Kansas schools. Available at wichitaliberty.org/wichita-kansas-schools/kpers-payments-kansas-schools/.
    6. Weeks, Bob. ‘Game on’ makes excuses for Kansas public schools. Available at wichitaliberty.org/tag/wichita-and-kansas-schools/.
    7. Weeks, Bob. Kansas highway spending. Available at wichitaliberty.org/kansas-government/kansas-highway-spending/.
    8. Weeks, Bob. Sales tax revenue and the Kansas highway fund. Available at wichitaliberty.org/kansas-government/sales-tax-revenue-kansas-highway-fund/.
  • Kansas City Star as critic, or apologist

    Kansas City Star as critic, or apologist

    An editorial in the Kansas City Star criticizes a Kansas free-market think tank.

    Kansas City Star editorial writer Steve Rose penned a column accusing Kansas Policy Institute of lies and distortions in its analysis and reporting on Kansas government.1 Here, we take a critical look at a few accusations.

    Rose: “To what end does the institute spew out its gross distortions? Its stated goal is to shrink government and to dramatically lower taxes. I would add: Regardless of the possible negative effect to services.”

    friedman-spending-categories-2013-07It is axiomatic that government is the worse way to fund and provide services, with a very few exceptions. Why is this? When government spends money, the spending falls into one of two categories: First, it may be politicians and bureaucrats spending someone else’s money on yet someone else. Or, it may be politicians, bureaucrats, and special interest groups spending someone else’s money on themselves. When goods and services are provided by the private sector, it’s either people spending their own money on themselves, or spending their own money on someone else.

    In the two latter cases, people have a strong incentive to get good value for their spending. In the first case, indifference and waste is the rule. In the second case — when spending someone else’s money on yourself — greed is the dominant motivation and consideration.2

    We all would be better off if we relied less on the state and if more was provided by the private sector. Education is not one of the exceptions where government is a better alternative to private sector provision.

    Rose: “The institute knows the public usually does not have either the time or inclination to get the details of the real story. The headline numbers stick, not the long, boring details of the truth.”

    Kansas school spending per student, ratio of state aid per pupil to base state aid per pupil, 2014
    Kansas school spending per student, ratio of state aid per pupil to base state aid per pupil, 2014
    The irony here is that it is our state’s newspapers that have left out the truth. Much reporting and editorializing has focused only on base state aid per pupil.3 While base state aid per pupil did fall, total state spending per pupil rose. Data available from the Kansas State Department of Education shows that the ratio of total state spending to base state aid has generally risen since the adoption of the school finance formula two decades ago. For the school year ending in 1993 the ratio was 0.7, meaning that state aid was less than base state aid. For the school year ending in 2014, the ratio was 1.85, or 2.6 times as much as in 1993. This means that while base state aid per pupil for 2014 was $3,838, total spending by the state was $7,088 per pupil.4

    (While the school funding formula has been replaced by the block grants, the weightings were baked into the grant amounts.)

    I think that this qualifies as the “long, boring details of the truth” that Rose complains of. I wonder if he understands this. All he has to do is retrieve data from Kansas State Department of Education.

    As far as the public’s level of knowledge of school funding, polls commissioned by Kansas Policy Institute show the public grossly uninformed about school finance.5 If you don’t trust a poll administered by Survey USA in which the text of all questions is revealed, know that surveys of the nation produce similar results.6

    Rose: “As for the lies about schools, the institute counts in its preposterous $14,000 number non-operating costs such as interest on the debt from bond issues patrons passed in previous elections. It counts contributions to the retirement fund for teachers. It counts pass-through federal money that costs the state nothing.”

    I don’t know where Rose gets the $14,000 spending number, but here are some actual per-pupil figures reported by KSDE for some large districts in northeast Kansas:7 Olathe: $12,803. Blue Valley: $13,168. Shawnee Mission: $12,273. Kansas City: $15,936. (For the entire state: $13,124.)

    Yes, these numbers include interest on debt incurred from borrowing to build school facilities. Rose seems to say this money should not be counted as part of the ongoing cost of schools. But where should it be counted? Capital costs like these can’t be ignored, yet the Kansas school spending establishment often deflects attention from them, contending these costs “don’t get into the classroom.” Irony alert: These costs are the classroom.

    Retirement fund costs for teachers? If not for schools and teachers, would the state have this cost? So where should these costs be charged?

    Whether we’re spending too much (or not enough) on these items is another matter. But classifying them properly should not be controversial. Rose’s criticism is characteristic of the political class and its enablers. When the actual cost of government is revealed, the response is to attack the messenger, and truth is cast aside.

    But Rose is correct about one thing: Pass-through federal money costs the state nothing. It is the state’s taxpayers that pay the federal government so it can send funds back to Kansas as — according to Steve Rose — money without cost.

    NAEP scores for Kansas reading, grade four.
    NAEP scores for Kansas reading, grade four.
    Finally, Rose defends government services. The public is being “served well,” he says, with “superb services.” I wonder if he’s examined scores for Kansas schoolchildren on the most recent National Assessment of Educational Progress. On this test, which is the same in all states, we find these results: For Kansas white students, 42 percent are proficient in reading at grade four. For Kansas black students, only 15 percent are proficient, and 20 percent of Kansas Hispanic students. Similar gaps appear in reading at grade eight, and in math at grades four and eight.8

    I’m not satisfied with this, and I don’t think Steve Rose and the Kansas City Star should be. This is the saddest thing about Rose’s column. It used to be that newspaper editorial writers worked to hold government accountable. Now we have this newspaper making excuses for government and unfactually criticizing those who work for accountability. It’s Kansas schoolchildren, especially poor and minority, that suffer the most.


    Notes

    1. Rose, Steve. Phony numbers meant to smear superb services. Kansas City Star, July 2, 2016. Available at www.kansascity.com/opinion/opn-columns-blogs/steve-rose/article87288257.html.
    2. For more on this, see Friedman: The fallacy of the welfare state, available at wichitaliberty.org/economics/friedman-the-fallacy-of-the-welfare-state-2/.
    3. Weeks, Bob. Wichita school spending: The grain of truth. Available at wichitaliberty.org/wichita-kansas-schools/wichita-school-spending-the-grain-of-truth/.
    4. Weeks, Bob. Kansas school weightings and effects on state aid. Available at wichitaliberty.org/wichita-kansas-schools/kansas-school-weightings-and-effects-on-state-aid/.
    5. Weeks, Bob. Survey finds Kansans with little knowledge of school spending. Available at wichitaliberty.org/wichita-kansas-schools/survey-finds-kansans-little-knowledge-school-spending/.
    6. Education Next. Results from the 2015 Education Next Poll. Available at educationnext.org/2015-ednext-poll-interactive/.
    7. Kansas State Department of Education. Total Expenditures by District. Available at www.ksde.org/Agency/Fiscal-and-Administrative-Services/School-Finance/Budget-Information/Total-Expenditures-by-District.
    8. U.S. Department of Education, Institute of Education Sciences, National Center for Education Statistics, National Assessment of Educational Progress (NAEP). This table available at nces.ed.gov/nationsreportcard/subject/publications/stt2015/pdf/2016008KS4.pdf.
  • A Kansas school superintendent writes about school finance

    A Kansas school superintendent writes about school finance

    A Kansas school superintendent explains school financing, but leaves out a large portion of the funds that flow to his district.

    Steve Splichal, the superintendent of the Eudora Public School District, writes a blog in which he explained Kansas school financing. In one post he wrote this:

    The general fund is largely made up from state funding called Base State Aid Per Pupil, or BSAPP. In 2008, the BSAPP reached it’s highest level of $4,400. As a result of funding cuts made during the Great Recession, the BSAPP was reduced dramatically. The Governor’s allotment (a cut of $42 in the BSAPP) lowered the BSAPP to $3,810. This is just about the same amount school district’s received in 2000. To put this in perspective, if the BSAPP had just maintained the rate of inflation, we would have a BSAPP of about $6,059.1

    For the school year ending in 2014, which is the last before a change in the way state funding was accounted for, Eudora schools received $7,651 per student from the state.2 This is at a time the Eudora superintendent says base state aid is $3,810.

    Kansas school spending per student, ratio of state aid per pupil to base state aid per pupil, 2014
    Kansas school spending per student, ratio of state aid per pupil to base state aid per pupil, 2014
    The superintendent’s article doesn’t mention this. Leaving out funding arising from weightings is a common mistake, or in some cases, a deliberate deception. The Kansas school finance formula used through the fiscal 2015 school year started with base state aid and added weightings to determine the aid a school district would receive. These weightings are substantial. In 2014, because of weightings, total state funding was 1.85 times base state aid.3

    To his credit, the Eudora superintendent has a page explaining that the Kansas school finance formula — before the block grants — had weightings.4 But while lamenting the low level of base state aid, he never explained that his district received an additional 100.8 percent of base aid because of these weightings. Now the formula is gone, but the weightings are baked into the block grants that districts receive.

    Let’s be charitable of the superintendent’s motives and attribute this to a forgetful and innocent oversight rather than deception. But I’m not going to forgive the superintendent for his errors in English usage.


    Notes

    1. Splichal, Steve. *General Fund and BSAPP.* Eudora Rocks! A blog by Superintendent of Schools Steve Splichal. January 19, 2015. Available at eudorarocks.org/general-fund-and-bsapp/.
    2. Kansas State Department of Education. School finance data warehouse. Available at www.ksde.org/Portals/0/School%20Finance/data_warehouse/total_expenditures/d0491exp.pdf.
    3. Weeks, Bob. Kansas school weightings and effects on state aid. Voice for Liberty. Available at wichitaliberty.org/wichita-kansas-schools/kansas-school-weightings-and-effects-on-state-aid/.
    4. Splichal, Steve. Kansas School Finance Formula. Eudora Rocks! A blog by Superintendent of Schools Steve Splichal. January 19, 2015. Available at eudorarocks.org/kansas-school-finance-formula/.
  • A plea to a legislator regarding Kansas schools

    A plea to a legislator regarding Kansas schools

    On Facebook, a citizen makes an appeal to her cousin, who is a member of the Kansas Legislature.

    What should we do regarding the school funding “crisis” in Kansas? One citizen made an appeal to her cousin — a member of the Kansas Legislature — through Facebook. I’ll omit names to respect the privacy of both parties.

    The writer stated, “The children of our state are on the line here. We need our public schools.” Well, children need education, but it doesn’t have to be delivered through public schools.

    She also wrote, “This isn’t about politics anymore, it’s about our kids. Kids who have NO chance at attending private schools.” Examining this statement — that there are kids who have no chance at attending a private school — is illuminating. Let’s look at some figures.

    For the school year ending in 2015, Kansas State Department of Education reports that Kansas schools spent a total of $13,124 per student. Of that, $8,567 was state aid, $1,101 was federal aid, and $3,469 was from local revenue.1

    Now, what does a private school cost? Considering schools not affiliated with a church — although some of these provide a classical Christian education — there are some that cost less than total spending, and even less than just the Kansas state aid per pupil.2

    So the writer might be surprised to learn that the taxpayers of the State of Kansas are already paying more than some private school prices. If the state would be willing to let parents spend these funds at schools of their choice, then any Kansas child would be able to afford a private school education. This could be accomplished through tax credit scholarships, vouchers, or education savings accounts. Kansas does, in fact, have a tax credit scholarship program, but it is limited — crippled, I would say — and the Kansas public school establishment fights against it.

    Kansas students compared to national. Click for larger.
    Kansas students compared to national. Click for larger.
    The writer pleaded this: “Needy kids who have the RIGHT to a free and good public education.” I would refer the writer to my article Kansas NAEP scores for 2015 and ask her to take note of the performance of black and Hispanic students in Kansas. For example, 42 percent of Kansas white students are proficient in reading at grade 4. For black students, it’s 15 percent. Are these black students receiving a “good” public education? Of course not. And is there any amount of additional spending that will correct this? If the money is spent through the existing school system the answer is: No, probably not. At least considering any additional sums that are within the realm of political possibility.

    There are school reforms available in other states that have found to be very helpful to black and Hispanic students. The Kansas public school establishment fights to keep these reforms out of Kansas.

    In making her plea for additional school spending, the writer pleads to her legislator cousin, “I know you have a wonderful, giving heart.” But when legislators vote to spend funds for any purpose, they aren’t giving from their heart. They’re simply using the power of government to transfer money from one person to another. There’s nothing wonderful about that.


    Notes

    1. Kansas State Department of Education. Total Expenditures by District, Entire State. Available at www.ksde.org/Portals/0/School%20Finance/data_warehouse/total_expenditures/d0Stateexp.pdf.
    2. For example, see Classical School of Wichita at around $6,000 per year, Cair Paravel Latin School in Topeka at around $7,000 to $8,000 per year, and the Independent School in Wichita from $10,000 to $10,600 per year.
  • KPERS payments and Kansas schools

    KPERS payments and Kansas schools

    There is a claim that a recent change in the handling of KPERS payments falsely inflates school spending. The Kansas State Department of Education says otherwise.

    A member of the Kansas State Board of Education has written an article that has received widespread attention. But the member, Jim Porter, is wrong on several accounts.

    In his article, Porter stated that a recent change in the handling of Kansas Public Employees Retirement System (KPERS) contributions falsely inflates school spending.1

    This is a standard argument of Kansas public school spending advocates, which is that because of a change in the way teacher retirement funds (KPERS contributions) are handled, it looks like the state is spending more on schools, when in fact it is not.

    In response, Kansas Policy Institute noted this: “According to Dale Dennis, KPERS funding was last sent directly to KPERS in 2004; it has since been sent directly to school districts included in reported school funding totals.”2

    Here, Dale Dennis contradicts Porter. Dennis is Deputy Commissioner at Kansas State Department of Education and head of Fiscal and Administrative Services.

    Wichita Public Schools, State Revenue by Source, KPERS ContributionsEven though Dennis is the state’s top education finance official, we don’t have to rely solely on him to illustrate Porter’s error. Information from the Wichita public school district3 shows the same. Here I’ve plotted the funding sent by the state of Kansas to USD 259 for KPERS contributions. As Dennis indicated, in 2005 the Wichita school district started receiving money from the state for KPERS. Prior to that year it received none.

    Trabert’s article explains other ways in which Porter is wrong. I have to wonder what is the underlying reason for Porter writing things like this. Is he being told incorrect information or is he simply lying?


    Notes

    1. “Deception #2 – Until recently the state contribution to the Kansas Public Employees Retirement System (KPERS) was sent directly to KPERS. Now the funds are transferred to the public school account and then transferred to KPERS on the same day. Again, this was lauded as an increase to public school funding even though it was the same amount of money with just an additional transfer from the State of Kansas to the school to KEPRS.” Jim Porter for Kansas State Board of Education – District 9 Facebook post. Available at www.facebook.com/JimPorterKSBOE9/posts/1001536676582800.
    2. “Jim Porter’s Deception #2 – According to Dale Dennis, KPERS funding was last sent directly to KPERS in 2004; it has since been sent directly to school districts included in reported school funding totals. Again, Mr. Porter doesn’t define “recently” but most people would take it to mean within the time frame he references (the Brownback administration) and that clearly is not the case.” Trabert, Dave. State school board member should practice what he preaches. Available at kansaspolicy.org/state-school-board-member-practice-preaches/.
    3. USD 259 Comprehensive Annual Financial Report for 2015, State Revenue by Source, Governmental Funds, and USD 259 Comprehensive Annual Financial Report for 2007, State Revenue by Source, Governmental Funds.
  • Wichita school spending

    Wichita school spending

    Spending by the Wichita public school district, adjusted for inflation and enrollment.

    Has spending by the Wichita public school district risen or fallen? A nearby chart shows recent spending figures. These figures are expressed on a per-student basis using full-time equivalent enrollment, adjusted to reflect changes in the consumer price index.

    Wichita school district, selected spending statistics. Click for larger.
    Wichita school district, selected spending statistics. Click for larger.
    (Current expenditures do not include facility acquisition and construction service, debt principal retirement, interest expense, and other expense. Over the past ten years, total expenditures per student have averaged $2,219 per year more than current expenditures.)

    Should anyone want to politicize these figures, note that the years of decline were under a Democratic governor and a one cent per dollar sales tax increase. For the past three years, these three measurements of spending have risen each year.


    Spending data is from USD 259 Comprehensive Annual Financial Report for 2015, Miscellaneous Statistics, page 122.
    Enrollment data from Kansas State Department of Education, available at http://www.ksde.org/Portals/0/School%20Finance/data_warehouse/total_expenditures/d0259exp.pdf.
    Data adjusted for inflation using Consumer Price Index for All Urban Consumers, U.S. Bureau of Labor Statistics.