Tag: Government spending
-

Kansas candidate briefings
Recently Kansas Policy Institute, along with Americans for Prosperity and Kansas Chamber of Commerce, held a series of briefings for candidates for the Kansas Legislature.
-
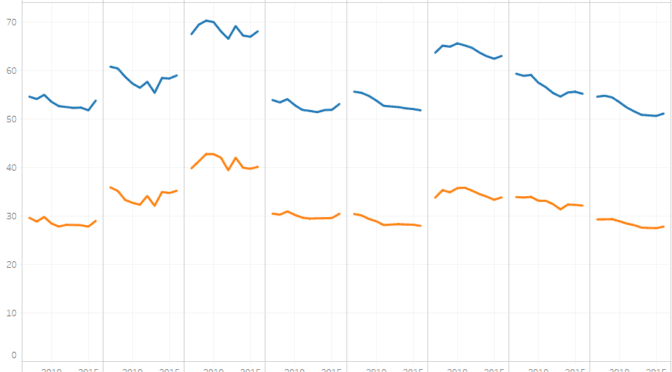
Kansas government employees
Kansas has a lot of government employees when compared to other states, and especially so in education.
-
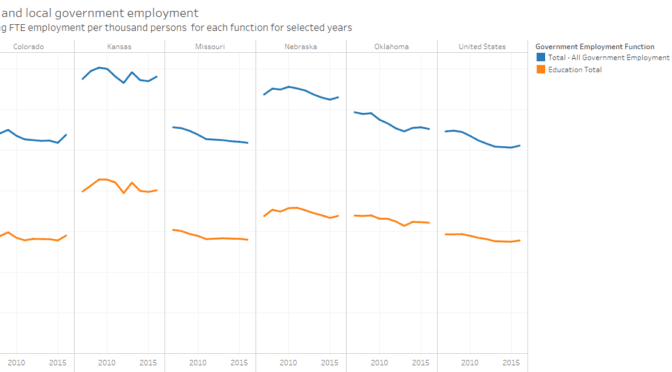
State and local government employee and payroll
Considering all government employees in proportion to population, Kansas has many compared to other states, and especially so in education.
-
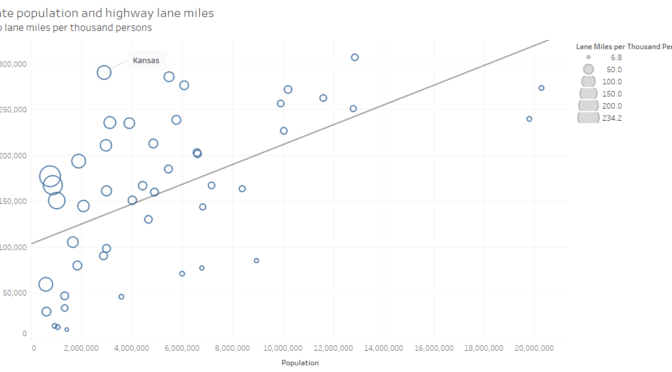
State highways
Kansas has a lot of highway miles compared to its population. Interactive visualization included.
-

WichitaLiberty.TV: Congressman Ron Estes
United States Representative Ron Estes discusses trade, FAA reauthorization and his amendment, entitlement reform, and spending.
-

WichitaLiberty.TV: United States Senator Dr. Tom Coburn
United States Senator Dr. Tom Coburn wrote the foreword to the book “What Was Really the Matter with the Kansas Tax Plan – The Undoing of a Good Idea.” He’s here to tell us what went wrong, and what we need to do.
-
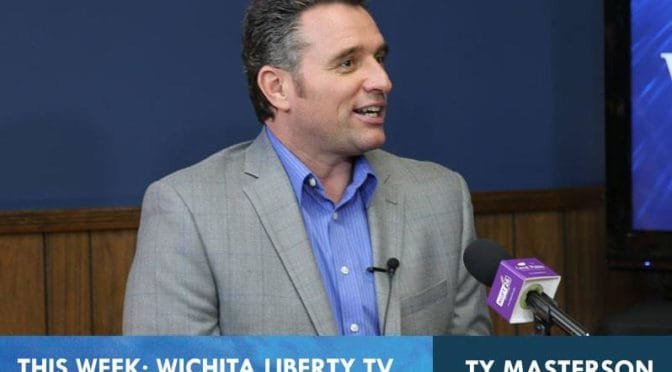
WichitaLiberty.TV: Kansas Senator Ty Masterson
Kansas Senator Ty Masterson, a Republican from Andover, joins Bob and Karl to update us on happenings in the Kansas Legislature.
-

Wichita baseball consulting contract extension may have no discussion
The City of Wichita proposes to extend a baseball consulting contract without public explanation or discussion.
-
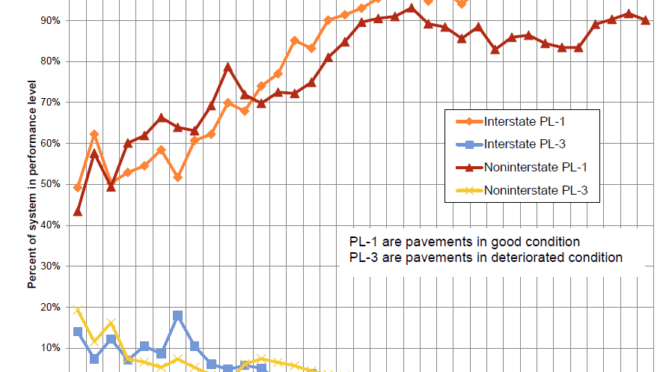
Kansas highways set to crumble, foresees former budget director
Duane Goossen, former high Kansas government official, says the state’s highways are in trouble. What is his evidence?
-

Kansas and Iowa schools
Should Kansas schools aspire to be more like Iowa schools?
-

WichitaLiberty.TV: What Was Really the Matter with the Kansas Tax Plan
Dave Trabert of Kansas Policy Institute joins Bob and Karl to discuss his new book What Was Really the Matter with the Kansas Tax Plan –- The Undoing of a Good Idea.
-

What Was Really the Matter with the Kansas Tax Plan
Tax relief opponents have repeatedly pointed to the 2012 Kansas tax plan as their primary example of why tax cuts do not work. But, other states like North Carolina, Indiana, and Tennessee contemporaneously, and successfully, cut taxes. What was different about the Kansas experience?