Tag: Government spending

  • Kansas school funding controversy is about entitlement, not need

    From Kansas Policy Institute.

    School funding controversy is about entitlement, not need
    By Dave Trabert

    When every Johnson County school district qualifies as a property-poor district, you know you have a broken school funding formula … and a controversial claim based on entitlement.

    The Kansas Legislature authorized $134 million in school funding this year in a good-faith effort to resolve the Supreme Court equity finding in Gannon v. State of Kansas. Most of the increase, $109 million –- was for Supplemental General State Aid (SGSA), which equalizes Local Option Budgets for property-poor districts.  The other $25 million was for equalization of Capital Outlay aid.

    Kansas Judicial Center
    Kansas Judicial Center
    You wouldn’t know it from most media coverage, but the Supreme Court ruling on equity provides the Legislature with broad latitude in resolving wealth-based disparity, and does not require specific funding levels. “We agree that the infirmity can be cured in a variety of ways — at the choice of the legislature. And the legislature should have an opportunity to promptly cure. Any cure will be measured by determining whether it sufficiently reduces the unreasonable, wealth-based disparity so the disparity then becomes constitutionally acceptable, not whether the cure necessarily restores funding to the prior levels.

    The Legislature didn’t have to increase SGSA in order to satisfy the Supreme Court ruling on LOB equity, but they did so anyway. The $109 million authorized was based on calculations from the Kansas State Department of Education, but KSDE underestimated the amount by which districts would increase their Local Option Budgets, and now school districts want another $36 million from taxpayers. Districts want this money because the formula says they are entitled to it. But there is ample evidence that more money is not needed, and now SB 71 has been introduced into Senate Ways and Means Committee to revise the equalization formula and eliminate the $36 million increase.

    SB 71 is opposed by school districts, but it is a necessary fix to a broken formula and frankly, districts don’t need the extra money.

    The intention of SGSA is to offset wealth-based disparity among school districts, but calculations from the Kansas Department of Education has the current formula allocating $54.8 million to districts in Johnson County –- the state’s wealthiest county. Every district in Johnson County is considered a “property-poor” district under the current formula, including Blue Valley, which may be the most affluent district in Kansas.

    Johnson County schools are being subsidized by taxpayers in far less affluent parts of Kansas under the current formula. One additional mill of property tax levied in the Blue Valley district raises $2.3 million; one mill raises $2.9 in Shawnee Mission and $1.7 million in Olathe. But taxpayers in counties where one mill generates less than $50,000 are being asked to subsidize property-rich districts; those counties include Cheyenne, Clark, Edwards, Ellis, Gove, Gray, Greeley, Kearny, Kiowa, Lane, Logan, Ness, Reno, Rice, Rooks, Rush, Russell, Stafford, Thomas, Trego and Wallace. One or more districts in those counties are considered ineligible for equalization aid by the current formula, but those districts’ patrons are expected to subsidize urban districts in Johnson County, Sedgwick County, Shawnee County and Wyandotte County –- just to name a few.

    On the issue of need, the K-12 Commission on Student Achievement and Efficiency heard testimony from school districts, regional service centers and others recently, confirming that school districts could operate much more efficiently. However, school districts made it very clear that they are strongly opposed to being required to make efficient use of taxpayer money. Legislative Post Audit also told the Commission that districts have not enacted many of their recommendations to reduce the cost of services.

    There is also no need to increase equalization of Capital Outlay aid. The $25 million allocated for this year was based on Capital Outlay property taxes levied by school districts last year, but districts increased local property taxes even more, entitling them to $20 million more in Capital Outlay equalization. This is another example of a broken school funding formula, as it has nothing to do with need. School districts began this year with a record $434.9 million set aside for Capital projects. Capital Outlay reserves are completely separate from capital projects related to bond issues and have increased each year since 2005. Districts may feel entitled to even more money for capital projects but there is no need to further pump up their reserves.

    The equalization system and the entire entitlement-based school funding system need to be replaced with a student-focused and taxpayer-focused perspective.

  • Judicial panel used cherry-picked data in Gannon decision

    Judicial panel used cherry-picked data in Gannon decision

    From Kansas Policy Institute.

    Judicial panel used cherry-picked data in Gannon decision

    By David Dorsey

    (w)e conclude that the Kansas K-12 school finance formula still stands as constitutionally inadequate by its failure to assure and implement adequate funding to meet and sustain a constitutionally adequate education as a matter of sound expert opinion from those with relevant and reliable expertise and experience with the Kansas K-12 school system.(emphasis added)

    Thus is the opinion, filed December 30, 2014, from the Shawnee County District Court three-judge panel as tasked by the Kansas Supreme Court pursuant to their decision in Gannon v. Kansas in March of 2014.

    We reported in a previous KPI blog that the unspecified underfunding of K-12 public education in Kansas identified in this decision is at least $548 million. The judges based their opinion on several categories of adequacy they deemed relevant to the case. One such category in the decision is entitled Adequacy As A Matter Of Student Performance (pp. 20-48). The judges included as its linchpin evidence an interview with Kansas City, Kansas USD 500 superintendent Dr. Cynthia Lane. Dr. Lane provided testimony regarding how a federal grant enabled Emerson Elementary, a USD 500 school, to significantly increase student performance.

    In short, Emerson Elementary is a small K-5 school. Several years ago, it gained notoriety for being declared the lowest performing elementary school in Kansas. As such, it was awarded a School Improvement Grant (SIG) from KSDE, authorized by the No Child Left Behind law. The school was given nearly $3 million over a three-year period (2010-11 to 2012-13 school years) to improve state assessment test scores. Dr. Lane testified that “fewer than 30 percent” of the students met state standards in math and reading prior to receiving the grant. According to demographic data published by KSDE, Emerson has about 95% economically disadvantaged students. While Dr. Lane testified that Emerson is ethnically “about 50 percent African American and about 48 percent Hispanic,” KSDE reported that the ethnic breakdown is about two-thirds Hispanic, one-quarter African American and less than 10% white. She told the court that over the life of the grant Emerson’s students performed “on both the reading and math state assessment to have more than 85 percent … meeting or exceeding expectations just in the last three years. It’s a remarkable story.”

    Apparently the court agreed, afforded to say:

    Given the continuing grade advancement and migration upwards of K-12 schoolers during their school careers, it seems but obvious that for educational advancement, much less the maintenance of results accomplished prior with the earlier funding initiatives implemented, but now abandoned, that the revenue streams which supported those results in that period of favorable funding needed to be continued to be provided in order to properly educate the continuing stream of new faces going forward, either initially entering the school system or advancing in grade. No evidence or proffer of evidence supports otherwise. (pp. 39-40, emphasis not added)

    Translated: More money = greater student achievement, and there is no evidence to the contrary.

    I will now proffer contrary evidence, a much less remarkable story that should have been proffered in the original court case: Northwest Middle School.

    The same year Emerson Elementary was awarded its SIG, another USD 500 school, Northwest Middle School, was awarded a similar grant with a higher amount of $4.77 million. Northwest has similar minority and economically disadvantaged populations to Emerson Elementary (just over half African American and just over one-third Hispanic and 98% low income). But the outcomes pursuant to the SIG were very much dissimilar, indeed.

    The following table and the accompanying graph show how Northwest Middle School scored on the state reading and math assessments for the three years prior to receiving the SIG and during the three-year implementation of the grant.

    Northwest Middle school from KPI 2015-01

    As the graphics show, achievement at Northwest had an uptick in both math and reading the first year of the grant, but then fell off dramatically the following two years. To put their performance in perspective the following graphs compare Northwest to Rosedale Middle School (the USD 500 school most comparable to Northwest according to KSDE) and the USD 500 district as a whole.

    Northwest and Rosedale from KPI 2015-01

    In reading, Northwest underperformed both Rosedale (which did not get a SIG) and the district as a whole both prior to and after receiving the grant. The trend and gap between Northwest and Rosedale remained amazingly consistent throughout this period. The picture in math is a little different. Northwest students maintained a slight advantage over Rosedale throughout the grant period and nearly eliminated the gap with the district as a whole. However, the overall trend is downward, with just over 40% of the Northwest middle schoolers proficient in math as of the last recorded state assessments.

    It is safe to say that in terms of achievement, that $4.77 million granted to Northwest Middle School in Kansas City, Kansas didn’t buy much. This is evidence that, once again, more money does not inherently make a difference in student outcomes. This nationwide study conducted by the Heritage Foundation supports that contention. Even Kansas’s own Legislative Post Audit says in this report (p. 107) that a correlation between increased funding and increased outcomes is inconclusive.

    As a 20-year teaching veteran, I know it’s not the money that makes a difference in student achievement. It’s commitment by students, parents, teachers, principals and administrators to make it happen. Trying to quantify that in dollar terms is a fool’s errand. If the increase in education funding prescribed in the most recent Gannon decision were to become a reality, it would mean a nice raise for teachers and likely more administrators, but student outcomes would remain flat and achievement gaps would continue. Think of it as Montoy redux.

    Clearly, the judges got it wrong. Let’s hope their decision gets overturned on appeal and an end is put to this seemingly endless carousel of education funding lawsuits. The citizens of Kansas deserve better.

  • The philosophy and research supporting at-risk funding

    From Kansas Policy Institute.

    The philosophy and research supporting at-risk funding –- second in a series
    By David Dorsey, Kansas Policy Institute

    As I discussed in the first blog in this series, the state of Kansas provides almost $400 million additionally each year for at-risk funding to K-12 education. But what is the philosophy behind spending more taxpayer dollars to educate economically disadvantaged students? What does the research say? And how have states responded in their particular “at-risk” funding formulas? In this blog I will briefly answer address these questions.

    It may sound like a dumb question, but why is it that it should cost more to adequately educate students who are disadvantaged? Sure, it seems intuitive, but where did that idea start and where is the research to back it up?

    The genesis of the premise that it costs more to adequately educate the economically disadvantaged comes from a 1969 article in theNational Tax Journal by three economists who attempted to explain why the cost of all local public services was outpacing inflation in post-World War II America. (Sidebar: their article is proof that the concern over rapidly expanding government spending is not a recent phenomenon.) The researchers suggested that differing costs for public service across jurisdictions could partially be explained by environmental factors. Specifically regarding education, they say that outcomes might be a function of “the ‘basic intelligence’ of pupils, home backgrounds and neighborhood conditions.” That seems to be the phrase subsequent researchers have locked onto to justify the need for what has become commonly known as at-risk funding.

    Many studies since then, including this 1997 study and this one from 2004, focused on spending disparities and “outcome” disparities among school districts within states. Again, without getting too “wonky,” studies showed school districts that were property poor, and as a parallel had lower per pupil spending (since school financing is primarily a function of property values), had lower outcomes than their counterparts with higher property values. And of course, those property poor districts had a disproportionate share of low income families/students. Therefore, the studies concluded that poor school districts needed more money to bring their students up to an acceptable minimum outcome standard. Researchers typically defined outcome as an index of a combination of standardized test scores and other indicators such as graduation rates.

    But these studies have remained academic exercises. Even though it is now a given that poor students require more money to reach a given outcome, most states now have some form of additional funding based on economic status of students. However, the amounts states have allocated are all less than the research concludes are necessary.

    Yes, politics and budget constraints trump academia.

    The Kansas At-Risk Timeline

    In 1992 a new law entitled the School District Finance and Quality Performance Act included a 5% weighting for students who qualified for free school lunch. That percentage was increased to 6.5% in 1997 and increased seven more times in the next decade to its current level of 45.6%. In 2006, two more categories of at risk were added. One was for schools with high percentages of at risk populations and/or an enrollment density of at least 212.1 students per square mile. The other additional category targeted money for students non-proficient in math and reading, but not eligible for a free lunch. (The non-proficient category was eliminated in 2014.) In dollar terms, the 5% in 1992 generated just over $13 million. That amount is now nearly $400 million.

    The situation in Kansas is not dissimilar to those in other states. At least 35 states have a mechanism for additional funding generated by economically disadvantaged students. Most of them use some variation of the number of students who qualify for free OR free or reduced lunches through the National School Lunch Program (NSLP). NSLP has been the choice because it is an expedient and convenient proxy for determining economically disadvantaged students since qualification for free/reduced lunches is predominantly income based. And like Kansas many have weight values that are not static. A 2004 study out of the University of Wisconsin reports that nationwide the weights range from 15% in Vermont to 62.5% in Illinois, while a presentation last year to the Nevada state legislature showed a low of 9.15% in New Mexico to 180.0% in Georgia. The thing to keep in mind here is that it is nearly impossible to compare Kansas to other states because not all states use the same definition of disadvantaged and some use multiple factors to determine additional spending.

    So how did Kansas go from a relatively modest 5% at-risk weighting in 1992 to a hefty 45.6% (with two additional categories) by 2006? That is the topic of the next blog.

    Next: The political history of at-risk funding in Kansas

  • A Kansas calamity, at $15,399 per pupil

    A Kansas calamity, at $15,399 per pupil

    If things are so bad in Kansas schools at this level of spending, will any amount of spending satisfy school districts?

    The Washington Post has presented a letter written by a schoolteacher in Wamego. Reading it, one might be excused for concluding that a massive calamity has befallen Kansas and Wamego specifically.

    The letter is full of complaints: “Resources and staff are limited.” “Due to budget cuts, again, we are not able to have a full-time librarian, art teacher, technology teacher or music teacher.” “Schools are already struggling because of underfunding so adding more fiscal responsibility will only further cut programs.”

    Click for larger version.
    Click for larger version.
    Given these complaints, we might look at the statistics for this district. Total spending for the school year that ended in 2014 was $15,399 per pupil. That’s lower than 2009, when spending was $16,154 (inflation-adjusted dollars). Spending in 2014 was up from the year before. See Kansas school teacher cuts, student ratios.

    Spending supported by the state was $7,359 last year, down from $8,609 in 2009 (inflation-adjusted).

    School Employment, USD 320 WamegoEmployment in this district has risen. Both the number of teachers and the number of certified employees is much higher than the 2009 — 2011 years. Correspondingly, the ratios of these employees to students has declined since then, although the pupil-teacher ratio has risen the past two years. See Kansas school spending visualization updated.

    School Employment ratios, USD 320 WamegoThis school district has one certified employee for every eight pupils.

    So: Some numbers are up, others are down, and some mostly unchanged. Taxpayers have to wonder, though: If a school district receives well over $15,000 per pupil each year, how much more does it want?

  • For Kansas schools, a share of your income is the standard

    For Kansas schools, a share of your income is the standard

    If Kansas personal income rises but the school spending establishment doesn’t get its cut, something is wrong, they say.

    A publication by KASB is titled “Despite increases, share of Kansans’ incomes spent on public schools is at a 30-year low.”

    In the document, KASB, the Kansas Association of School Boards, states: “According to new reports released by state agencies, total funding for Kansas school districts will exceed $6 billion for the first time this year. However, when compared to the total income of all Kansans, school spending will be at the lowest level in at least 30 years.”

    This is not the first time KASB has made this argument. It’s a curious and ultimately spurious argument, that even though more will be spent on Kansas schools this year, it’s still not enough, as Kansan’s incomes rose faster than school spending.

    Can we list the reasons why this argument is illogical?

    1. What if Kansas income declined? Would KASB then call for reducing school spending to match? Not likely.

    2. What if the number of students declined? Would KASB then be satisfied with spending less of our income on public schools? I don’t think so.

    3. What if Kansans decided to spend more on private education rather than public education? Would KASB be satisfied if the total spent on education remained constant? Not likely, as KASB is only concerned about public education. Money spent on private education, in fact, is viewed by KASB as money that should have been spent on public schools.

    Another indication of the perversity of this argument is that spending less of a share of our income to obtain a product or service is usually viewed as an advancement, not a situation to be cured. For example in 1929, American households spent 23.4 percent of disposable personal income on food. In 2013 it was 9.8 percent. This is a good thing. We have to work less in order to feed ourselves.

    But to the Kansas school spending establishment, that’s not the way the world should work. If personal income rises, so too should Kansas school spending, they say. This is the entitlement society at work. When KASB writes “Kansas are spending less of their income to fund public education” it’s not meant as a sign of advancement. Instead, it is the Kansas school spending establishment complaining that it isn’t getting its share.

    It’s a risky argument to make. Many Kansans are concerned that school spending rises while the quality of education falls. Kansas school vigorously oppose any sort of market-based reforms to Kansas education, such as school choice or treating teachers like private-sector employees are treated.

    Now, Kansas schools argue that if hard-working Kansans increase their income, schools should get their cut too.

  • Effect of federal grants on future local taxes

    Effect of federal grants on future local taxes

    Grants.gov logo“Nothing is so permanent as a temporary government program.” — Nobel Laureate Milton Friedman

    Is this true? Do federal grants cause state and/or local tax increases in the future after the government grant ends? Economists Russell S. Sobel and George R. Crowley have examined the evidence, and they find the answer is yes.

    The research paper is titled Do Intergovernmental Grants Create Ratchets in State and Local Taxes? Testing the Friedman-Sanford Hypothesis.

    The difference between this research and most other is that Sobel and Crowley look at the impact of federal grants on state and local tax policy in future periods.

    This is important because, in their words, “Federal grants often result in states creating new programs and hiring new employees, and when the federal funding for that specific purpose is discontinued, these new state programs must either be discontinued or financed through increases in state own source taxes.”

    The authors caution: “Far from always being an unintended consequence, some federal grants are made with the intention that states will pick up funding the program in the future.”

    The conclusion to their research paper states:

    Our results clearly demonstrate that grant funding to state and local governments results in higher own source revenue and taxes in the future to support the programs initiated with the federal grant monies. Our results are consistent with Friedman’s quote regarding the permanence of temporary government programs started through grant funding, as well as South Carolina Governor Mark Sanford’s reasoning for trying to deny some federal stimulus monies for his state due to the future tax implications. Most importantly, our results suggest that the recent large increase in federal grants to state and local governments that has occurred as part of the American Recovery and Reinvestment Act (ARRA) will have significant future tax implications at the state and local level as these governments raise revenue to continue these newly funded programs into the future. Federal grants to state and local governments have risen from $461 billion in 2008 to $654 billion in 2010. Based on our estimates, future state taxes will rise by between 33 and 42 cents for every dollar in federal grants states received today, while local revenues will rise by between 23 and 46 cents for every dollar in federal (or state) grants received today. Using our estimates, this increase of $200 billion in federal grants will eventually result in roughly $80 billion in future state and local tax and own source revenue increases. This suggests the true cost of fiscal stimulus is underestimated when the costs of future state and local tax increases are overlooked.

    So: Not only are we taxed to pay for the cost of funding federal and state grants, the units of government that receive grants are very likely to raise their own levels of taxation in response to the receipt of the grants. This is a cycle of ever-expanding government that needs to end, and right now.

    An introduction to the paper is Do Intergovernmental Grants Create Ratchets in State and Local Taxes?.

  • Wichita school district checkbook updated

    Wichita school district checkbook updated

    writing check
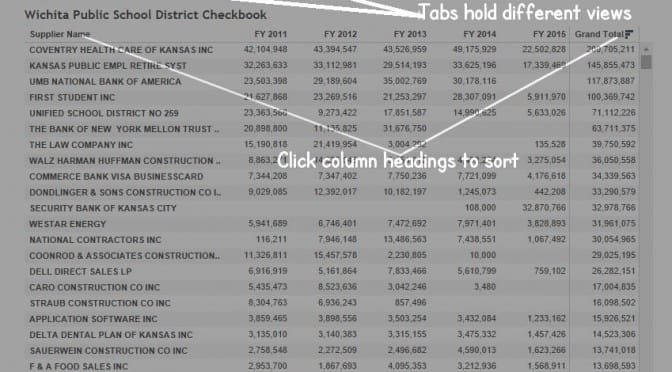
Data now available through November 2014.

    USD 259, the Wichita public school district, makes its monthly checkbook register available. I’ve gathered the monthly spreadsheets made the consolidated available for analysis through Tableau Public.

    The workbook (click here to open it in a new window) has a number of tabs, each showing the same data organized and summarized in a different way.

    There are some caveats. First, not all school district spending is in this database. For each year, the total of the checks is in the neighborhood of $350 million, while the total spending for USD 259 is over $600 million. So there’s spending that isn’t included in this checkbook data.

    Second, there are suppliers such as “Commerce Bank Visa BusinessCard.” Payments made to this supplier are over $7 million per year. These payments from the district’s checkbook undoubtedly pay a credit card bill, and this alone doesn’t let us know what the $7 million was spent on.

    wichita-school-checkbook-data-quality-exampleThere are some data quality issues, as seen nearby.

    USD 259 supplies this advice with this data: “The information you find may cause you to ask more questions. If so, the person to contact is Wichita Public School’s Controller, Barbara Phillips. She can be reached at (316) 973-4628, or at bphillips@usd259.net.”

    Using the Wichita school district visualization
    Using the Wichita school district visualization
  • At risk school funding in Kansas

    From Kansas Policy Institute.

    At Risk School Funding 101

    by David Dorsey

    Note: this is the first blog in a series on the issue of at risk funding and accompanies a comprehensive KPI at risk research project.

    Funding for public schools is a complicated proposition.

    There are many factors that go into determining just how much money school districts will receive and where it will come from every year from state and local sources. There are property taxes, state equalization, local options, and so many more considerations that it takes 93 columns on the master spreadsheet used by the Kansas Department of Education to sort it all out! And that doesn’t even count federal money.

    One piece of this funding puzzle is the “weighting” formula the state uses to adjust (increase) the amount of money that will go to each district based on certain characteristics of a) students (e.g. the number in vocational education) and b) the district (e.g. low or high enrollment). I presented the weighting formula in an earlier blog where you can see the formula in its entirety.

    One part of that formula determines how much extra money goes to districts under the banner of “at risk.” So what is this at risk funding? It provides extra dollars to schools based on the number of economically disadvantaged students enrolled. It is rooted in a philosophy, and research has attempted to support, that it costs more to adequately educate poor students. That ideal is operationalized (quantified) by using the number of students who qualify for free lunch under the United States Department of Agriculture’s National School Lunch Program (NSLP). Some states also include the number of students who qualify for reduced lunch cost under NSLP. Nearly all states use the school lunch program in some form as a basis for determining their versions of at risk population.

    This graphic shows how it works under current Kansas law. Base state aid per pupil (BSAPP) is $3,852. A student who qualifies for a free lunch is presently weighted at anadditional 45.6% of BSAPP and generates $5,609. (I say presently because at risk weightings have increased over time — more on that in the next blog.) Additionally, if more than half the students in a district are free lunch students a supplementary 10.5% weighting is added ($6,013). Currently, that applies to 57 of the state’s 286 school districts. One hundred four districts get a smaller, sliding scale additional percentage because they have between 35% and 50% at-risk students (more than $5,609 but less than $6,013). One hundred twenty five districts get no additional at risk money. Then, in order to determine the exact dollar amount a district will receive, the total weighted percentage is multiplied by the current BSAPP ($3,852 per pupil for 2015).

    I told you it’s complicated.

    Coincidentally, it is actually simpler than previous years because the legislature passed a law that eliminated a small at risk category in the 2014 session.

    To show exactly how free lunch turns into at risk dollars, I present the following table that shows at risk funding for seven selected school districts that reveals the funding impact at risk dollars can have.

    At risk data for selected districts, 2014-2015, from Kansas Policy Institute

    Wichita, by far the biggest school district in the state, gets over $72 million per year. Pittsburg and Hays have virtually identical enrollments, but Pittsburg gets nearly $2.3 million more at risk money than Hays because Pittsburg has nearly twice the number of free lunch students, but more than twice as many weighted free lunch students. For the entire state the total at risk funding is just over $395 million.

    That’s a lot of money, even in government terms.

    One of the core issues associated with at risk funding is how it impacts student achievement, especially in light of the numerous and significant increases in at risk funding over the years (to be presented in the next blog). We will examine in depth what previous KPI research has shown to have limited positive effect.

    Next: How did we get here? A look at the research and realities of additional funding for educating the economically disadvantaged.