Tag: Government spending
-

Wichita water planning in 2014, and now
In 2014 the City of Wichita advised spending millions on a water project, but it wasn’t for the main water treatment plant replacement, and it wasn’t financed with debt.
-

Wichita checkbook updated
Wichita spending data presented as a summary, and as a list.
-
In Wichita, revision of water history
In 2014 Wichita voters rejected a sales tax which would have provided $250 million to spend on a water project. What were the city’s concerns?
-

Wichita transit, by the numbers
Transit in Wichita isn’t working very well, and it is expensive.
-
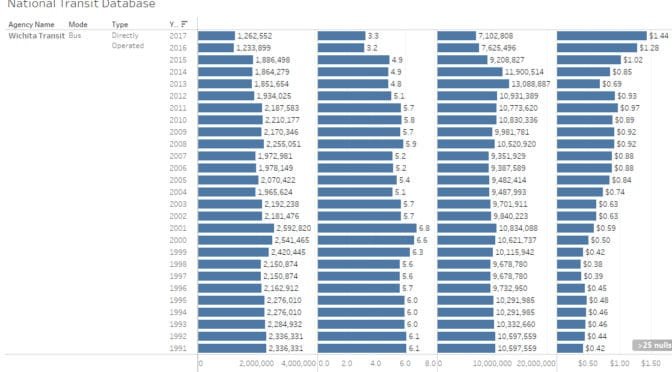
Updated: National transit database
An interactive visualization of data over time from the National Transit Database. Now with data through 2017.
-

Wichita public schools, by the charts
Data from the annual report for USD 259, the Wichita, Kansas, public school district.
-
Wichita considers a new stadium
The City of Wichita plans subsidized development of a sports facility as an economic driver. Originally published in July 2017.
-

Naftzger Park costs up, yet again
The cost of fixing an oversight in the design of Naftzger Park in downtown Wichita is rising, and again we’re not to talk about it, even though there are troubling aspects.
-

Facade improvement program raises issues in Wichita
An incentive program in Wichita should cause us to question why investment in Wichita is not feasible without subsidy.
-

Naftzger Park cost rising, and we’re not to talk about it
The cost of the Naftzger Park makeover is rising, will be paid for with borrowed funds, and possibly handled without public discussion.
-

Kansas agency expenditures
Data regarding State of Kansas agency spending presented in an interactive visualization.
-

Efficiencies in Sedgwick County government
A document that hasn’t been made public details savings achieved in Sedgwick County over a recent period of nearly three years.