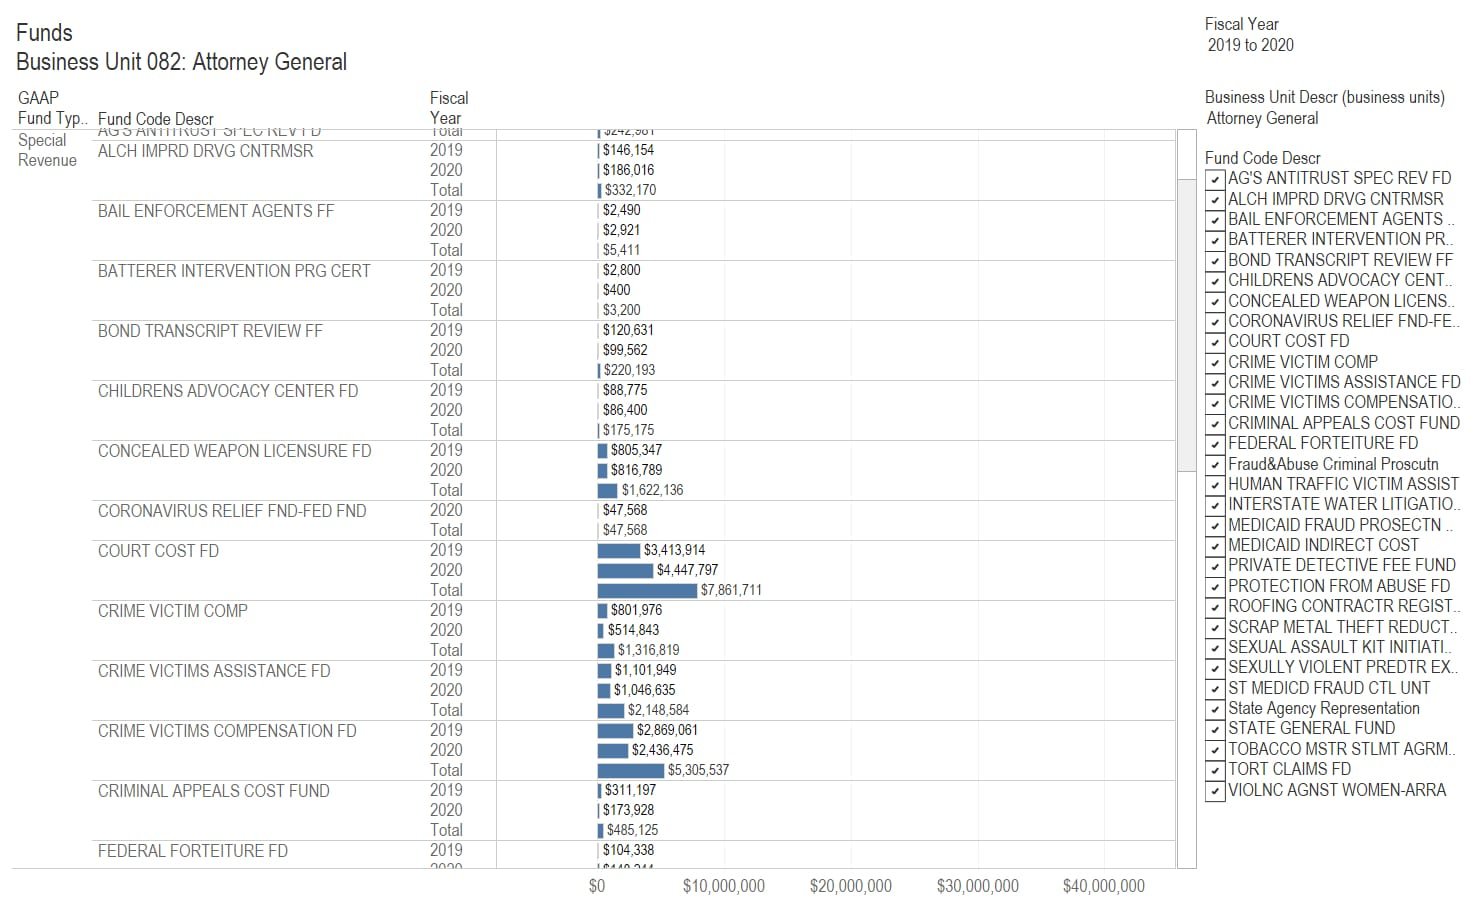
Data regarding State of Kansas agency spending presented in an interactive visualization.
The source of this data is KanView, the Kansas transparency portal, through its download center. Data from multiple years are combined into one database. Data starts with fiscal year 2011. (more…)
Kansas has nearly the highest number of local government employees per resident, compared to other states.
These are local government employees only. State and federal government employees are not included. The source of this data is the United States Census Bureau. I’ve gathered it and created an interactive visualization. Additionally, using each state’s population for each year, I’ve also computed the annual payroll on a per-resident basis and the number of full-time equivalent (FTE) employees per thousand residents.
For all local government employees, Kansas had 50.55 employees per thousand residents in 2016, higher than all states (and areas) but the District of Columbia and Wyoming. These employees had an annual payroll of $2,355.09 per resident. Eleven states were higher.
For the country as a whole, the values are 37.33 employees and annual payroll of $2,232.01 per thousand residents.
Considering elementary and secondary education, Kansas had 29.58 such employees per thousand residents. This was higher than all states but Wyoming. The payroll for these employees was $1,237.80 per resident, with thirteen states above Kansas.
Kansas is a small state in terms of population. Might small states have higher needs for employees on a per-resident basis? A plot of employees vs. population shows nearly no relationship between the two. Plots using urban percentage and population density show somewhat stronger relationships, but nothing very significant. (In these plots, I removed the District of Columbia from the data, as it is a special case that is all urbanized.)
Click charts for larger versions.
These are local government employees only. State and federal government employees are not included. Sometimes this causes discrepancies that need to be understood by considering other data. For example, Hawaii has no local employees in elementary and secondary education, as it has one school district which is run by the state. 1 Because education is a large expense for local governments (in most cases), Hawaii, in these charts, ranks as the state with the lowest number of government employees, considering only local government employees.
Click here to learn about the visualization and use it to make your own charts and tables.
Example from the visualization. Click for larger.Example from the visualization. Click for larger.
Looking at the number of state government employees in proportion to population, Kansas has many compared to other states.
Each year the United States Census Bureau surveys federal, state, and local government civilian employees. I’ve gathered this data and present it in an interactive visualization using several views and supplementary calculations.
The Census Bureau collects both counts of employees and payroll dollars. Comparisons based on the number of employees are useful, bypassing issues such as differing costs of living and salaries in general.
Considering all government functions and state government employees only, Kansas had 18.7 full-time equivalent (FTE) employees per thousand residents in 2019. 12 states had more. These figures are for state government only. Many government employees are employed by local governments such as cities, counties, and school districts. These employees are not included in this visualization.
In the nearby chart showing Kansas and nearby states, the level of employment in Kansas is high and rising for total employment and education employment.
The top takeaway of the Congressional Budget Office Monthly Budget Review for August 2020 is that the deficit for the month is smaller than last August. But there are details.
Sometimes it pays to read the fine print. Otherwise, you may receive a false impression. Here is the monthly budget review for August 2020, which is the eleventh month of fiscal year 2020:
The federal budget deficit in August 2020 was $198 billion, CBO estimates, $3 billion less than the deficit in August of last year. However, that comparison is distorted by shifts in the timing of certain payments in both years that had opposite effects on the August deficit in their respective years.
Because September 1, 2019, fell on a weekend, federal payments totaling about $52 billion were made in August rather than in September of that year (increasing the deficit in August). A similar shift, of $57 billion, occurred this year, but from August into July, reducing the August 2020 deficit. Without those timing shifts, the deficit this August would have been $106 billion (or 72 percent) larger than in the same month last year. Outlays for unemployment compensation contributed significantly to the deficit this August, accounting for about half of the increase in government spending (excluding the timing shifts). (emphasis added)
As can be seen in the nearby chart, the deficit for fiscal year 2020 was tracking closely the deficit for the prior year. Then came spending on the pandemic. (The full report has an interactive version of the chart.)
But duplicating the budgetary performance, deficit-wise, of fiscal 2019 is not a positive accomplishment. As CBO reported earlier: “In fiscal year 2019, which ended on September 30, the federal budget deficit totaled $984 billion — $205 billion more than the shortfall recorded in 2018. The deficit increased to 4.6 percent of the nation’s gross domestic product (GDP) in 2019, up from 3.8 percent in 2018 and 3.5 percent in 2017. As a result, federal debt held by the public rose to 79.2 percent of GDP, up from 77.4 percent at the end of fiscal year 2018.” (emphasis added)
The Kansas budget is volatile, with rising spending and a large deficit.
Figures from Kansas financial reports show that state spending has risen. Based on that and shifts in revenue flows, deficits are large.
The following tables and charts show actual data through fiscal year 2019. Figures for 2020 are revised estimates, and for 2021, the figures are from the approved budget. The primary source of data is Kansas Comparison Report: The FY 2021 Governor’s Budget Report with Legislative Authorizations.1
The revised estimate of receipts is $826.9 million less than the estimate from November 2019. The revision takes into account estimates of the effect of the pandemic, while the November estimate was made before the coronavirus was known, at least in the United States.
A large reason for the reduction in estimates of receipts is a change in tax due date: “The individual income tax estimate was decreased by $620.0 million in FY 2020 based on the deferment of $560.0 million in tax year 2019 balance dues and estimated payments that now will not be paid until July 15, 2020.” That effect was noticed in July, when individual income tax receipts were $395.3 million higher than in July 2019. 2
Because of the deferral of so much tax revenue from fiscal years 2020 to 2021, receipts in 2021 are forecast to rise by 5.9 percent.
In the following table, spending increases from the general fund average 4.0 percent per year for 2011 through 2021. For the same period, revenue increases average 3.3 percent.
The deficit of revenue compared to spending in 2020 is slightly over one billion dollars. The state issued a certificate of indebtedness of $900.0 million to compensate. This is a loan that must be repaid by the end of fiscal 2021, which is June 30, 2021.
A government watchdog says the procedures for acquiring the southern border wall are inadequate, and the ability to maintain complete operational control is diminished.
A report by the Office of Inspector General of the Department of Homeland Security finds that U.S. Customs and Border Protection found the procedures for procuring the southern border wall inadequate for the task.
Specifically, the IG found that CBP did not attempt to identify “the most effective, appropriate, and affordable solutions to obtain operational control of the southern border as directed.” Instead, the IG described the methods as “outdated.”
The report found other deficiencies and concluded: “the likelihood that CBP will be able to obtain and maintain complete operational control of the southern border with mission-effective, appropriate, and affordable solutions is diminished.”
The report is dated July 14, 2020 with the title “CBP Has Not Demonstrated Acquisition Capabilities Needed to Secure the Southern Border.” It is report number OIG-20-52 and is available here.
The executive summary is this:
U.S. Customs and Border Protection has not demonstrated the acquisition capabilities needed to effectively execute the Analyze/Select Phase of the Wall Acquisition Program. Specifically, CBP did not conduct an Analysis of Alternatives to assess and select the most effective, appropriate, and affordable solutions to obtain operational control of the southern border as directed, but instead relied on prior, outdated border solutions to identify materiel alternatives for meeting its mission requirement. CBP did not use a sound, well-documented methodology to identify and prioritize investments in areas along the border that would best benefit from physical barriers. Additionally, the Department did not complete the required plan to execute the strategy to obtain and maintain control of the southern border, as required by its Comprehensive Southern Border Security Study and Strategy. Without an Analysis of Alternatives, a documented and reliable prioritization process, or a plan, the likelihood that CBP will be able to obtain and maintain complete operational control of the southern border with mission-effective, appropriate, and affordable solutions is diminished. We made three recommendations to improve CBP’s ongoing investments for obtaining operational control of the southern border. DHS concurred with recommendation 2 but did not concur with recommendations 1 and 3.
An interactive visualization of federal government revenue and spending from 1962 to the present.
This data comes from the Congressional Budget Office Budget and Economic Data page. While CBO often makes projections of the future and those projections may be controversial, the data in this visualization is historical.
CBO presents this data in current dollars and as a percent of gross domestic product, or GDP. When current dollars are adjusted to account for inflation, the result is “real dollars.” In this visualization, I have used the CPI to convert current dollars to the value of dollars in 2019.
CBO also presents data as a percentage of gross domestic product. This is a measure of the portion of our national income that is spent as outlays or taxed as revenue.
Click here to learn more about the data and access this visualization.
When the Wichita city council delegates spending to outside agencies such as Visit Wichita, it should insist on the same transparency requirements the city itself faces.
The Kansas Open Records Act is designed to give citizens access to data concerning their government. In the words of the Kansas Attorney General, “An open and transparent government is essential to the democratic process.”
The preamble to the Kansas act states, “It is declared to be the public policy of the state that public records shall be open for inspection by any person unless otherwise provided by this act, and this act shall be liberally construed and applied to promote such policy.” (emphasis added)
That isn’t always the case in Wichita. Here, the city has formed several non-profit organizations that are funded in large part by tax revenue. But these organizations believe they are not covered by KORA, and so far the city agrees with that.
An example is Visit Wichita, the city’s convention and visitors bureau. This week the Wichita City Council will consider the scope of services and budget for the money the agency receives from Wichita’s Tourism Business Improvement District. This is a tax of 2.75 percent that is added to hotel bills in the city. From 2016 to 2018 this tax brought in an average of just over three million dollars per year.
If the city itself was spending these funds, there is no doubt that the spending records would be public. But Visit Wichita wants to spend this money in secret. It also wants to enter into contracts in secret.
In the Kansas law, here is the definition of a public agency: “‘Public agency’ means the state or any political or taxing subdivision of the state or any office, agency or instrumentality thereof, or any other entity receiving or expending and supported in whole or in part by the public funds appropriated by the state or by public funds of any political or taxing subdivision of the state.” There is an exception, which doesn’t apply here: “‘Public agency’ shall not include: … Any entity solely by reason of payment from public funds for property, goods or services of such entity.”
As can be seen in the nearby table, Visit Wichita gets around 93 percent of its funds from taxes. Surely this qualifies as “supported in whole or in part by the public funds.”
In the past, agencies have objected to the release of records on the basis that they would reveal information or strategies that would benefit Wichita’s competitors for jobs, conventions, and tourists. But the requests I have made (and which were rejected) asked for past data, not contemporaneous data. Further, if Wichita was successful in attracting jobs, conventions, and tourists, this might make some sense. But Wichita lags in these categories, which means that oversight is important. For example, among large hotel markets in Kansas, Wichita is near the bottom in growth.
The records that Visit Wichita needs to disclose are its spending records, which means the checks it has written and credit card charges made. It also needs to disclose its contracts. This is the law, and it is also good public policy.
When my records requests were rejected, I asked the Sedgwick County District Attorney to enforce the law. The DA sided with Visit Wichita (then known as Go Wichita) and the city’s other non-profit agencies, concluding that they were not “public agencies.”
That determination simply meant that Visit Wichita could not be forced to reveal records. But it does not prohibit the agency from supplying records — if it wanted.
This issue is important so that people can trust their government. But leadership in Wichita has not agreed. Now, as Wichita considers large public investments in facilities like a convention center — something desired by Visit Wichita — we need transparency, not secrecy.
Wichita Mayor Brandon Whipple campaigned on greater government transparency. An amendment to the city’s recommended action could require that Visit Wichita recognize itself for what it is — a public agency as defined in the Kansas Open Records Act. Proposing a motion to include this requirement would allow the mayor to fulfill a campaign promise, and it would let Wichitans know where council members stand on this issue.
While government spending rises, private domestic investment declines.
Recent data on the American economy shows that private investment is in a slump, while government contributions to GDP are rising. Even before the release of the figures for the fourth quarter of 2019, this trend was noticed.
In October, the Wall Street Journal reported: “What is driving the U.S. expansion? Consumers and government spending, according to a close look at Wednesday’s report on third-quarter economic output. A Trump administration priority — business investment — is lagging behind, while trade, another priority, is producing mixed results.” 1
Real gross private domestic investment. Click for larger.The Journal article notes the spending boost during the Trump administration: “Mr. Trump has twice reached agreements with Congress to boost spending beyond budget caps enacted during the Obama years, adding to the fiscal stimulus that was applied with tax cuts.”
Then, the same article notes the trend in business investment: “Corporate tax rate reductions were meant to spur business investment, but that isn’t happening. Business investment has expanded at a 4.2% annual rate since Mr. Trump’s election, a slowdown from the 5.2% annual rate that prevailed before it.” Data since the publication of this article shows business investment in what can only be described as a recession.
The interactive visualization I’ve created shows gross domestic product by major sector: Personal consumption, gross private domestic investment, next exports of goods and services, and government. It is easy to see the decline in private investment and the rise in government.