Tag: Featured
-

From Pachyderm: David Kensinger
From the Wichita Pachyderm Club: David Kensinger, President of Kensinger and Associates. His topic was “The Early Returns of the 2020 Presidential Election.”
-
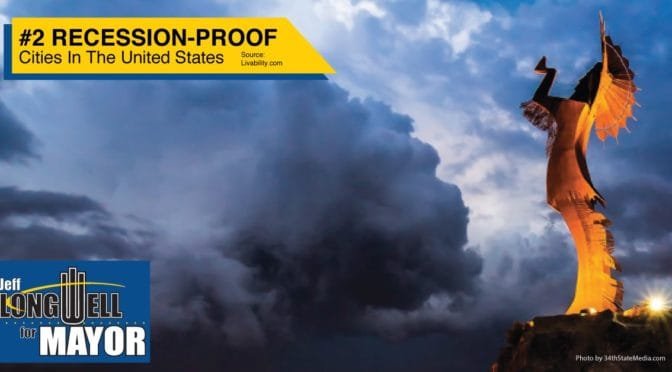
Campaigning on Wichita as recession-proof
The City of Wichita and Mayor Jeff Longwell shouldn’t be using flimsy evidence that is contrary to actual economic data.
-
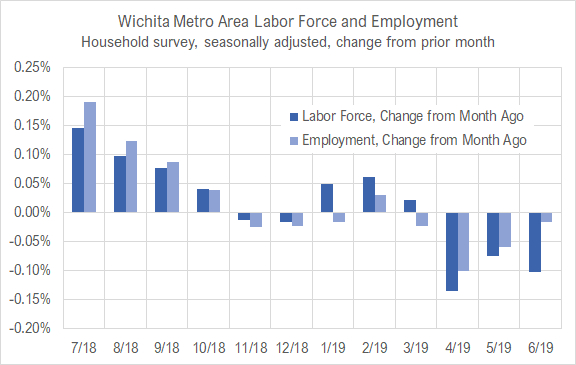
Wichita jobs and employment, June 2019
For the Wichita metropolitan area in May 2019, the labor force is up, the number of unemployed persons is up, the unemployment rate is unchanged, and the number of people working is up when compared to the same month one year ago. Seasonal data shows declines in labor force and jobs from April.
-
Can’t we have a literate mayor?
Mistakes on Wichita Mayor Jeff Longwell’s Facebook campaign page are troubling.
-
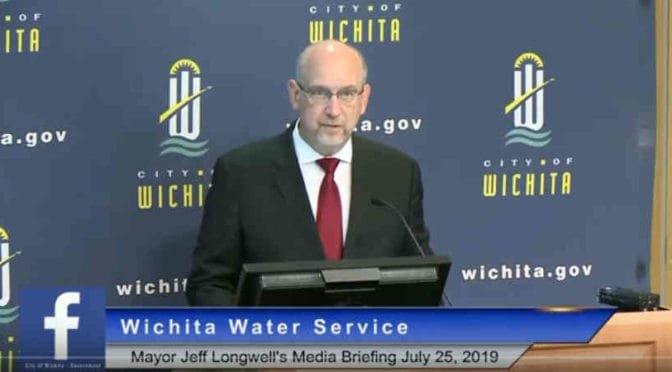
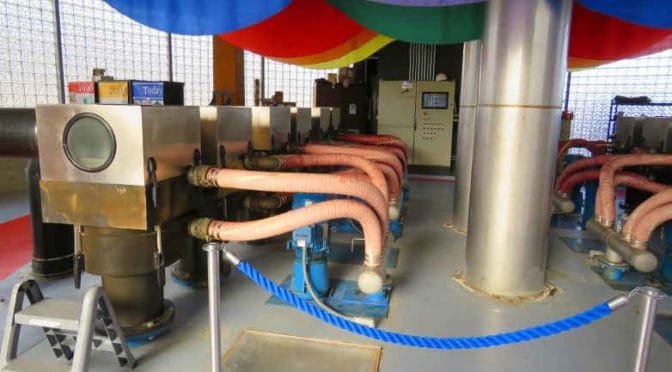
On Wichita water, Longwell is right about one thing
A city hall news event sought to counter a news story that highlighted problems with Wichita’s water supply, but it seemed more like a political campaign event.
-
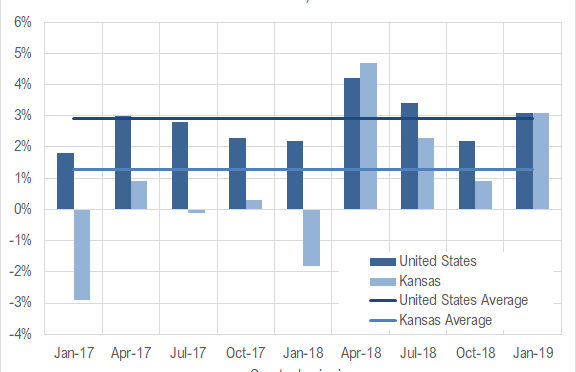
Kansas GDP
In the first quarter of 2019, the Kansas economy grew at the annual rate of 3.1 percent, up from 0.9 percent the previous quarter.
-
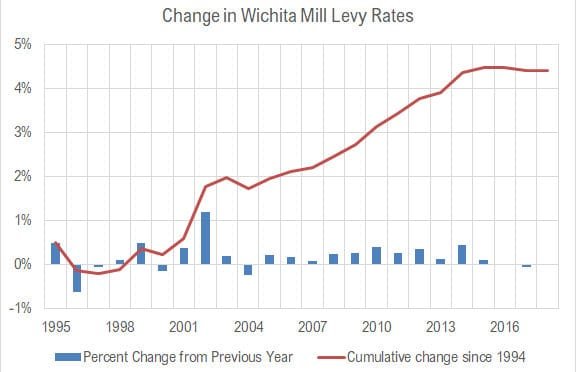
Wichita property tax rate: Unchanged
The City of Wichita property tax mill levy was unchanged for 2018.
-

In Wichita, revision of water history
In 2014 Wichita voters rejected a sales tax which would have provided $250 million to spend on a water project. What were the city’s concerns?
-
In Wichita, here’s what tax decrement means
New research explains what you may have wondered: What is tax “decrement” financing?
-

Kansas jobs, June 2019
Employment and the labor force in Kansas fell slightly in June 2019, and continued a trend of mostly slower growth than the nation over the year.
-
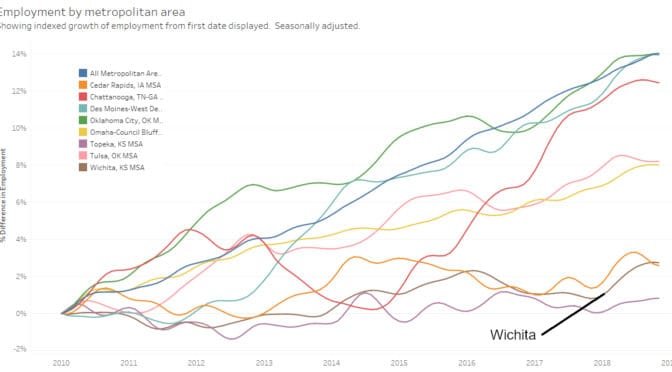
Metropolitan employment and labor force
A visualization of employment, labor force, and unemployment rate for metropolitan areas, now with data through May 2019.
-

Wichita transit, by the numbers
Transit in Wichita isn’t working very well, and it is expensive.