Tag: Featured
-

For Wichita, another agenda surprise
Wichita city hall again places a controversial matter on the consent agenda, where it might pass without notice.
-
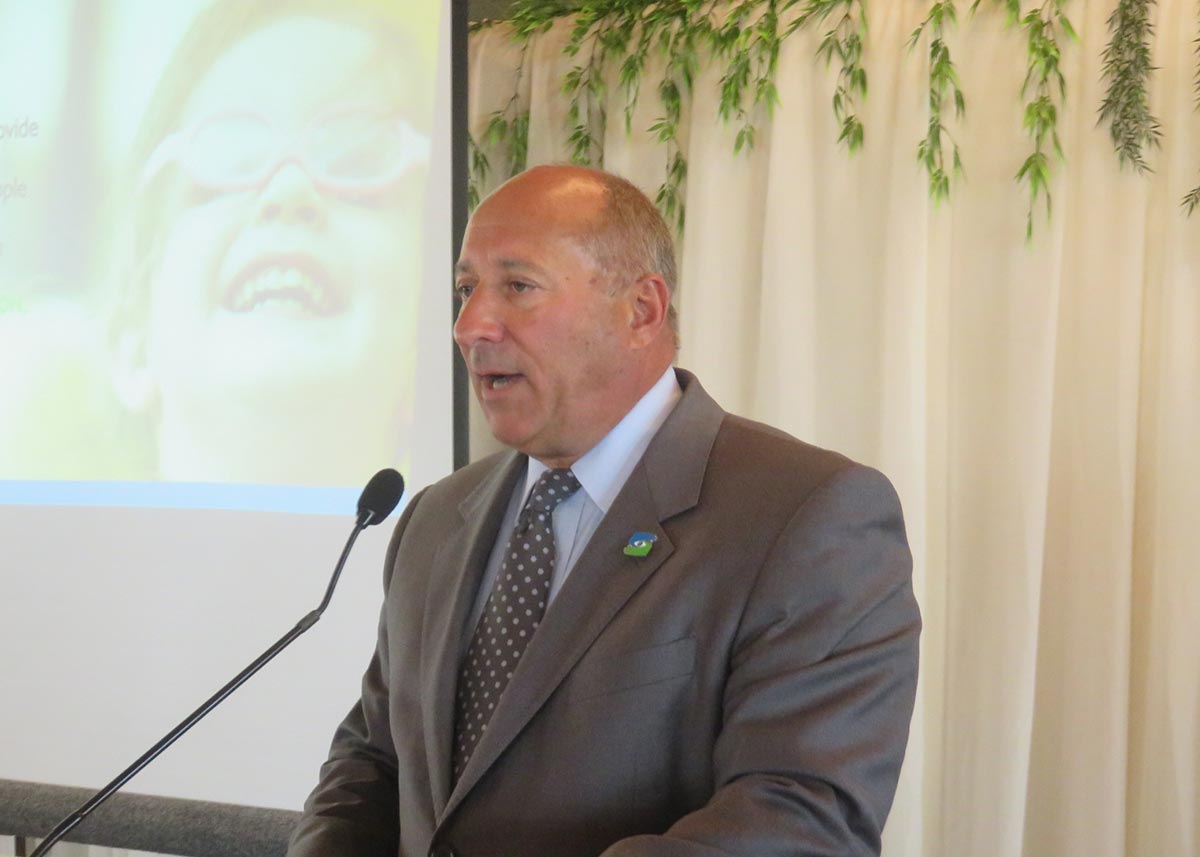
From Pachyderm: Envision and the Wichita Chamber of Commerce
From the Wichita Pachyderm Club this week: Michael Monteferrante. He is President and CEO of Envision, Inc. and Chairman of the Wichita Regional Chamber of Commerce. This audio presentation or podcast was recorded on September 6, 2019.
-
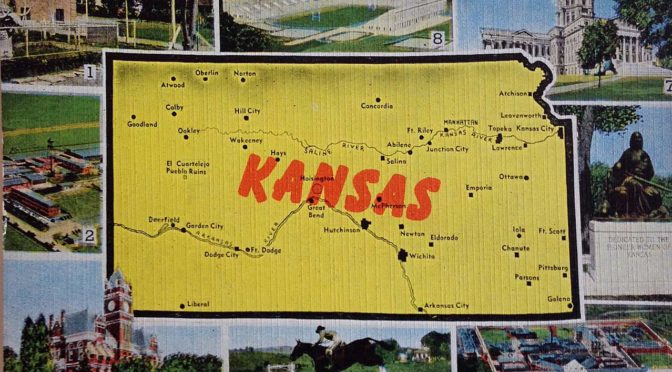
Kansas Republicans should have their say
Kansas Republicans should insist on having a voice in choosing the next Republican presidential nominee.
-
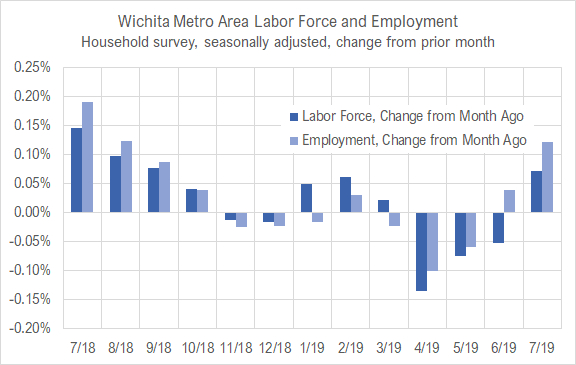
Wichita jobs and employment, July 2019
For the Wichita metropolitan area in July 2019, the labor force is up, the number of unemployed persons is down, the unemployment rate is down, and the number of people working is up when compared to the same month one year ago. Seasonal data shows small increases in labor force and jobs from June.
-

From Pachyderm: United States Representative Ron Estes
From the Wichita Pachyderm Club this week: United States Representative Ron Estes. This audio presentation or podcast was recorded on August 23, 2019.
-

From the New Symposium Society: Capitalism and Socialism
The New Symposium Society held a public forum on the topic “Capitalism and Socialism” on August 20, 2019. Audio is below.
-

Wichita checkbook updated
Wichita spending data presented as a summary, and as a list.
-
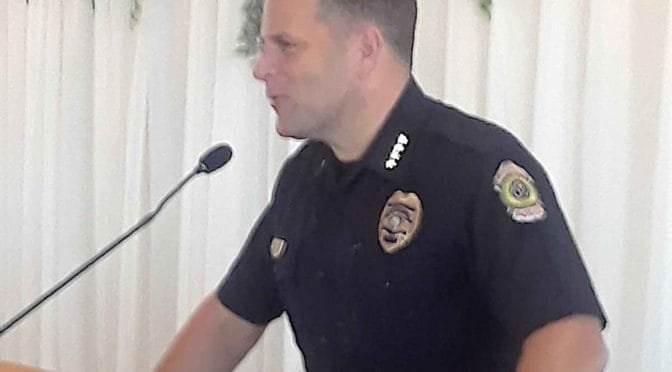
From Pachyderm: Chief Gordon Ramsay
From the Wichita Pachyderm Club: Wichita Police Chief Gordon Ramsay
-
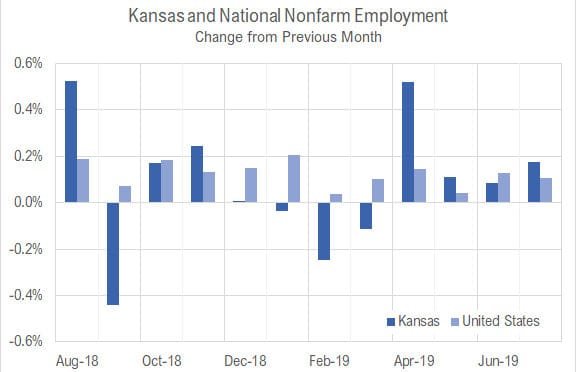
Kansas jobs, July 2019
Employment rose and the labor force in Kansas fell slightly in July 2019 compared to the two previous months, and employment continued a trend of lower growth than the nation over the year.
-

Kansas spending rising
Kansas spending is rising, and will probably rise at a faster pace.
-

Wichita mayoral primary election, August 6, 2019
Here are an interactive map and table of results of the Wichita mayoral primary election, August 6, 2019.
-
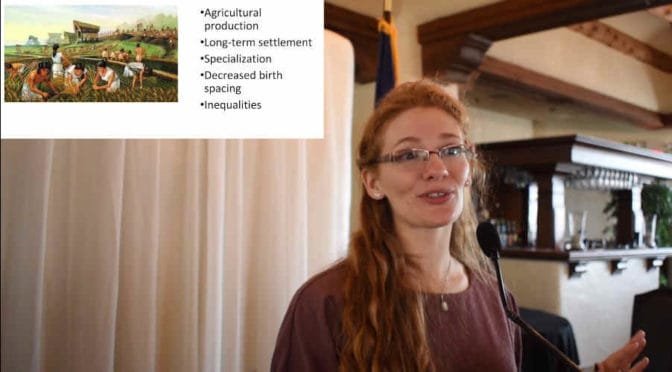
35,000 years of economic history in 35 minutes
Crystal Dozier, Ph.D., Assistant Professor, Department of Anthropology at Wichita State University, explains 35,000 years of economic history in 35 Minutes.