In 2019, the Kansas economy grew at the annual rate of 0.9 percent, down from 2.1 percent the previous year, and ranked forty-fifth among the states.
In the fourth quarter of 2019, the Kansas economy grew at the annual rate of 2.1 percent in real (inflation-adjusted) dollars, according to statistics released today by Bureau of Economic Analysis, a division of the United States Department of Commerce. GDP for the quarter was at the annual rate of $175,703 million. (Click charts and tables for larger versions.)
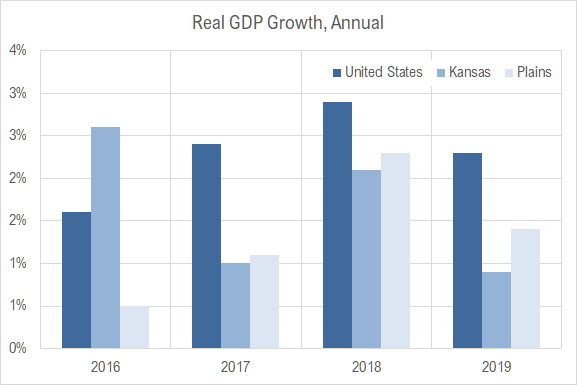
The Kansas rate of 2.1 percent ranked twenty-seventh among the states and was the same as the national rate. The Plains states grew at a rate of 1.7 percent. (For this data, BEA defines Plains states as Iowa, Kansas, Minnesota, Missouri, Nebraska, North Dakota, and South Dakota.)
Over the last twelve quarters, Kansas has averaged quarterly growth rates of 1.1 percent in annual terms. For the nation, the rate was 2.4 percent. For the Plains states, it was 1.4 percent.
For the full year of 2019, the Kansas economy grew at the rate of 0.9 percent, which ranked forty-fifth among the states. The nation grew at 2.3 percent, and Plains states at 1.4 percent. A nearby chart shows annual values.
For Kansas, these industries contributed to Kansas GDP at rates higher than the national rate:
Utilities
Durable goods manufacturing
Management of companies and enterprises
Administrative and support and waste management and remediation services
Other services (except government and government enterprises)
Using seasonally adjusted data, from January 2020 to February 2020, nonfarm employment in Kansas rose by 1,600 (0.1 percent). Over the year, the number of Kansas nonfarm jobs for February 2020 rose by 14,700 (1.0 percent) over last February. This is using seasonally adjusted data. The non-adjusted figure is lower at 11,900 (0.8 percent).
Over the year (February 2019 to February 2020), the Kansas labor force is up by 14,697 (1.0 percent) using seasonally adjusted data, with an increase of 2,573 (0.2 percent) over the last month. Non-seasonal data shows an increase of 20,491 (1.4 percent) in the labor force over the year.
The number of unemployed persons fell from January 2020 to February 2020 by 57 (0.1 percent). The unemployment rate was 3.1 percent in February, down 0.2 percentage points from one year ago, and unchanged from January.
Comparing Kansas to the nation: Using seasonal data, Kansas nonfarm jobs increased by 1.04 percent over the past 12 months, while national jobs grew by 1.60 percent. Non-seasonal data shows Kansas nonfarm jobs rising by 0.84 percent over the past 12 months, while national jobs grew by 1.56 percent.
A note regarding recent layoffs
This data is for February 2020. Spirit Aerosytems announced layoffs that started January 22, according to news reports. The effect of these layoffs should realized in these statistics. For employment data derived from the Current Employment Statistics (CES) program, also known as the payroll survey or the establishment survey, the estimate is for the pay period that includes the twelfth day of the month. For data from the Current Population Survey, which counts people, the estimate is for the “reference week,” which is usually the week that includes the twelfth day of the month.
The release for February 2020 holds some seasonally adjusted data for manufacturing employment in Kansas as follows (in thousands of jobs):
Feb 2019: 166.6
Dec 2019: 167.0
Jan 2020: 168.8
Feb 2020: 168.4
Click charts and tables for larger versions.
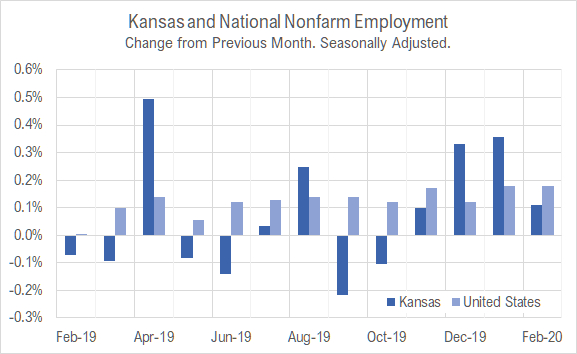
In the following chart of showing job changes from the same month one year ago, Kansas is always below the national rate. The recent trend shows Kansas doing better, with the change growing.
In the following chart showing job changes from the previous month, Kansas has outperformed the nation in some months and has exceeded the national rate in two of the past three months.
For Kansas, personal income in 2019 was $155,724, up from $149,859 in 2018. (These are current dollars, not adjusted for inflation.) This increase of 3.9 percent put Kansas at the rank of 31 among the states. With a reported population of 2,913,000 (Census Bureau midyear population estimates available as of December 2019), per capita personal income was $53,453, which ranks at number 24 among the states.
For the nation, personal income rose by 4.4 percent from 2018 to 2019. For Plains states the increase was 4.1 percent. (For this data, Plains States are Iowa, Kansas, Minnesota, Missouri, Nebraska, North Dakota, and South Dakota.)
Personal income in the fourth quarter of 2019 was $158,032 million, an increase of 2.9 percent from the third quarter. That ranked twenty-ninth among the states. For the nation, the increase was 3.0 percent. (These values, while considering one quarter, are expressed as an annual rate, and are adjusted for seasonality.) For Plains states, the increase was 2.8 percent. The fourth quarter of the calendar year consists of October, November, and December.
A nearby table shows the contributions of earnings to percent change in personal income by industry. In Kansas, the industries that contributed the most were Health care and social assistance, State and local government, Construction, Management of companies and enterprises, and Transportation and warehousing. Utilities and Nondurable goods manufacturing experienced small reductions.
Click for larger.
According to BEA, “Personal income is the income received by, or on behalf of, all persons from all sources: from participation as laborers in production, from owning a home or business, from the ownership of financial assets, and from government and business in the form of transfers. It includes income from domestic sources as well as the rest of world. It does not include realized or unrealized capital gains or losses.”
Also from BEA: “Earnings by place of work is the sum of wages and salaries, supplements to wages and salaries, and proprietors’ income. BEA’s industry estimates are presented on an earnings by place of work basis.”
For the Wichita metropolitan area in January 2020, the labor force is up, the number of unemployed persons is down, the unemployment rate is down, and the number of people working is up when compared to the same month one year ago. Seasonal data shows increases in labor force and jobs from December.
Total nonfarm employment rose from 299,400 last January to 303,100 this January 2020. That’s an increase of 3,700 jobs (1.2 percent). (This data is not seasonally adjusted, so month-to-month comparisons are not valid.) For the same period, employment in the nation grew by 1.5 percent. The unemployment rate in January 2020 was 3.7 percent, down from 3.9 percent one year ago.
Considering seasonally adjusted data from the household survey, the labor force rose by 1,149 persons (0.4 percent) in January 2020 from December 2019, the number of unemployed persons rose by 79 (0.7 percent), and the unemployment rate was 3.4 percent, unchanged from December. The number of employed persons not working on farms rose to 302,522 in January from 301,452 the prior month, an increase of 1,070 persons (0.4 percent).
The following chart of the monthly change in labor force and employment shows the positive trend in employment and labor force over the last nine months.
The following chart of changes from the same month one year ago shows a decline in the rate of growth of both employment and labor force considering the entire year, but with growth returning the past five or six months.
The following chart of changes in employment from the same month of the previous year shows months when the Wichita MSA performed better than the nation. Over the past 12 months, the average monthly job growth for the nation was 1.38 percent, and for the Wichita MSA, 1.80 percent.
The following two charts show changes in jobs for Wichita and the nation over longer periods. The change is calculated from the same month of the previous year. For times when the Wichita line was above the nation, Wichita was growing faster than the nation. This was often the case during the decades starting in 1990 and 2000. Since 2010, however, Wichita has rarely outperformed the nation and sometimes has been far below the nation.
A note regarding recent layoffs
This data is for January 2020. Spirit Aerosytems announced layoffs that started January 22, according to news reports. The effect of these layoffs is probably not realized in these statistics. For employment data derived from the Current Employment Statistics (CES) program, also known as the payroll survey or the establishment survey, the estimate is for the pay period that includes the twelfth day of the month. For data from the Current Population Survey, which counts people, the estimate is for the “reference week,” which is usually the week that includes the twelfth day of the month.
Employment and the labor force rose in Kansas in January 2020 compared to the prior month. Kansas outperformed the nation in job growth the past two months.
Using seasonally adjusted data, from December 2019 to January 2020, nonfarm employment in Kansas rose by 2,900 (0.2 percent). Over the year, the number of Kansas nonfarm jobs for January 2020 rose by 9,900 (0.7 percent) over last January. This is using seasonally adjusted data. The non-adjusted figure is higher at 12,100 (0.9 percent).
Over the year (January 2019 to January 2020), the Kansas labor force is up by 12,015 (0.8 percent) using seasonally adjusted data, with an increase of 0.1 percent over the last month. Non-seasonal data shows an increase of 13,591 (0.9 percent) in the labor force over the year.
The number of unemployed persons fell from December 2019 to January 2020 by 173 (0.4 percent). The unemployment rate was 3.1 percent in January, down 0.2 percentage points from one year ago, and unchanged from December.
Comparing Kansas to the nation: Using seasonal data, Kansas nonfarm jobs increased by 0.70 percent over the past 12 months, while national jobs grew by 1.42 percent. Non-seasonal data shows Kansas nonfarm jobs rising by 0.86 percent over the past 12 months, while national jobs grew by 1.51 percent.
A note regarding recent layoffs
This data is for January 2020. Spirit Aerosytems announced layoffs that started January 22, according to news reports. The effect of these layoffs is probably not realized in these statistics, because the data was gathered before the effective date of the layoffs. For employment data derived from the Current Employment Statistics (CES) program, also known as the payroll survey or the establishment survey, the estimate is for the pay period that includes the twelfth day of the month. For data from the Current Population Survey, which counts people, the estimate is for the “reference week,” which is usually the week that includes the twelfth day of the month.
Click charts and tables for larger versions.
In the following chart of showing job changes from the same month one year ago, Kansas is always below the national rate. The recent trend shows Kansas doing better, with the change growing.
In the following chart showing job changes from the previous month, Kansas has outperformed the nation in some months and has exceeded the national rate the past two months.
A report on the economic impact of the first ten years of operation of the Intrust Bank Arena in downtown Wichita incorrectly reported tax revenue.
Recently Intrust Bank Arena in downtown Wichita promoted the results of an analysis of the economic impact of the arena through its first ten years of operation. 1 The arena partnered with the Center for Economic Development and Business Research at Wichita State University to conduct the study. 2
In all, the report claims $2.7 million over ten years in Sedgwick County guest tax revenue paid by out-of-town arena visitors who stayed in local hotels. But while the county has a guest tax, it does not raise nearly the dollars shown in the report.
The transient guest tax, sometimes called a guest tax or bed tax, is a tax on a hotel bill. It is collected in addition to retail sales tax. In the City of Wichita, hotel guests pay 7.5 percent retail sales tax, an additional six percent guest tax, and an additional 2.75 percent city tourism fee. If the hotel is located within a Community Improvement District, an additional tax of up to two percent is collected.
The guest tax for Sedgwick County was last revised in 2006. 3 The rate is five percent. The ordinance says that the tax “… shall be levied in the unincorporated area of Sedgwick County, Kansas …”
The term unincorporated area is key, meaning the portions of the county that are not within an incorporated town or city. Reports from the Kansas Department of Revenue show there is just one establishment in Sedgwick County that files a guest tax report. 4 For comparison, 108 establishments in the City of Wichita file guest tax reports. These are located in the city limits and are not in the unincorporated area of the county, and therefore not subject to the county guest tax.
How much does Sedgwick County collect in guest tax? The reports from the Kansas Department of Revenue don’t say. The value is suppressed to protect confidentiality, given that there is just one filing establishment in the unincorporated area of the county.
We do know, according to the economic impact report, that the one hotel in unincorporated Sedgwick County collects $351,656 per year in guest tax (annualized over the period 2015 to 2019.) Since the guest tax rate is five percent, that implies $7 million in annual sales, which would be collected by a hotel selling 191 rooms per day at a rate of $100 per day, 365 days per year.
Is there such a hotel in unincorporated Sedgwick County? It’s unlikely. Consider this one hotel with $351,656 in guest tax collections by arena visitors compared to the $421,987 reported for all hotels in the City of Wichita, again for arena visitors. (The Wichita guest tax rate is slightly higher at six percent, so the comparison is not strictly equal.)
Remember: According to the analysis, this level of activity is generated just by visitors attending events at Intrust Bank Arena.
I think it’s safe to say there is a mistake. Correspondence with CEDBR, the organization that prepared the analysis, confirms that county guest tax was incorrectly estimated, and a new version reports $0 in county guest tax. 5 CEDBR says no numbers were changed other than the county guest tax and totals that included it.
While it is unfortunate that CEDBR made this mistake, the use of the analysis by downstream consumers teaches us something about economic development, the data supporting it, and its practitioners.
As an example, the management of Intrust Bank Arena issued a press release touting the analysis and its findings. Regarding tax collections, the announcement reports, “The fiscal impact of visitors to the area for INTRUST Bank Arena events that occurred in 2010-2019 was approximately $12 million in tax revenue generated.”
What’s interesting is that the release cites only the retail sales tax revenue. It omits the guest tax revenue, which is — according to the analysis that was available at the time of the press release — about $6 million. That’s half as much as the retail sales tax, but it was not included in a press release touting economic impact.
An excerpt from the first page of the CEDBR analysis. Click for larger.
Why didn’t the arena use the guest tax collections, thereby reporting $18 million in tax revenue collected from visitors rather than $12 million? It wasn’t due to concern over the accuracy of the guest tax collections, as arena management told me they were not aware of CEDBR’s error. But because the press release did not mention the erroneous guest tax, arena management says there is no need to correct the press release. This is correct, and it reveals the mistake in not including guest tax revenue.
Adding to our learning about the use of data in economic development is this: Of the sales tax collected by hotels in Wichita, about 87 percent belongs to the State of Kansas, with the remainder shared by Wichita and Sedgwick County. For guest tax, however, all is returned to the city, except for a small administrative fee of two percent. So of the $12 million in retail sales tax revenue promoted by arena management, about $1.5 million was shared by the city and county. 6 For the purported $6 million in guest tax revenue, all went to the city and county, except for the administrative fee.
We also learn about the diligence of Sedgwick County Commissioner Pete Meitzner (district 1) in examining this data. He is quoted in the arena’s press release. But it’s quite easy to see that the analysis erroneously reports county guest tax revenue.
Besides this mistake, there are other areas of concern regarding this analysis of the economic impact of the arena. One is that this report mentions revenue but not costs. 7
The second is that before Intrust Bank Arena opened in downtown, the county owned another arena. That former arena generated economic activity and economic impact, too, including NCAA men’s basketball tournament games. A thorough analysis should look at the marginal activity created by the new arena.
Sedgwick County. A charter resolution exempting Sedgwick County, Kansas, from the provisions of k.S.A. 12-1692, 12-1693, 12-1694, 12-1694a, 12-1695, and providing substitute and additional provisions on the same subject relating to the levy of a transient guest tax in the unincorporated area of Sedgwick County and providing for purposes of expenditure of such funds; and repealing charter resolution #32. Available at https://library.municode.com/ks/sedgwick_county/codes/code_of_ordinances?nodeId=SECOKACO_APXACHRE_NO._59. ↩
Specifically, the analysis reports $983,449 in sales tax to the city and $703,714 to the county, for a total of $1,687,163. ↩
It’s common for officials to talk as though there is no cost or expense in owning the arena, because a sales tax was used to pre-fund the arena. After the funds were in place, the arena was built. But, see Weeks, Bob. The finances of Intrust Bank Arena in Wichita. Available at https://wichitaliberty.org/sedgwick-county-government/the-finances-of-intrust-bank-arena-in-wichita/. For annual expenses, in a presentation to Sedgwick County Commissioners in February, county staff reported $1,991,471.99 in expenses charged to the arena’s reserve fund. This was offset by $722,933.65 in revenue, mostly from a revenue-sharing agreement with the arena’s operator and from the sale of naming rights. The declining balance in the arena’s reserve fund led Commissioner David Dennis to wonder if a special tax district could be established to provide more revenue to cover these expenses. See https://drive.google.com/file/d/1UbAfjQaIWQOzrYzIWqKdBIbrqFMDlfX-/view↩
Kansas school employment rose for the current school year.
Figures released by the Kansas State Department of Education show the number of teachers and certified employees rose for the 2019-2020 school year.
The number of Pre-K through grade 12 teachers rose to 31,337 from 31,153, an increase of 0.59 percent. Certified employees rose to 43,305 from 42,861, or by 1.04 percent. 1 These are not the only employees of school districts. 2
Enrollment rose from 476,482 to 477,032, or 0.12 percent. As a result, the ratio of teachers to students was unchanged (measured to two decimal places), and the ratio of certified employees to students fell.
The relative change in enrollment and employment is not the same in every district. To help Kansas learn about employment trends in individual school districts, I’ve gathered the numbers from the Kansas State Department of Education and present them in an interactive visualization. Click here to use it.
According to KSDE, certified employees include Superintendent, Assoc./Asst. Superintendents, Administrative Assistants, Principals, Assistant Principals, Directors/Supervisors Spec. Ed., Directors/Supervisors of Health, Directors/Supervisors Career/Tech Ed, Instructional Coordinators/Supervisors, All Other Directors/Supervisors, Other Curriculum Specialists, Practical Arts/Career/Tech Ed Teachers, Special Ed. Teachers, Prekindergarten Teachers, Kindergarten Teachers, All Other Teachers, Library Media Specialists, School Counselors, Clinical or School Psychologists, Nurses (RN or NP only), Speech Pathologists, Audiologists, School Social Work Services, and Reading Specialists/Teachers. Teachers include Practical Arts/Vocational Education Teachers, Special Education Teachers, Pre-Kindergarten Teachers, Kindergarten Teachers, Other Teachers, and Reading Specialists/Teachers. See Kansas State Department of Education. Certified Personnel.http://www.ksde.org/Portals/0/School%20Finance/reports_and_publications/Personnel/Certified%20Personnel%20Cover_State%20Totals.pdf. ↩
There are also, according to KSDE, non-certified employees, which are Assistant Superintendents, Business Managers, Business Directors/Coordinators/Supervisors, Other Business Personnel, Maintenance and Operation Directors/Coordinators/Supervisors, Other Maintenance and Operation Personnel, Food Service Directors/Coordinators/Supervisors, Other Food Service Personnel, Transportation Directors/Coordinators/Supervisors, Other Transportation Personnel, Technology Director, Other Technology Personnel, Other Directors/Coordinators/Supervisors, Attendance Services Staff, Library Media Aides, LPN Nurses, Security Officers, Social Services Staff, Regular Education Teacher Aides, Coaching Assistant, Central Administration Clerical Staff, School Administration Clerical Staff, Student Services Clerical Staff, Special Education Paraprofessionals, Parents as Teachers, School Resource Officer, and Others. See Kansas State Department of Education. Non-Certified Personnel Report.http://www.ksde.org/Portals/0/School%20Finance/reports_and_publications/Personnel/NonCertPer%20Cov_St%20Totals.pdf. ↩
Kansas tax receipts by category, presented in an interactive visualization. Now with data through December 2019.
The Kansas Division of the Budget publishes monthly statistics regarding tax collections. I’ve gathered these and present them in an interactive visualization.
In the nearby example from the visualization, we can see the rising trend in individual income taxes, due to the a increase passed by the Kansas Legislature.
Click here to learn more and access the visualization.
The City of Wichita plans to expand a special tax district.
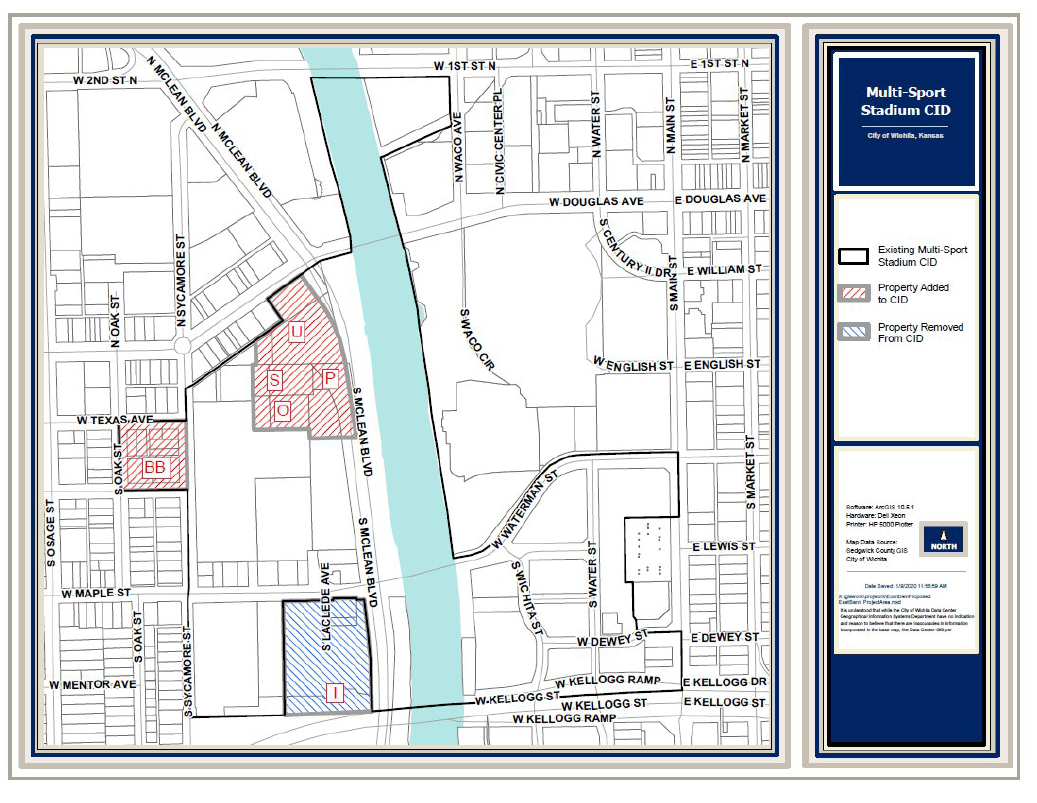
Next week the Wichita City Council will consider expanding an existing CID, or Community Improvement District, in the Delano neighborhood near downtown Wichita. A map provided by the city is nearby.
Community Improvement Districts are a mechanism whereby extra sales tax is collected within a district. For this CID, the city asks to collect an extra two cents per dollar, which is the maximum allowed in Kansas.
CIDs are distinguished from STAR bonds, in which incremental sales tax revenue in a district is captured and handled differently from the base sales tax. The sales tax rate remains as before. The ballpark and surrounding area use both CID and STAR bonds, as well as other public funding.
In its analysis appearing in the agenda packet for the February 11, 2020 meeting, the city provides this:
The expanded boundaries will permit the collection of additional CID revenues and the application thereof to development opportunities as well as the design and construction of the Stadium, utilities, parking, and other improvements related to the Stadium and river corridor improvements. The expansion further permits the use of funds to support the construction of public auditoriums and convention centers.
The CID petition included the $83,000,000 stadium project, which includes both the $75,000,000 stadium and $8,000,000 in supporting infrastructure. The amended petition has an estimated project costs of $210,200,000, which includes the additional $127,200,000 in project costs related to the Riverfront Partners project.
Project costs originally included costs related to the development of a multi-sport stadium, related infrastructure and adjacent commercial, retail residential and parking structures. The amendment has been expanded to include public auditoriums and convention centers as well as the additional commercial construction on the Development Site.
In this context, “Development Site” refers to the Riverfront Partners site north of the ballpark, southwest of Douglas and McClean Boulevard.
Of note, the CID includes a portion of the land included in the Riverfront Legacy Master Plan. The city contemplates that CID funds might be used there: “The petition also requests that the uses of CID revenues be expanded to include uses contemplated by the DA to be made on the Development Site, costs for additional parking and costs that may be associated with for potential development on the east side of the Arkansas River that is within the Stadium CID.”
The item the council will consider also includes a correction, as explained by the city: “The petition also requests removal of certain City-owned property that was inadvertently included in the Stadium CID.”
The city plans to borrow funds to be repaid by the CID tax collections: “The City anticipates issuing up to $13,000,000 in bonds, based on a pledge of CID revenue.”
Don’t want to pay? Don’t go there.
Does the use of CID mean the city has raised taxes? Certainly, the sales tax within the CID is higher (9.5 percent) than outside (7.5 percent). But that extra tax can be avoided. It is common for city council members to advise citizens that if they don’t want to pay the higher sales tax, just don’t go there.
On the surface, this reasoning is correct. But as explained in city documents, the city is borrowing money to be repaid by CID tax collections. If enough people take this advice and avoid patronizing merchants within the CID, there may be a shortfall of money to make bond payments. Since the city’s policy is that CID bonds are not backed by the full faith and credit of the city, Wichita as a city is not on the hook. 1 But should this happen and the city defaulted on CID bonds, it would be a severe blow to the city’s reputation.
A similar situation exists for the STAR bonds the city has issued to fund the ballpark and related spending. If the district fails to generate enough incremental sales tax revenue to make bond payments, city taxpayers are not liable. 2 But the failure of these bonds would, again, severely damage the city’s reputation.
Further, the city expects property tax revenue to pay off tax increment financing (TIF) bonds issued in favor of the project.
Even more, the city expects the economic activity generated by the ballpark and surrounding development to spin-off associated economic activity that will generate further tax revenue. If this does not happen, and happen in a big way, the project threatens to be a burden on the city budget, and by extension, taxpayers.
From the agenda for the February 11, 2020 council meeting, showing area to be added and removed from the CID. Click for larger.
—
Notes
City Of Wichita Community Improvement District Policy. “While the CID Act permits the issuance of either full-faith and credit general obligation bonds or special obligation bonds, payable solely from the CID revenue, it is the policy of the City of Wichita to issue only special obligation CID bonds.” ↩
$42,140,000 City Of Wichita, Kansas Sales Tax Special Obligation Revenue Bonds (River District Stadium Star Bond Project) Series 2018. “The series 2018 bonds are not general obligations of the city and neither the full faith and credit nor the general taxing power of the city, the state, or any political subdivision thereof is pledged to the payment of the series 2018 bonds. The series 2018 bonds shall not constitute an indebtedness of the city, the state, or any political subdivision thereof within the meaning of any constitutional or statutory debt limitation or restriction.” ↩