Tag: Education

  • Kansas school standards remain high

    Kansas school standards remain high

    Kansas school assessment standards remain at a high level, compared to other states. This is a welcome change from the past.

    To evaluate the performance of their schools and students, states have their own assessments or tests. Some states have rigorous standards, meaning that to be considered “proficient,” students must perform at a high level.

    But some states are less rigorous. They rate students “proficient” at a much lower level of performance.

    How can we tell which states have high standards, and which states have low standards? There is a test that is the same in all states, the National Assessment of Educational Progress (NAEP). The U.S. Department of Education, through the National Center for Education Statistics (NCES), administers this test every other year. Known as “The Nation’s Report Card,” it is “the largest nationally representative and continuing assessment of what America’s students know and can do in various subject areas.” 1

    By comparing scores on NAEP and a state’s own tests, we can learn about the state’s standards. Does a state have a large percentage of students score “proficient” on its own test, but have a much lower percentage score “proficient” on the NAEP? If so, that state’s standards are weak.

    After NAEP scores are released, Education Next, a project of the Program on Education Policy and Governance at Harvard University, compares state and NAEP results and assigns letter grades to each state. 2

    It’s important to know that this analysis does not tell us how well a state’s students perform on any tests, either state tests or NAEP. Education Next emphasizes:

    To be clear, high proficiency standards do not necessarily reflect high student performance. Rather, good grades suggest that states are setting a high proficiency bar — that students must perform at a high level to be deemed proficient in a given subject at their grade level. Grades gauge “truth in advertising” by indicating the degree to which states inform parents of how well their students are doing on an internationally accepted scale. 3

    Kansas

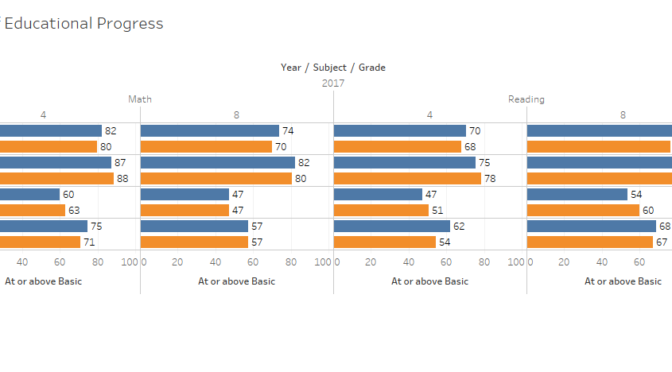
    The good news is that Kansas grades well in the analysis of its state proficiency standards for 2017, earning an overall grade of A (A in grade 4 math, B+ in grade 4 reading, and A in both grade 8 math and reading). This is the sixth highest score among the states and means Kansas assessments have a high degree of “truth in advertising.” These grades are nearly unchanged from 2015.

    This high grade has not always been the case for Kansas, however. In 2013 the state received a grade of D+ and ranked forty-first. That was a little better than 2011, when the grade was D and rank was forth-forth.

    Does this mean Kansas students are doing better on tests? No. NAEP scores are mostly unchanged, or changed very little. Instead, between 2013 and 2015 Kansas adopted more realistic and rigorous standards for its tests. It raised the bar for what students needed to know to be called “proficient.”

    Here is an example of how low a bar Kansas once set: In 2009, 87.2 percent of Kansas students were judged “proficient” on state tests in grade 4 reading. But only 35.1 percent were judged “proficient” on the NAEP. For that year the average difference between “Kansas proficient” and “NAEP proficient” was 45 percentage points.

    Despite this large difference, Kansans were being told the state’s schools are doing very well. In 2012, Kansas Commissioner of Education Diane M. DeBacker wrote this in the pages of The Wichita Eagle: “Kansans are proud of the quality of their public schools, and a steady and continuing increase in student performance over the past decade has given us ample reason for that pride.” (Diane DeBacker: Pride in Kansas public schools is well-placed, March 20, 2012.)

    Bragging like this was common, and it was unfounded. It was a lie, and a harmful lie. Being told our schools are top quality based on state standards, when those standards are very weak, is politically expedient but untruthful, and the case for needed reform is dismissed as unnecessary.


    Notes

    1. National Assessment of Educational Progress. About. Available at nces.ed.gov/nationsreportcard/about/.
    2. “To generate these letter grades, we compare the percentage of students identified as proficient in reading and math on state assessments to the percentage of students so labeled on the more-rigorous NAEP. Administered by the U.S. Department of Education, NAEP is widely considered to have a high bar for proficiency in math and reading. Because representative samples of students in every state take the same set of examinations, NAEP provides a robust common metric for gauging student performance across the nation and for evaluating the strength of state-level measures of proficiency.”
      Education Next. Have States Maintained High Expectations for Student Performance? Available at http://educationnext.org/have-states-maintained-high-expectations-student-performance-analysis-2017-proficiency-standards/.
    3. Education Next. After Common Core, States Set Rigorous Standards. Summer 2016. Available at http://educationnext.org/after-common-core-states-set-rigorous-standards/.
  • What is the real problem at Wichita Southeast?

    What is the real problem at Wichita Southeast?

    There is likely a different explanation for problems at a Wichita high schools from what we’ve been told by the school district and our newspaper.

    Recently the Wichita Eagle editorial board opined about problems with Wichita Southeast High School. That editorial was based on Eagle reporting in the article The new Southeast High is bigger and better. So why is its graduation rate dropping?

    Sociologist Chase Billingham offers commentary and insight in his piece Southeast’s grad rate more about discipline:

    The Wichita school district officials and The Eagle Editorial Board said the slipping graduation rate was partially attributable to the relocation of Southeast from its previous location to a new building at the far eastern edge of Wichita. According to these claims, students needing bus service when they could once walk to school have resulted in declining attendance, which in turn has led to the low graduation rate.

    The falling graduation rate is real, and it is troubling. However, it was not caused by the school’s relocation.

    Billingham proceeds to cite statistics from the Kansas State Department of Education and concludes, “Rather, it is more likely that the school has become more strict in applying formal disciplinary sanctions to student behavioral problems that may previously have resulted in informal reprimands.”

    I wonder if school district officials knew of these statistics. They should have, as those officials compile and report them to KSDE. I also winder if Eagle reporters and editorial writers looked into this.

    (By the way, the Eagle doesn’t disclose the membership of its editorial board.)

    This episode is another troubling revelation about Wichita schools since the departure of the oft-praised and rewarded superintendent John Allison. Today the Eagle editorial board wrote, “Hiring Thompson as superintendent proved to be a good move at a time when Wichita schools were languishing — poor teacher morale, stagnant student achievement results and a district in need of a spark.”

  • Reestablishing a Fundamental Principle of Democracy

    Reestablishing a Fundamental Principle of Democracy

    Reestablishing a Fundamental Principle of Democracy
    Alan Cobb, Kansas Chamber President & CEO

    The words of a recent guest editorial in the Lawrence Journal-World about the Kansas Coalition for Fair Funding were not surprising. It was a continuation of the intellectually shallow, fact-short screed about taxes, school finance, and the Kansas budget. Certainly, reasonable people can disagree about these issues, but partisans rarely adhere to that theorem. And thus, I thought I was reading something from a partisan staffer.

    Alas, it was from a well-respected Wichita State University professor emeritus who I have known for decades.

    I’ve not always agreed with Dr. H. Edward Flentje, but even when I disagreed with him, I found his arguments well-founded and reasonable. Not this time.

    Now to the point. Dr. Flentje, probably intentionally, conflates with the 2012 tax cuts with the current and ongoing school finance litigation. They have absolutely nothing to do with each other. The current litigation was filed around the day the Sam Brownback was elected Governor. To say the focus of the current coalition is part of an effort to maintain those tax cuts is fanciful, to be charitable.

    The 15-word clause in the Kansas State Constitution that is the center of all of this was enacted in 1966. It took only a few years for the first lawsuit to be filed, and Kansas has been in court ever since. This is madness. Brownback was not governor when the original litigation was filed some 30 years ago. The Kansas Legislature developed the current finance formula in the early 1990s under the duress of a Shawnee County District Court judge. Sam Brownback would not be governor for another 18 years. To continue to enact Brownback’s name must mean the author simply can’t argue the merits of the issue we currently face. This is disappointing.

    Last December, the Kansas Chamber Board of Directors approved the following language to be a part of our 2018 Legislative Agenda:

    Support a constitutional amendment for the democratically elected legislature to have exclusive authority to determine funding for schools in an effort to eliminate endless litigation over school funding.

    In my role as President and CEO of the Kansas Chamber, I’ve traveled the state visiting business of all sizes. The consistent refrain I hear from business owners and managers is that the constant litigation has diminished the effectiveness of our educational institutions and their ability to prepare Kansas students for post-secondary careers and post-secondary education.

    In addition, I’ve had multiple conversations with educators, teachers, superintendents, and building principals; many embarrassed about the constant litigation. They know that Kansas courts are the not the place to set our state’s education policy.

    Ultimately this is about the process of how Kansas sets and finances education policy. We are competing not just with our neighboring states, but all 50 states and many countries across the globe. There is a worldwide competition for jobs.

    Because we are in a constant struggle regarding how much Kansas spends on K-12 education, we have not had substantive conversations that we should about the effectiveness and efficacy of our education systems and how we properly prepare Kansas students for their lives after high school.

    Improving our education systems takes place because of conversations between employers, students, parents, educators and those setting education policy: the legislature, the Governor, local boards of education and the State Board of Education.

    These conversations simply cannot take place between all the interested parties mentioned and the state’s judicial branch.

    The Chamber’s board of directors and members across the Kansas business community recognize the importance of a well-educated and trained workforce. But they also desire a competitive business climate. The endless litigation over school funding places the state at risk of being able to a balance of a competitive tax climate and providing for the essential services required outside of the K-12 education system.

    The framers of our national and state constitutions understood that the power to tax and appropriate funds must be placed in the hands of the legislature-the governing body of the people. The Kansas Coalition for Fair Funding supports a constitutional amendment that will reestablish this fundamental principle of democracy and will end the continuous cycle of litigation.

  • Tax benefits for education don’t increase education

    Tax benefits for education don’t increase education

    Here’s evidence of a government program that, undoubtedly, was started with good intentions, but hasn’t produced the intended results.

    Tax season ended last week. Taxpayers have filed for over $30 billion in credits and deductions for college expenses they paid in 2017.

    Evidence now clearly shows that these credits have zero effect on college attendance. The tax credits surely make those who get them better off, but they do nothing to increase education. If their intent is to increase schooling, they are a failure.

    Continue reading at The Brookings Institution article The tax benefits for education don’t increase education.

  • NAEP results for 2017 available in interactive visualizations

    NAEP results for 2017 available in interactive visualizations

    When properly considered, Kansas often underperforms the nation in the most recent assessment of “The Nation’s Report Card.”

    The results for the 2017 administration of the National Assessment of Educational Progress, or NAEP, were recently released. I’ve prepared interactive visualizations of some of the results. To access the visualizations, click on National Assessment of Educational Progress (NAEP).

    When considering NAEP results, it’s important to consider subgroups, such as race/ethnicity and school lunch status, which is a proxy for poverty. It’s important because states vary widely in the composition of subgroups.

    For example, consider an accompanying example from the visualization. We see that when considering all students, Kansas does better than the national average in percent of students performing as basic or better. This is true in all four combinations of grade and subject.

    Looking at black students alone, however, we see that Kansas underperforms the nation, except in one instance where there is a tie.

    For Hispanic students alone, Kansas does better in all instances except for one tie.

    For white students alone, Kansas underperforms the nation in three instances, and outperforms in one.

    This statistical anomaly is known as Simpson’s Paradox. It may appear when comparing subgroups to aggregated data when the proportional composition of subgroups varies between populations, in this case the states. For grade 4 reading, 64 percent of students in Kansas were white. For the nation, it was 49 percent. This is a difference in composition that must not be ignored.

    The relatively low proportion of minority students is why Kansas appears to perform better than the nation. The apparent superior performance of Kansas melts away when looking at subgroups.

    Kansas and the nation, percent at basic or better. Click for larger.
    Kansas and the nation, percent at proficient or better. Click for larger.
  • Kansas and Iowa schools

    Kansas and Iowa schools

    Should Kansas schools aspire to be more like Iowa schools?

    The Kansas Association of School Boards lists Iowa as an “aspirational” state, that is, one that Kansas should consider a role model.

    I’ve gathered some data from both states. The United States Census Bureau collects data from the states as part of its Annual Survey of School System Finances program. 1 Data is available through fiscal year 2015. The National Education Association also gathers data. 2 The following table displays some data from both sources.

    Note that Iowa spends much more than Kansas. Iowa school teacher salaries are higher, although the student-teacher ratio is nearly the same. (Student-teacher ratio is not the same as average class size, but it’s the data that is collected and reported.)

    Since Iowa spends more on schools than Kansas on a per-student basis, we might be concerned that Kansas students are not doing as well as Iowa students. The National Assessment of Educational Progress (NAEP) is the best way to compare students in different states. 3 The following table shows NAEP data for Kansas and Iowa for 2015, the most recent year for data.

    Click for larger.

    Considering all students, Iowa has a larger percentage of students testing at “proficient” or better in all four subject/grade combinations.

    Looking at subgroups, however, is important, because states vary in the composition of their student bodies. When we look at subgroups, we find that Kansas usually outperforms Iowa for black and Hispanic students. Even for white students alone, Kansas and Iowa tie twice and split the other two subject/grade combinations.

    So let’s ask a few questions: Why is Iowa considered an aspirational state for Kansas? Is it because Iowa students perform better, or because Iowa spends more?


    Notes

    1. U.S. Census Bureau. Annual Survey of School System Finances. Available at https://www.census.gov/programs-surveys/school-finances.html.
    2. National Education Association. Rankings of States and Estimates of School Statistics. Available at http://www.nea.org/home/44479.htm.
    3. National Center for Education Statistics. National Assessment of Educational Progress (NAEP). Available at https://nces.ed.gov/nationsreportcard/.
  • Colorado and Kansas schools

    Colorado and Kansas schools

    A writer claims that Colorado schools are well-funded, while Kansas schools are not.

    From the Wichita Eagle Opinion Line:

    The economy of our neighbor, Colorado, is growing fast. New residents cite that state’s well-funded schools as a key reason. Meanwhile in Kansas, Susan Wagle says our public schools don’t deserve an extra nickel of help from legislators.” 1

    First, thinking like this ignores and disrespects the sacrifice Kansans make to fund our schools. This is a problem with government funding. The recipients rarely say “thank you” to those who provide the funding — they just get mad and agitate for more.

    Second, I believe the writer is arguing that Colorado spends more on schools than Kansas. If so, the writer is incorrect.

    The United States Census Bureau collects data from the states as part of its Annual Survey of School System Finances program. 2 Data is available through fiscal year 2015. The National Education Association also gathers data. 3 The following table displays some data from both sources.

    Since Colorado spends less on schools than Kansas on a per-student basis, we might be concerned that Colorado students are not doing as well as Kansas students. The National Assessment of Educational Progress (NAEP) is the best way to compare students in different states. 4 The following table shows NAEP data for Kansas and Colorado for 2015, the most recent year for data. In almost every case, Colorado students perform better.

    Click for larger.


    Notes

    1. Wichita Eagle, Opinion Line, March 29, 2018.
    2. U.S. Census Bureau. Annual Survey of School System Finances. Available at https://www.census.gov/programs-surveys/school-finances.html.
    3. National Education Association. Rankings of States and Estimates of School Statistics. Available at http://www.nea.org/home/44479.htm.
    4. National Center for Education Statistics. National Assessment of Educational Progress (NAEP). Available at https://nces.ed.gov/nationsreportcard/.
  • Dale Dennis, sage of Kansas school finance?

    Dale Dennis, sage of Kansas school finance?

    Is the state’s leading expert on school funding truly knowledgeable, or is he untrustworthy?

    Recent events have found Kansas Department of Education’s Deputy Commissioner Dale Dennis in the news regarding a possible mistake or misapplication of school funds. The school spending establishment has rushed to his rescue, with Kansas National Education Association, Kansas Association of School Boards, United School Administrators of Kansas, Kansas School Superintendents Association, and American Federation of Teachers Kansas issuing a joint statement. Dale Dennis, says the statement, is “the best friend public education and the kids of Kansas have had.” He is described as “the most trustworthy, honest, and respected advocate for children and schools.”

    Consider, however: The goals of these institutions are more spending on schools, less accountability for schools, and stamping out any movement towards school choice. And Dale Dennis accommodates this, especially more spending. This is the basis of the complaint, that he authorized more spending than the legislature intended in statute.

    On Facebook, Kansas public school spending advocates mislead about the level of school spending. Click for larger.
    No matter how this dispute resolves, Dale Dennis is not trustworthy and honest. Below is a description of a speech he gave to the Hutchinson Rotary Club last year. He portrayed a number called “base state aid per pupil” as all that the state spends on schools. The reality is that the state spends much more. Presenting base state aid as though it was all the state spends is misleading. It’s a lie.

    Base state aid is a fairly low figure and it has not kept up with inflation. But total state (and local) spending is much higher and has risen. This is why Dale Dennis is not trustworthy and honest. This is fake government.

    But because Dennis is willing to paint Kansas school finances untruthfully and in a way that makes it look like spending is low and has declined, the public school spending establishment loves him. They cite his figures. And then: Who can argue with the Kansas Department of Education Deputy Commissioner?

    What can argue with Dennis are the facts. Here’s how to refute Dale Dennis: View spending numbers from the Kansas State Board of Education.

    Following, from April 2017, analysis of Dale Dennis and his speech to the Hutchinson rotary Club.

    Fake government spawns fake news

    Discussions of public policy need to start from a common base of facts and information. An episode shows that both our state government and news media are not helping.

    A recent Hutchinson News article1 started with this:

    Once you wake up to where Kansas was in 1992 at funding schools and what it needs to do to get caught up, said the Kansas Department of Education’s Deputy Commissioner Dale Dennis, it’s a shocker.

    In 1992, base state aid per pupil was $3,600. That amount, taking into account the Consumer Price Index, would be the equivalent of $6,001.12 in 2013. Base state aid, however, has been frozen at $3,852 since 2014-15.

    “The numbers are shocking, shocking,” Dennis told the Hutchinson Rotary Club at its Monday luncheon meeting at the Hutchinson Town Club.

    Why is a speech by a government bureaucrat, as covered in a major newspaper, important? It illustrates two problems we face in understanding, discussing, and debating important matters of public policy.

    First, can government be truthful and accurate? Dale Dennis — the state’s top official on school finance — certainly knows that the numbers he presented do not accurately characterize the totality of school spending in Kansas. But the problem is even worse than that. To use base state aid as the indicator of state spending on schools is deceptive. It’s deceptive in that, after adjusting for inflation, base state aid has declined. But total state aid to school districts has increased.

    Base state aid is a false indicator of total spending on schools by the state. It’s fake — fake government. And for a newspaper to uncritically present this as news illustrates the second problem we face.

    Background on base state aid and school spending

    Kansas school spending, showing base state aid and total state aid. See article for notes about 2015. Click for larger.
    Base state aid per pupil — the statistic Dennis presented — is an important number.2 It’s the starting point for the Kansas school finance formula used before the 2015-2016 (fiscal 2016) school year, and something like it may be used in a new formula.3

    Base state aid, however, is not the only important number. To calculate the funding a school district receives, weightings are added. If students fall into certain categories, weightings for that category are added to determine a weighted enrollment. That is multiplied by base state aid to determine total state aid to the district. 4

    While this may seem like a technical discussion that doesn’t make a difference, it’s very important, because some of the weightings are large. The at-risk weighting, intended to cover the additional costs of teaching students from low-income families, started at five percent in 1993. In other words, for every student in this category, a school district received an extra five percent of base state aid. The value of this weighting has risen by a factor of nine, reaching 45.6 percent starting with the 2008-2009 school year.

    There’s also the high-density at-risk weighting. Starting with the 2006-2007 school year districts with a high concentration of at-risk students could receive an extra weighting of four percent or eight percent. Two years later the weightings were raised to six percent and ten percent. (This formula was revised again in 2012 in a way that may have slightly increased the weightings.)

    Kansas school spending, showing ratio of total state aid to base state aid. See article for notes about 2015. Click for larger.
    Kansas school spending. See article for notes about 2015. Click for larger.
    The weightings have a large effect on school funding. For example: During the 2004-2005 school year, base state aid was $3,863 and the at-risk weighting was ten percent. An at-risk student, therefore, generated $4,249 in state funding. (Other weightings might also apply.)

    Ten years later base state aid was $3,852 — almost exactly the same — and the at-risk weighting was up to 45.6 percent. This generates funding of $5,609. For a district that qualified for the maximum high-density at-risk weighting, an additional $404 in funding was generated. (These numbers are not adjusted for inflation.)

    So even though base state aid remained (almost) unchanged, funding targeted at certain students rose, and by a large amount.

    Over time, values for the various weightings grew until by 2014 they added 85 percent to base state aid. A nearby chart shows the growth of total state aid as compared to base state aid. (Starting in fiscal 2015 the state changed the way local tax dollars are counted. That accounts for the large rise for the last year of data in the chart. For school years 2016 and 2017, block grants have replaced the funding formula, so base aid and weightings do not apply in the same way.)

    What have we learned?

    We’re left wondering a few things:

    • Did Deputy Superintendent Dale Dennis tell the audience that base state aid is just part of the school funding landscape, and not reflective of the big picture? Did he tell the audience that total state aid to schools has increased, and increased substantially? If so, why wasn’t it mentioned in the article?
    • If Dale Dennis did not tell the audience these things, what conclusions should we draw about his truthfulness?
    • Why didn’t the Hutchinson News article explain to readers that base state aid is not an accurate or total indicator of total state spending on schools?
    • What is the duty of reporters and editors? We’re told that experienced journalists add background and context to the news — things that the average reader may not know. (This article is designated as “Editor’s Pick” by the Hutchinson News.)

    By the way, the Wichita Eagle, on its opinion page, cited in a positive and uncritical manner the Hutchinson News article.5 This is notable as the writer of the Eagle piece, opinion editor Phillip Brownlee, was a certified public accountant in a previous career. This is someone we should be able to trust to delve into numbers and tell us what they mean. But that isn’t the case.

    Whatever your opinion on the level and trend of school spending, we need to start the discussion from a common base of facts and information. From this episode, we see that both our state government and news media are not helping.

    For another take on the problems with this episode, see Paul Waggoner’s column in the Hutchinson News.6 (If not able to access that link, try Shocking News about Kansas Education!)


    Notes

    1. Clarkin, Mary. Department of Education’s Dennis: Shocking number when looking at funding gap. Hutchinson News. April 17, 2017. http://www.hutchnews.com/news/local_state_news/department-of-education-s-dennis-shocking-number-when-looking-at/article_4abe359e-8421-53f9-a8d7-1eaa56e95423.html.
    2. Weeks, Bob. Kansas school weightings and effects on state aid. In making the case for more Kansas school spending, the focus on base state aid per pupil leaves out important considerations. https://wichitaliberty.org/wichita-kansas-schools/kansas-school-weightings-and-effects-on-state-aid/.
    3. For the fiscal 2016 and 2017 school years, the formula was replaced by block grants.
    4. AMENDMENTS TO THE 1992 SCHOOL DISTRICT FINANCE AND QUALITY PERFORMANCE ACT AND THE 1992 SCHOOL DISTRICT CAPITAL IMPROVEMENTS STATE AID PROGRAM (FINANCE FORMULA COMPONENTS), Kansas Legislative Research Department, May 20, 2014
      http://ksde.org/Portals/0/School%20Finance/amends_to_sdfandqpa_2015.pdf
    5. Brownlee, Philip. School funding numbers are ‘shocking.’ Wichita Eagle. April 22, 2017. http://www.kansas.com/opinion/opn-columns-blogs/now-consider-this/article146084839.html.
    6. Waggoner, Paul. Shocking news about Kansas education. Hutchinson News. April 21, 2017. http://www.hutchnews.com/opinion/columnists/shocking-news-about-kansas-education/article_2ebea7d3-6659-51fc-b3b5-409d5b0aa243.html. Or, see http://wichitaliberty.org/kansas-government/shocking-news-kansas-education/.
  • Wichita school student/teacher ratios

    Wichita school student/teacher ratios

    During years of purported budget cuts, what has been the trend of student/teacher ratios in the Wichita public school district?

    When discussing school funding, there is controversy over how spending should be measured. What funds are included? Is KPERS included? Should we adjust for enrollment and inflation? What about bond and interest funds and capital outlay?

    The largest expenditures of schools — some 80 percent nationwide — is personnel costs. In Kansas, and Wichita in particular, we’re told that budget cuts are causing school class sizes to increase.

    When we look at numbers, we see that the USD 259, the Wichita public school district has been able to reduce its student/teacher ratios over the last ten years. (Student/teacher ratio is not the same statistic as class size.) There have been a few ups and downs along the way, but for all three levels of schools, student/teacher ratios are lower than they were ten years ago. (For middle schools, the trend over the past nine years is rising, although the ratio is lower than elementary and high schools.)

    So however spending is categorized in funds, whether KPERS contributions are included or not, whether the funding comes from state or local sources, whether or not spending is adjusted for inflation, the Wichita school district has been able to improve its student/teacher ratios over the past ten years.

    Data is from USD 259 Comprehensive Annual Financial Report for various years.