Tag: Education

  • Voice for Liberty Radio: David Boaz of Cato Institute

    Voice for Liberty logo with microphone 150In this episode of WichitaLiberty Radio: David Boaz spoke at the annual Kansas Policy Institute Dinner. David Boaz is the executive vice president of the Cato Institute and has played a key role in the development of the Cato Institute and the libertarian movement. He is a provocative commentator and a leading authority on domestic issues such as education choice, drug legalization, the growth of government, and the rise of libertarianism. Boaz is the former editor of New Guard magazine and was executive director of the Council for a Competitive Economy prior to joining Cato in 1981. He is the author of Libertarianism: A Primer, described by the Los Angeles Times as “a well-researched manifesto of libertarian ideas,” the editor of The Libertarian Reader, and coeditor of the Cato Handbook For Policymakers. His articles have been published in the Wall Street Journal, the New York Times, the Washington Post, the Los Angeles Times, National Review, and Slate. He is a frequent guest on national television and radio shows, and has appeared on ABC’s Politically Incorrect with Bill Maher, CNN’s Crossfire, NPR’s Talk of the Nation and All Things Considered, John McLaughlin’s One on One, Fox News Channel, BBC, Voice of America, Radio Free Europe, and other media. His latest book is The Politics of Freedom.

    This is an excerpt of David Boaz speaking in Wichita, October 15, 2013.

    Shownotes

    Cato Institute
    David Boaz at Cato Institute
    David Boaz: Independent Thinking in a Red-Blue Town
    Books by David Boaz
    Kansas Policy Institute

  • Kansas school spending, according to the Telegram

    newspaper-154444_150Another Kansas newspaper editorial shows that when writing about Kansas school spending, facts are sometimes not observed. The Garden City Telegram analyzed the recent State of the State address delivered by Kansas Governor Sam Brownback. In an editorial, the newspaper wrote: “In his speech, Brownback mentioned the quest for ‘world-class education’ in Kansas. But during his time in office, he presided over the largest overall cut in public education funding in the state’s history.” (School daze, January 18, 2014)

    kansas-school-spending-per-student-2013-10-chart-01

    Nearby is a chart of Kansas school spending (click it for a larger version). It’s adjusted for inflation. Spending is not as high as it was at its peak, but the newspaper’s claims of “largest overall cut” don’t match the facts. The Telegram editorial writers might also care to note who was governor when spending did decline.

    Those who claim school spending has been cut or is inadequate usually cite only base state aid per pupil, which has fallen. But it’s only the starting point for all the other spending. In totality, spending on schools in Kansas is over three times the level of base state aid. Also, comparisons are often made to what the Kansas Supreme Court said base state aid should be to its actual value. But the court doesn’t know how much should be spent on schools.

    It’s important to consider the totality of spending and not just base state aid. It’s important because total spending is so much greater than base state aid. Also, total spending accounts for some of the difficulties and expenses that schools cite when asking for higher spending.

    For example, schools often point to non-English speaking students and at-risk students as being expensive to educate. In recognition of this, the Kansas school finance formula makes allowances for this. According to the Kansas Legislator Briefing Book for 2013, the weighting for “full-time equivalent enrollment in bilingual education programs” is 0.395. This means that for each such student a school district has, an additional 39.5 percent over base state aid is given to the district.

    For at-risk pupils, the weighting is 0.456. At risk students, according to the briefing book, “are determined on the basis of at-risk factors determined by the school district board of education and not by virtue of eligibility for free meals.”

    Taken together, bilingual students considered to be at-risk generate an additional 85.1 percent of base state aid to be sent to the district, per student.

    These weightings are the reason why that while base state aid per pupil was $3,838 last year, total state aid per pupil was $6,984. Total state spending was 1.82 times base state aid.

  • College costs in Kansas: Rising by more than a tad

    graduate-150374_150Have college costs exceeded the rate of inflation by just a “tad,” as claimed by a Kansas college professor?

    Washburn University Political Science Professor Mark Peterson wrote in a recent op-ed that “The actual cost of obtaining postsecondary education has, like everything else, continued to rise — mostly at the rate of inflation plus a tad.”(Mark Peterson: State sends wrong higher-ed message, Wichita Eagle, Sunday, January 26, 2014.)

    The College Board keeps track of college costs and publishes its findings at Trends in College Pricing. Of particular interest is a table titled “Figure 5. Inflation-Adjusted Published Tuition and Fees Relative to 1983-84, 1983-84 to 2013-14 (1983-84 = 100).” This table assigns the cost of tuition and fees for the 1983-1984 school year to be 100, and tracks changes from that level. These numbers are adjusted for inflation.

    For the 2013-2014 school year, the values of this index are this:
    Private non-profit four-year college: 253
    Public four-year college: 331
    Public two-year college: 264

    The interpretation of these numbers is this: For private non-profit four-year colleges, the cost of tuition and fees is 2.53 times the level in 1983-1984. Or, since these values are inflation-adjusted, the cost rose 2.53 times as fast as inflation.

    For public four-year colleges, the rate of increase was higher: 3.31 times the rate of inflation over the past 30 years.

    Turning our attention to Kansas: Kansas Policy Institute has examined college costs. Its findings can be found in A Historical Perspective of State Aid, Tuition and Spending for State Universities in Kansas. Nearby is a table from that report. Note that over the ten-year period covered, inflation rose by 25.3 percent. For the six Regents Institutions in Kansas, all except for Fort Hays State had costs increasing by over 100 percent. That’s over four times the ate of inflation. University of Kansas costs rose by 193.6 percent, or 7.6 times the rate of inflation.

    inflation-kansas-colleges-kansas-policy-institute-2013-table-2

    Remember, Professor Peterson wrote that college costs had risen “mostly at the rate of inflation plus a tad.” His language leaves him a little wiggle room, as “mostly” and “tad” don’t have precise meanings. But evidently the product of the two is a pretty large number.

    Peterson also wrote regarding public postsecondary education that “its price continues to climb and the Kansas general fund contributes less.” Note that the KPI table shows that state aid has declined by one-tenth of one percent over ten years. That, I think, qualifies as a “tad.”

  • Kansas school test scores, the subgroups

    To understand Kansas school test scores, look at subgroups.

    Kansans are proud of their public schools. The public school education establishment refers with pride to top-ten rankings among the states on the National Assessment of Educational Progress (NAEP), known as “The Nation’s Report Card.”

    In his recent State of the State Address, Kansas Governor Sam Brownback made a similar claim, stating “According to the most recent National Assessment of Educational Progress, Kansas fourth graders are in one of the 10 best states for reading proficiency.”

    naep-data-explorer-logo
    If we’re going to rely on the NAEP test as evidence of the goodness of Kansas public schools, we should take a critical look at the scores. I’ve gathered NAEP test score data from the NAEP Data Explorer at the National Center for Education Statistics and made the data available in an interactive visualization.

    competition-ranking-example
    This visualization uses “competition” ranking in the way it handles ties. In this example, the first three states have the same score, so they are all ranked “1.” The next state is ranked “4.”

    This means that the rank values will always reach to 50, except for instances where there is missing or incomplete data. Actually, this data set extends to rank 52, as it contains the District of Columbia and the national average. I’ve also rounded the reported scores to integer values.

    To look at the governor’s claim: For all students in 2013, Kansas ranked 9 in grade 4 math, and 7 in grade 8 math. In reading, Kansas ranked 22 for grade 4, and 26 for grade 8. In his speech, the governor claimed Kansas was top 10 in reading. But it’s in math that Kansas students did that well. Reading scores are more toward the middle of the states.

    The importance of subgroups

    If we really want to gain understanding of how Kansas compares to other states on the NAEP, we need to take a look at subgroups of students, particularly subgroups based on race/ethnicity. The visualization of NAEP scores lets us do that.

    naep-rankings-states-example-2014-01
    Start with math for grade 4. We see these rankings for the major subgroups:
    All students, 9
    Black, 8
    Hispanic, 11
    White, 17

    For math, grade 8:
    All students, 7
    Black, 10
    Hispanic, 13
    White, 14

    For reading, grade 4:
    All students, 22
    Black, 20
    Hispanic, 26
    White, 19

    For reading, grade 8:
    All students, 26
    Black, 24
    Hispanic, 37
    White, 33

    Kansans should not be proud of some of these results. For grade 8 reading, the scores for Hispanic and White students rank lower than the national average.

    Another dimension for creating subgroups is based on poverty. NAEP uses eligibility for the national school lunch program as a proxy for poverty. If a student is eligible for the lunch program, the student is considered to be poor.

    Starting again with math grade 4, here are the rankings among the states for Kansas:
    All students, 9
    Eligible, 4
    Not eligible, 12

    For math, grade 8:
    All students, 7
    Eligible, 8
    Not eligible, 6

    For reading, grade 4:
    All students, 22
    Eligible, 20
    Not eligible, 13

    For reading, grade 8:
    All students, 26
    Eligible, 28
    Not eligible, 15

    Some of the grade 8 reading rankings are lower than the national average.

    As you can see, sometimes Kansas ranks very well among the states. In other instances, Kansas ranks much lower, even below the national average. It’s important for Kansans — be they citizens, schoolchildren, parents, education professionals, or (especially) politicians of any party — to understand these scores. If we don’t, we risk failing to recognize both the good things about Kansas schools and the areas that need improvement. Especially for the latter case, it’s Kansas schoolchildren who will suffer if we are not honest.

    There are two visualizations that you may use. Click here to open the visualization for race/ethnicity in a new window. Click here to open the visualization for national lunch program eligibility in a new window.

  • Voice for Liberty Radio: Mike O’Neal, Kansas Chamber of Commerce

    Voice for Liberty logo with microphone 150

    In this episode of WichitaLiberty Podcasts: Mike O’Neal, who is president and CEO of the Kansas Chamber of Commerce, spoke yesterday to the Wichita Pachyderm Club. A large part of his talk was on the topic of Kansas school finance and other education topics. This podcast contains that portion of his speech.

    O’Neal graduated from Kansas University and also its law school. He served in the Kansas House of Representatives for 28 years, with his final four years as Speaker of the House. He joined the Kansas Chamber as President and CEO in 2012 as he retired from the legislature.

    This is podcast episode number 4, released on January 18, 2014.

    [powerpress]

    Shownotes

    Kansas Chamber of Commerce
    Mike O’Neal at Wikipedia
    Mike O’Neal at LinkedIn
    Mike O’Neal biography at Kansas Chamber
    The Gannon opinion
    Kansas school topics from Voice for Liberty
    Kansas State Department of Education
    Kansas Policy Institute

  • Kansas school employment: The claims compared to statistics

    Kansas school employment: The claims compared to statistics

    School

    Claims made about Kansas schools don’t match the state’s statistics.

    Responding to the State of the State Address delivered by Kansas Governor Sam Brownback, Kansas House of Representatives Minority Leader and gubernatorial candidate Paul Davis provided figures regarding Kansas public schools, telling Kansans: “On top of that, public school class sizes are growing, [and] teachers have been laid off by the thousands.”

    Statistics from Kansas State Department of Education, however, show that school employment has rebounded, both in terms of absolute numbers of teachers and certified employees, and the ratios of pupils to these employees.

    Kansas school employment

    The story is not the same in every district. But considering the entire state, two trends emerge. For the past two years, the number of teachers employed in Kansas public schools has risen. Correspondingly, the pupil-teacher ratio has fallen. (This ratio is not the same statistic as average class size, but it’s the data we have. Plus, if schools are hiring teachers at a rate higher than the increase in students, we should expect class sizes to fall.)

    Kansas school employment ratios

    The trend for certified employees is a year behind that of teachers, but for the last year, the number of certified employees has risen, and the ratio to pupils has fallen.

    I’ve created interactive visualizations that let you examine the employment levels and ratios in Kansas school districts. Click here for the visualization of employment levels. Click here for the visualization of ratios (pupil-teacher and pupil-certified employee). Data is from Kansas State Department of Education. Visualization created by myself using Tableau Public.

    There’s also this to consider about class size. In 2011 the Center for American Progress released a report about class size reduction in schools and the false promise it holds for improving student achievement. (The False Promise of Class-Size Reduction)

    It’s quite astonishing to see CAP cite evidence from Eric Hanushek of the Hoover Institution and Caroline Hoxby of Stanford and Hoover. These two researchers are usually condemned by the public education establishment and bureaucracy, including teachers unions. These are some of the key constituents CAP usually caters to.

    In a nutshell, class size reduction produces very little benefit for students. It’s also very expensive, and there are other things we should be doing instead if we really want to increase student achievement.

    The report summarizes the important studies in class size reduction. The upshot is that there is only one study showing positive results from class size reduction, and that effect was found only among the early grades. The effect decreased after a few years, even though small class sizes were still used.

    The report also notes that class size reduction is very expensive to implement. Because it is, the report says we should look to other ways to increase student achievement, such as policies relating to teacher effectiveness: “The emerging consensus that teacher effectiveness is the single most important in-school determinant of student achievement suggests that teacher recruitment, retention, and compensation policies ought to rank high on the list.”

    On teacher quality and teacher effectiveness: When Sandi Jacobs of National Council for Teacher Quality appeared in Kansas a few years ago, we learned that Kansas ranks below average on its policies that promote teacher quality.

    In the example she illustrated, third graders who had teachers in the top 20 percent of effectiveness for the next three years went from the 50th percentile in performance to the 90th. For students with teachers in the lowest 20 percent for the same period, their performance dropped from the 50th percentile to the 37th percentile. More on this topic is at Kansas ranks low in policies on teacher quality.

  • Kansas school efficiency on display

    apple-wormWhen you hear that Kansas schools have “cut to the bone,” or are operating at maximum efficiency, or have nowhere else to cut, or there’s no need to audit school district efficiency, think of this.

    When Kansas governmental agencies receive requests for records, they must respond to the requester within three business days. Most often this response does not contain the requested records. Instead, it’s either a statement of how much the records will cost, or a denial of the request.

    Every agency I have dealt with — federal, state, city, county — has sent this response by email.

    That is, except for USD 259, the Wichita public school district.

    wichita-school-district-envelope-records-request-example

    The Wichita public school district sends the response in the form of a printed letter, mailed using United States Postal Service Priority Mail at a cost of $5.05 for postage. That’s in addition to the cost of preparing a printed letter. This has happened to me several times.

    Every governmental agency I have encountered, except for the Wichita Public School district, is content to use email to respond to records requests, at a very low cost.

    Within a budget of over $600 million, five dollars isn’t much. Except: This pattern of wasting money on postage must be repeated many times each year. This waste is also an indication of the district’s attitude towards the spending of taxpayer money.

    So when you hear that Kansas schools are grossly underfunded, or that teachers have to spend their personal funds to buy classroom supplies, ask yourself this: “Why does the Wichita public school district spend $5.05 in postage to send something that everyone else sends by email?”

  • Kansas schoolchildren shortchanged by Kansas City Star

    kansas-city-star-opinionAnother newspaper editorialist ignores the facts about Kansas schools. This is starting to be routine.

    In a collection of toasts and roasts, Kansas City Star columnist Steve Rose criticizes Kansas Governor Sam Brownback on a variety of fronts, especially on school funding:

    A ROAST to Kansas Gov. Sam Brownback, who led the charge for the most radical and irresponsible tax cuts in the history of Kansas and, perhaps, the entire country. One of the unfortunate victims of these cuts is education, both K-12 and higher education. The damage will be gradual, but it will be felt to be sure. Brownback says he is investing in more jobs. But he is dis-investing in education. What could be more vital to the Kansas economy and attracting businesses than a high quality educational system? (Roasts and toasts suitable for the new year, January 11, 2014)

    kansas-school-spending-per-student-2013-10-chart-01

    Dis-investing in education.: Nearby is a chart of Kansas school spending. It’s adjusted for inflation. Spending is not as high as it was at its peak, but claims of “slashing” or “dis-investing” don’t apply, either.

    Those who claim school spending is inadequate usually cite only base state aid per pupil, which has fallen. But it’s only the starting point for all the other spending. In totality, spending on schools in Kansas is over three times the level of base state aid. Also, comparisons are often made to what the Kansas Supreme Court said base state aid should be to its actual value. But the court doesn’t know how much should be spent on schools.

    Those who make claims of cutting schools should note this: Considering the entire state, two trends have emerged. For the past two years, the number of teachers employed in Kansas public schools has risen. Correspondingly, the student-teacher ratio has fallen. The trend for certified employees is a year behind that of teachers, but for the last year, the number of certified employees has risen, and the ratio to pupils has fallen.

    Kansas school employment

    I’ve created interactive visualizations that let you examine the employment levels and ratios in Kansas school districts.

    Kansas school employment ratios

    Click here for the visualization of employment levels. Click here for the visualization of ratios (pupil-teacher and pupil-certified employee).

    What could be more vital to the Kansas economy and attracting businesses than a high quality educational system? Rose is right. Good schools are vital to our future. If only Kansas had them.

    The focus on school spending — that’s all writers like Rose write about — keeps attention away from some unfortunate and unpleasant facts about Kansas schools. Kansas needs to confront these facts for the sake of Kansas schoolchildren. Editorials like this are very harmful to Kansas schoolchildren, because if spending is increased, not much is likely to improve, but the public school establishment and editorialists like Steve Rose will say that everything that’s wrong has been fixed.

    Here’s what Kansas needs to confront. Regarding Kansas school performance, we have to confront two unpleasant realities. First, Kansas has set low standards for its schools, compared to other states. Then, when the Kansas Supreme Court ordered more spending in 2005, the state responded by lowering school standards further. Kansas school superintendents defend these standards.

    When referring to “strong public school system,” here’s what Kansans need to know. On the National Assessment of Educational Progress (NAEP), known as “The Nation’s Report Card.” Kansas ranks pretty high among the states on this test. It’s important, however, to examine the results from a few different angles to make sure we understand the entire situation. An illustrative video is available here.

    Kansas and National NAEP Scores, 2011, by Ethnicity and Race

    If we compare Kansas NAEP scores to those of Texas, we have what seems to be four contradictory statements, but each is true.

    • When considering all students: Kansas scores higher than Texas.
    • Hispanic students only: Kansas is roughly equal to Texas.
    • Black students only: Kansas scores below Texas.
    • White students only: Kansas scores below Texas in most cases.

    What explains this paradox is that the two states differ greatly in the proportion of students in ethnic groups. In Kansas, 69 percent of students are white. In Texas it’s 33 percent. This large difference in the composition of students is what makes it look like Kansas students perform better on the NAEP than Texas students.

    But looking at the scores for ethnic subgroups, which state would you say has the most desirable set of NAEP scores? It’s important to know that aggregated data can mask or hide underlying trends.

    Here’s a question for you: Have you heard Kansas school leaders talk about this? Do Steve Rose and the Kansas City Star editorial board know this?

  • New York Times on Kansas schools, again

    new-york-times-logoThe New York Times — again — intervenes in Kansas schools. As it did last October, the newspaper makes serious errors in its facts and recommendations.

    An op-ed in the New York Times is being used by the Kansas public school spending establishment as evidence for the need to increase school spending in Kansas. (What’s the Matter With Kansas’ Schools?, January 8, 2014) The authors are David Sciarra, the executive director of the Education Law Center, and Wade Henderson, president and chief executive of the Leadership Conference on Civil and Human Rights.

    Before Kansas schoolchildren celebrate that the nation’s newspaper of record has taken up their case, let’s examine some of the claims and reasoning used by these authors.

    kansas-school-spending-per-student-2013-10-chart-01

    The op-ed makes this claim: “Overall, the Legislature slashed public education funding to 16.5 percent below the 2008 level.” Claims like this look only at base state aid per pupil funding, which is just part of total spending. Total state aid per pupil this past school year was $6,984. Base state aid per pupil was $3,838. Total state spending, therefore, was 1.82 times base state aid.

    It’s important to consider the totality of spending and not just base state aid. It’s important because total spending is so much greater than base state aid. Also, total spending accounts for some of the difficulties and expenses that schools cite when asking for higher spending. For example, advocates for higher school spending often point to non-English speaking students and at-risk students as being expensive to educate. In recognition of this, the Kansas school finance formula makes allowances for this. According to the Kansas Legislator Briefing Book for 2013, the weighting for “full-time equivalent enrollment in bilingual education programs” is 0.395. This means that for each such student a school district has, an additional 39.5 percent over base state aid is given to the district.

    For at-risk pupils, the weighting is 0.456. At risk students, according to the briefing book, “are determined on the basis of at-risk factors determined by the school district board of education and not by virtue of eligibility for free meals.” Taken together, bilingual students considered to be at-risk generate an additional 85.1 percent of base state aid to be sent to the district, per student.

    The decline in base state aid per pupil is a convenient fact for public school spending boosters. They can use a statistic that contains a grain of truth in order to whip up concern over inadequate school spending. They can cite this as an argument for increasing spending, even though spending has been rising.

    Further, citing only base state aid reduces “sticker shock.” Most people are surprised to learn that our schools spend $12,781 per student. It’s much easier to tell taxpayers that only $3,838 was spent. But that’s not a complete picture, not by far. For more on this, see Kansas school spending holding steady and Kansas school spending, by district.

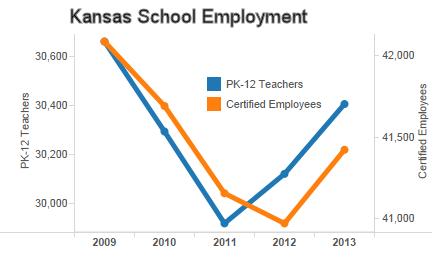
    The Times op-ed also states “Class sizes have increased, teachers and staff members have been laid off.” But statistics show that school employment has rebounded, both in terms of absolute numbers of teachers and certified employees, and also in the ratios of students to these employees. This video explains.

    The story is not the same in every district. But considering the entire state, two trends emerge. For the past two years, the number of teachers employed in Kansas public schools has risen. Correspondingly, the student-teacher ratio has fallen. The trend for certified employees is a year behind that of teachers, but for the last year, the number of certified employees has risen, and the ratio to pupils has fallen.

    Kansas school employment

    I’ve created interactive visualizations that let you examine the employment levels and ratios in Kansas school districts.

    Kansas school employment ratios

    Click here for the visualization of employment levels. Click here for the visualization of ratios (pupil-teacher and pupil-certified employee).

    The Times continues: “The judges also found that the Legislature was not meeting even the basic funding amounts set in its own education cost studies.” We shouldn’t rely on these documents. See Suitable education in Kansas. The primary study that Kansas relies upon is defective in this way, according to testimony from Kansas Policy Institute: “Augenblick & Myers (A&M) openly admitted that they deliberately deviated from their own Successful Schools methodology and delivered artificially high spending numbers by ignoring efficient use of taxpayer money. Amazingly, the Montoy courts still based their rulings on ‘evidence’ that was known to be worthless. And now the Shawnee County District Court is following that legal precedent in its ruling on Gannon.

    The Times also writes “A victory for the parents would be heartening” and “Kansans rightfully take pride in their strong public school system.”

    Talking about school spending is easy, although the Times, like most Kansas newspapers, doesn’t tell its readers the full story on spending. Advocating for more spending is easy. It’s easy because the Kansas Constitution says the state must spend on schools, parents want more spending, teachers want it, public employee unions want it. It’s easy to want more spending on schools because anyone who doesn’t is branded as anti-child, anti-education, anti-human.

    But the focus on school spending lets the Kansas public school establishment off the hook too easily. Any and all shortcomings of Kansas schools can be blamed on inadequate funding, and that’s what happens.

    The focus on school spending also keeps attention away from some unfortunate and unpleasant facts about Kansas schools that the establishment would rather not talk about. Kansas needs to confront these facts for the sake of Kansas schoolchildren. Editorials like this in the New York Times are very harmful to Kansas schoolchildren, because if the editorial’s recommendation is taken, not much is likely to improve, but the public school establishment will say that everything that’s wrong has been fixed.

    Here’s what Kansas needs to confront. Regarding Kansas school performance, we have to confront two unpleasant realities. First, Kansas has set low standards for its schools, compared to other states. Then, when the Kansas Supreme Court ordered more spending in 2005, the state responded by lowering school standards further. Kansas school superintendents defend these standards.

    When referring to “strong public school system,” here’s what Kansans need to know. On the National Assessment of Educational Progress (NAEP), known as “The Nation’s Report Card.” Kansas ranks pretty high among the states on this test. It’s important, however, to examine the results from a few different angles to make sure we understand the entire situation. An illustrative video is available here.

    Kansas and National NAEP Scores, 2011, by Ethnicity and Race

    If we compare Kansas NAEP scores to those of Texas, we have what seems to be four contradictory statements, but each is true.

    • When considering all students: Kansas scores higher than Texas.
    • Hispanic students only: Kansas is roughly equal to Texas.
    • Black students only: Kansas scores below Texas.
    • White students only: Kansas scores below Texas in most cases.

    What explains this paradox is that the two states differ greatly in the proportion of students in ethnic groups. In Kansas, 69 percent of students are white. In Texas it’s 33 percent. This large difference in the composition of students is what makes it look like Kansas students perform better on the NAEP than Texas students.

    But looking at the scores for ethnic subgroups, which state would you say has the most desirable set of NAEP scores? It’s important to know that aggregated data can mask or hide underlying trends.

    Here’s a question for you: Have you heard Kansas school leaders talk about this? Does the New York Times editorial board know this?