Tag: Education
-

Kansas school spending
Kansas school district spending, updated through 2020 and adjusted for inflation.
-

National Assessment of Educational Progress (NAEP) for Kansas
Looking at Kansas school test scores as compared to the nation.
-
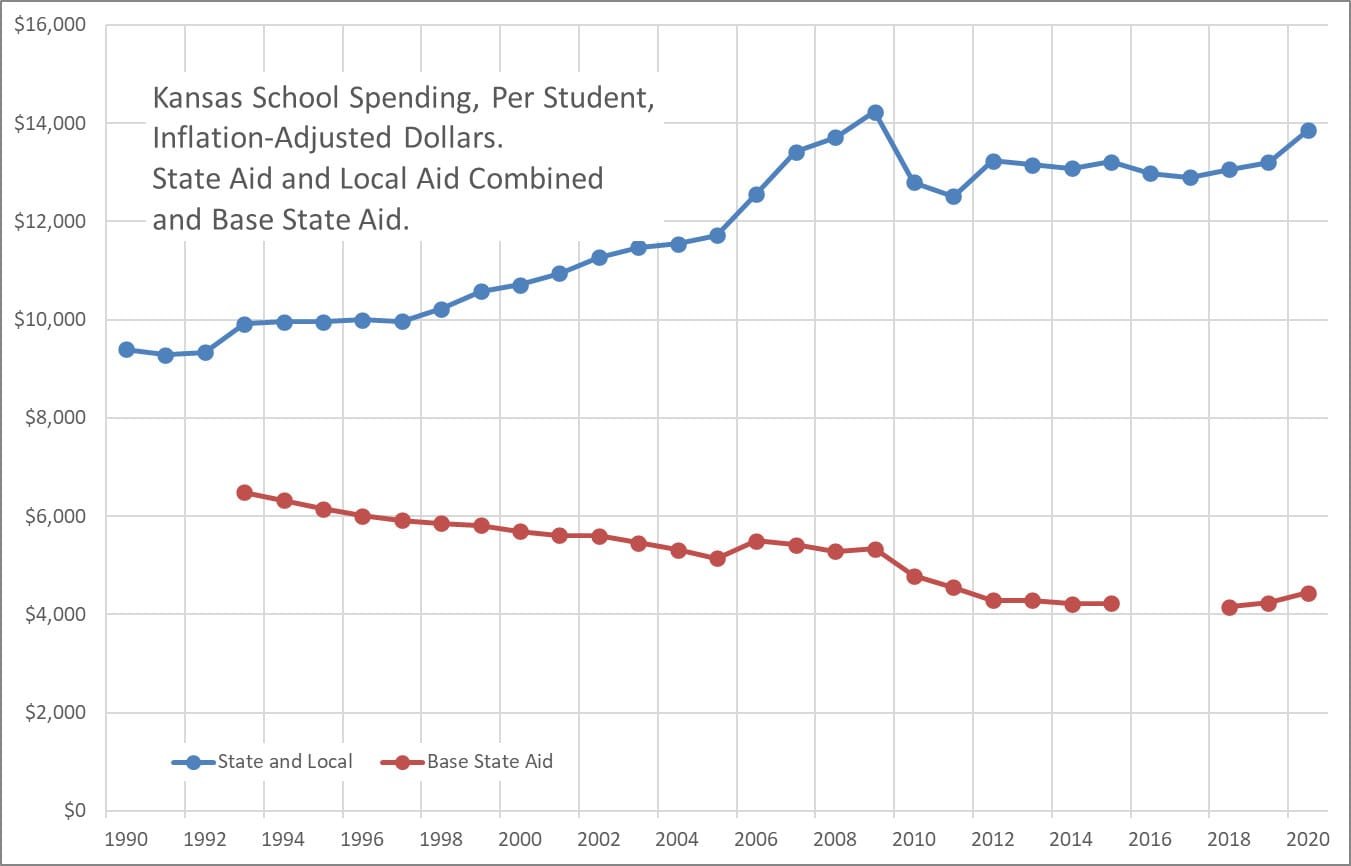
Kansas school spending, through 2020
Charts of Kansas school spending presented in different forms.
-

Kansas school employment
Kansas school employment rose for the current school year.
-

Performance levels in Wichita schools
There is some good news in the performance level reports for Wichita public schools.
-

Kansas school salaries
Kansas school salaries, visualized.
-

Wichita public schools, by the charts
Data from the annual report for the 2018-2019 school year for USD 259, the Wichita, Kansas public school district.
-

Kansas sees large drop in test scores
Using demographically-adjusted scores, Kansas falls in state rankings of National Assessment of Educational Progress (NAEP).
-

Nation’s report card has little good news
This year’s results from the National Assessment of Educational Progress (NAEP) hold little good news. Following, the Center for Education Reform summarizes.
-

New Symposium Society: Language Matters
From New Symposium Society: Language Matters
-

In NAEP mapping study, Kansas shines
In a new edition of a study that assesses the stringency of state school assessments, Kansas performs well.
-

Wichita public schools, by the charts
Data from the annual report for USD 259, the Wichita, Kansas, public school district.