Category: Wichita and Kansas schools

  • NAEP 2017 for Kansas, first look

    NAEP 2017 for Kansas, first look

    A look at National Assessment of Educational Progress test scores for Kansas and the nation, grade 4 reading.

    Today the National Center for Education Statistics released the main NAEP scores for 2017. NAEP — National Assessment of Educational Progress — is known as the “Nation’s Report Card.” 1 It is a test that is the same in all states, and is the primary means of comparing states. 2

    The main NAEP tests two subjects, math and reading, in two grades, fourth and eighth. For grade 4 reading, the average score for students in Kansas in 2017 was 223. NCES says this is not significantly different from the state’s average score in 2015 (221) and in 1998 (221). 3

    Looking at the scores using achievement levels for fourth grade reading, we see that 30 percent were at the “below basic” level of achievement. 70 percent were at “basic” or better, 37 percent at “proficient” or better, and 8 percent at “advanced.” All of these numbers are within two percentage points of the 2015 levels and are not significantly different, according to NCES. 4 (Clicking or tapping on charts may produce larger versions.)

    Comparing Kansas schools with the nation, we see that Kansas has an edge — sometimes — over the nation. For example, 70 percent of Kansas students are at basic or better, compared to 68 percent for the nation.

    Looking at Kansas and national schools broken down by eligibility for the school lunch program, we see that Kansas does better than the nation with students eligible for the lunch program. (Students who are eligible for the lunch program are those from low-income households.) But for students who are not eligible, national schools do better.

    Considering test scores by race/ethnicity, there is good news and bad news. (Again, these results are for grade 4 reading.) First, Kansas does better than the nation with Hispanic students at all achievement levels.

    For Black students, Kansas does worse than the nation at all achievement levels.

    For White students, Kansas also underperforms the nation at all achievement levels.

    This is a look at reading for grade 4 only.


    Notes

    1. United States Department of Education, Institute of Education Sciences, National Center for Education Statistics. Available at https://www.nationsreportcard.gov/.
    2. NAEP Overview Available at https://nces.ed.gov/nationsreportcard/about/.
    3. 2017 Reading State Snapshot Report, Kansas, Grade 4, Public Schools. Available at https://nces.ed.gov/nationsreportcard/subject/publications/stt2017/pdf/2018039KS4.pdf.
    4. Ibid.
  • Kansas and Iowa schools

    Kansas and Iowa schools

    Should Kansas schools aspire to be more like Iowa schools?

    The Kansas Association of School Boards lists Iowa as an “aspirational” state, that is, one that Kansas should consider a role model.

    I’ve gathered some data from both states. The United States Census Bureau collects data from the states as part of its Annual Survey of School System Finances program. 1 Data is available through fiscal year 2015. The National Education Association also gathers data. 2 The following table displays some data from both sources.

    Note that Iowa spends much more than Kansas. Iowa school teacher salaries are higher, although the student-teacher ratio is nearly the same. (Student-teacher ratio is not the same as average class size, but it’s the data that is collected and reported.)

    Since Iowa spends more on schools than Kansas on a per-student basis, we might be concerned that Kansas students are not doing as well as Iowa students. The National Assessment of Educational Progress (NAEP) is the best way to compare students in different states. 3 The following table shows NAEP data for Kansas and Iowa for 2015, the most recent year for data.

    Click for larger.

    Considering all students, Iowa has a larger percentage of students testing at “proficient” or better in all four subject/grade combinations.

    Looking at subgroups, however, is important, because states vary in the composition of their student bodies. When we look at subgroups, we find that Kansas usually outperforms Iowa for black and Hispanic students. Even for white students alone, Kansas and Iowa tie twice and split the other two subject/grade combinations.

    So let’s ask a few questions: Why is Iowa considered an aspirational state for Kansas? Is it because Iowa students perform better, or because Iowa spends more?


    Notes

    1. U.S. Census Bureau. Annual Survey of School System Finances. Available at https://www.census.gov/programs-surveys/school-finances.html.
    2. National Education Association. Rankings of States and Estimates of School Statistics. Available at http://www.nea.org/home/44479.htm.
    3. National Center for Education Statistics. National Assessment of Educational Progress (NAEP). Available at https://nces.ed.gov/nationsreportcard/.
  • Colorado and Kansas schools

    Colorado and Kansas schools

    A writer claims that Colorado schools are well-funded, while Kansas schools are not.

    From the Wichita Eagle Opinion Line:

    The economy of our neighbor, Colorado, is growing fast. New residents cite that state’s well-funded schools as a key reason. Meanwhile in Kansas, Susan Wagle says our public schools don’t deserve an extra nickel of help from legislators.” 1

    First, thinking like this ignores and disrespects the sacrifice Kansans make to fund our schools. This is a problem with government funding. The recipients rarely say “thank you” to those who provide the funding — they just get mad and agitate for more.

    Second, I believe the writer is arguing that Colorado spends more on schools than Kansas. If so, the writer is incorrect.

    The United States Census Bureau collects data from the states as part of its Annual Survey of School System Finances program. 2 Data is available through fiscal year 2015. The National Education Association also gathers data. 3 The following table displays some data from both sources.

    Since Colorado spends less on schools than Kansas on a per-student basis, we might be concerned that Colorado students are not doing as well as Kansas students. The National Assessment of Educational Progress (NAEP) is the best way to compare students in different states. 4 The following table shows NAEP data for Kansas and Colorado for 2015, the most recent year for data. In almost every case, Colorado students perform better.

    Click for larger.


    Notes

    1. Wichita Eagle, Opinion Line, March 29, 2018.
    2. U.S. Census Bureau. Annual Survey of School System Finances. Available at https://www.census.gov/programs-surveys/school-finances.html.
    3. National Education Association. Rankings of States and Estimates of School Statistics. Available at http://www.nea.org/home/44479.htm.
    4. National Center for Education Statistics. National Assessment of Educational Progress (NAEP). Available at https://nces.ed.gov/nationsreportcard/.
  • Dale Dennis, sage of Kansas school finance?

    Dale Dennis, sage of Kansas school finance?

    Is the state’s leading expert on school funding truly knowledgeable, or is he untrustworthy?

    Recent events have found Kansas Department of Education’s Deputy Commissioner Dale Dennis in the news regarding a possible mistake or misapplication of school funds. The school spending establishment has rushed to his rescue, with Kansas National Education Association, Kansas Association of School Boards, United School Administrators of Kansas, Kansas School Superintendents Association, and American Federation of Teachers Kansas issuing a joint statement. Dale Dennis, says the statement, is “the best friend public education and the kids of Kansas have had.” He is described as “the most trustworthy, honest, and respected advocate for children and schools.”

    Consider, however: The goals of these institutions are more spending on schools, less accountability for schools, and stamping out any movement towards school choice. And Dale Dennis accommodates this, especially more spending. This is the basis of the complaint, that he authorized more spending than the legislature intended in statute.

    On Facebook, Kansas public school spending advocates mislead about the level of school spending. Click for larger.
    No matter how this dispute resolves, Dale Dennis is not trustworthy and honest. Below is a description of a speech he gave to the Hutchinson Rotary Club last year. He portrayed a number called “base state aid per pupil” as all that the state spends on schools. The reality is that the state spends much more. Presenting base state aid as though it was all the state spends is misleading. It’s a lie.

    Base state aid is a fairly low figure and it has not kept up with inflation. But total state (and local) spending is much higher and has risen. This is why Dale Dennis is not trustworthy and honest. This is fake government.

    But because Dennis is willing to paint Kansas school finances untruthfully and in a way that makes it look like spending is low and has declined, the public school spending establishment loves him. They cite his figures. And then: Who can argue with the Kansas Department of Education Deputy Commissioner?

    What can argue with Dennis are the facts. Here’s how to refute Dale Dennis: View spending numbers from the Kansas State Board of Education.

    Following, from April 2017, analysis of Dale Dennis and his speech to the Hutchinson rotary Club.

    Fake government spawns fake news

    Discussions of public policy need to start from a common base of facts and information. An episode shows that both our state government and news media are not helping.

    A recent Hutchinson News article1 started with this:

    Once you wake up to where Kansas was in 1992 at funding schools and what it needs to do to get caught up, said the Kansas Department of Education’s Deputy Commissioner Dale Dennis, it’s a shocker.

    In 1992, base state aid per pupil was $3,600. That amount, taking into account the Consumer Price Index, would be the equivalent of $6,001.12 in 2013. Base state aid, however, has been frozen at $3,852 since 2014-15.

    “The numbers are shocking, shocking,” Dennis told the Hutchinson Rotary Club at its Monday luncheon meeting at the Hutchinson Town Club.

    Why is a speech by a government bureaucrat, as covered in a major newspaper, important? It illustrates two problems we face in understanding, discussing, and debating important matters of public policy.

    First, can government be truthful and accurate? Dale Dennis — the state’s top official on school finance — certainly knows that the numbers he presented do not accurately characterize the totality of school spending in Kansas. But the problem is even worse than that. To use base state aid as the indicator of state spending on schools is deceptive. It’s deceptive in that, after adjusting for inflation, base state aid has declined. But total state aid to school districts has increased.

    Base state aid is a false indicator of total spending on schools by the state. It’s fake — fake government. And for a newspaper to uncritically present this as news illustrates the second problem we face.

    Background on base state aid and school spending

    Kansas school spending, showing base state aid and total state aid. See article for notes about 2015. Click for larger.
    Base state aid per pupil — the statistic Dennis presented — is an important number.2 It’s the starting point for the Kansas school finance formula used before the 2015-2016 (fiscal 2016) school year, and something like it may be used in a new formula.3

    Base state aid, however, is not the only important number. To calculate the funding a school district receives, weightings are added. If students fall into certain categories, weightings for that category are added to determine a weighted enrollment. That is multiplied by base state aid to determine total state aid to the district. 4

    While this may seem like a technical discussion that doesn’t make a difference, it’s very important, because some of the weightings are large. The at-risk weighting, intended to cover the additional costs of teaching students from low-income families, started at five percent in 1993. In other words, for every student in this category, a school district received an extra five percent of base state aid. The value of this weighting has risen by a factor of nine, reaching 45.6 percent starting with the 2008-2009 school year.

    There’s also the high-density at-risk weighting. Starting with the 2006-2007 school year districts with a high concentration of at-risk students could receive an extra weighting of four percent or eight percent. Two years later the weightings were raised to six percent and ten percent. (This formula was revised again in 2012 in a way that may have slightly increased the weightings.)

    Kansas school spending, showing ratio of total state aid to base state aid. See article for notes about 2015. Click for larger.
    Kansas school spending. See article for notes about 2015. Click for larger.
    The weightings have a large effect on school funding. For example: During the 2004-2005 school year, base state aid was $3,863 and the at-risk weighting was ten percent. An at-risk student, therefore, generated $4,249 in state funding. (Other weightings might also apply.)

    Ten years later base state aid was $3,852 — almost exactly the same — and the at-risk weighting was up to 45.6 percent. This generates funding of $5,609. For a district that qualified for the maximum high-density at-risk weighting, an additional $404 in funding was generated. (These numbers are not adjusted for inflation.)

    So even though base state aid remained (almost) unchanged, funding targeted at certain students rose, and by a large amount.

    Over time, values for the various weightings grew until by 2014 they added 85 percent to base state aid. A nearby chart shows the growth of total state aid as compared to base state aid. (Starting in fiscal 2015 the state changed the way local tax dollars are counted. That accounts for the large rise for the last year of data in the chart. For school years 2016 and 2017, block grants have replaced the funding formula, so base aid and weightings do not apply in the same way.)

    What have we learned?

    We’re left wondering a few things:

    • Did Deputy Superintendent Dale Dennis tell the audience that base state aid is just part of the school funding landscape, and not reflective of the big picture? Did he tell the audience that total state aid to schools has increased, and increased substantially? If so, why wasn’t it mentioned in the article?
    • If Dale Dennis did not tell the audience these things, what conclusions should we draw about his truthfulness?
    • Why didn’t the Hutchinson News article explain to readers that base state aid is not an accurate or total indicator of total state spending on schools?
    • What is the duty of reporters and editors? We’re told that experienced journalists add background and context to the news — things that the average reader may not know. (This article is designated as “Editor’s Pick” by the Hutchinson News.)

    By the way, the Wichita Eagle, on its opinion page, cited in a positive and uncritical manner the Hutchinson News article.5 This is notable as the writer of the Eagle piece, opinion editor Phillip Brownlee, was a certified public accountant in a previous career. This is someone we should be able to trust to delve into numbers and tell us what they mean. But that isn’t the case.

    Whatever your opinion on the level and trend of school spending, we need to start the discussion from a common base of facts and information. From this episode, we see that both our state government and news media are not helping.

    For another take on the problems with this episode, see Paul Waggoner’s column in the Hutchinson News.6 (If not able to access that link, try Shocking News about Kansas Education!)


    Notes

    1. Clarkin, Mary. Department of Education’s Dennis: Shocking number when looking at funding gap. Hutchinson News. April 17, 2017. http://www.hutchnews.com/news/local_state_news/department-of-education-s-dennis-shocking-number-when-looking-at/article_4abe359e-8421-53f9-a8d7-1eaa56e95423.html.
    2. Weeks, Bob. Kansas school weightings and effects on state aid. In making the case for more Kansas school spending, the focus on base state aid per pupil leaves out important considerations. https://wichitaliberty.org/wichita-kansas-schools/kansas-school-weightings-and-effects-on-state-aid/.
    3. For the fiscal 2016 and 2017 school years, the formula was replaced by block grants.
    4. AMENDMENTS TO THE 1992 SCHOOL DISTRICT FINANCE AND QUALITY PERFORMANCE ACT AND THE 1992 SCHOOL DISTRICT CAPITAL IMPROVEMENTS STATE AID PROGRAM (FINANCE FORMULA COMPONENTS), Kansas Legislative Research Department, May 20, 2014
      http://ksde.org/Portals/0/School%20Finance/amends_to_sdfandqpa_2015.pdf
    5. Brownlee, Philip. School funding numbers are ‘shocking.’ Wichita Eagle. April 22, 2017. http://www.kansas.com/opinion/opn-columns-blogs/now-consider-this/article146084839.html.
    6. Waggoner, Paul. Shocking news about Kansas education. Hutchinson News. April 21, 2017. http://www.hutchnews.com/opinion/columnists/shocking-news-about-kansas-education/article_2ebea7d3-6659-51fc-b3b5-409d5b0aa243.html. Or, see http://wichitaliberty.org/kansas-government/shocking-news-kansas-education/.
  • Wichita school student/teacher ratios

    Wichita school student/teacher ratios

    During years of purported budget cuts, what has been the trend of student/teacher ratios in the Wichita public school district?

    When discussing school funding, there is controversy over how spending should be measured. What funds are included? Is KPERS included? Should we adjust for enrollment and inflation? What about bond and interest funds and capital outlay?

    The largest expenditures of schools — some 80 percent nationwide — is personnel costs. In Kansas, and Wichita in particular, we’re told that budget cuts are causing school class sizes to increase.

    When we look at numbers, we see that the USD 259, the Wichita public school district has been able to reduce its student/teacher ratios over the last ten years. (Student/teacher ratio is not the same statistic as class size.) There have been a few ups and downs along the way, but for all three levels of schools, student/teacher ratios are lower than they were ten years ago. (For middle schools, the trend over the past nine years is rising, although the ratio is lower than elementary and high schools.)

    So however spending is categorized in funds, whether KPERS contributions are included or not, whether the funding comes from state or local sources, whether or not spending is adjusted for inflation, the Wichita school district has been able to improve its student/teacher ratios over the past ten years.

    Data is from USD 259 Comprehensive Annual Financial Report for various years.

  • Wichita school revenue

    Wichita school revenue

    Revenue for the Wichita public school district continues its familiar trend.

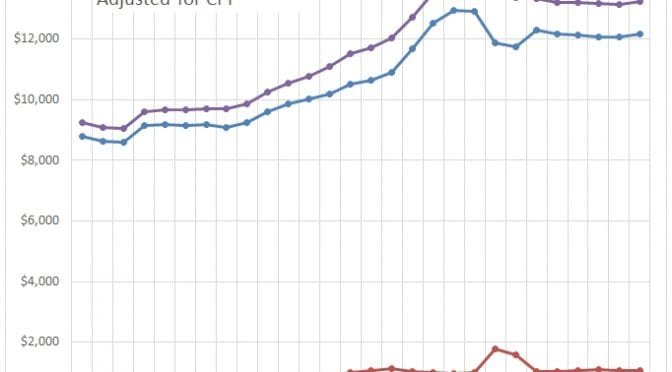
    Wichita school revenue. Click for larger.
    Now that USD 259, the Wichita public school district, has finally published its Comprehensive Annual Financial Report for the year ending June 30, 2017, we can start to look at some figures.

    The nearby chart shows data from the CAFR along with my calculations. I took two data series, total revenue and the sum of state and local revenue, divided by FTE enrollment, and adjusted for inflation. I plot the sum of state and local revenue because in 2015 there was a change in the way some taxes were allocated. Plotting the sum of the two removes the effect of the change.

    As can be seen in the chart, the trend for both series is generally rising, with a few dips along the way.

  • Kansas school spending

    Kansas school spending

    New data for spending in Kansas schools is available.

    Through its Data Central section, Kansas State Department of Education has made spending figures available for the school year ending in spring 2017, or the fiscal 2017 school year.

    These are amounts per pupil, adjusted for inflation to 2016 dollars, showing change from 2016 to 2017.

    State aid: $8,613 to $8,714
    Federal aid: $1,058 to $1,082
    Local: $3,460 to 3,441
    Total: $13,144 to $13,326

    In 2015 there was a shift in the way state and local figures are allocated, so it’s important to look at state and local spending as a sum. This figure increased from $12,073 to $12,155.

    In the charts below, state and local total spending, per pupil, adjusted for inflation, has been remarkably level since 2013. At the same time, schools are telling us spending has been slashed.

    Click charts for larger versions.

  • Wichita public school district transparency

    Wichita public school district transparency

    Transparency issues surrounding the Wichita public school district are in the news. There are steps that are easy to make, but the district resists.

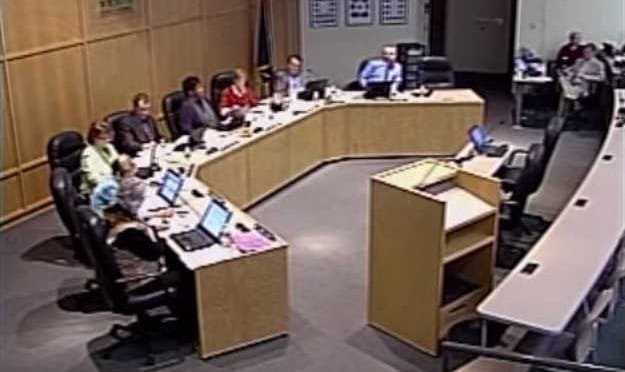
    It’s difficult to view a meeting of the Wichita school board.

    If you — perhaps a taxpayer to USD 259 — would like to watch a meeting of the board of USD 259, the Wichita public school district, your options are few. You can attend the meetings in person. Or, if you subscribe to certain cable television systems, you can view delayed repeats of the meetings. But that’s it.

    Live and archived video of governmental meetings is commonplace, except for the Wichita public schools. Citizens must either attend USD 259 meetings or view delayed broadcasts on cable TV, if they subscribe.

    There’s a simple way to fix this. It’s called YouTube.

    When the Sedgwick County Commission was faced with an aging web infrastructure for its archived broadcasts, it did the sensible thing. It created a YouTube channel and uploaded video of its meetings. Now citizens can view commission meetings at any time on desktop PCs, tablets, and smartphones. This was an improvement over the old system, which was difficult to use and required special browser plug-ins.

    Sometimes citizens have taken it upon themselves to post Wichita school board video on YouTube so that citizens and taxpayers may view meetings. Click for an example.
    The Wichita school district could do the same. In fact, the district already has a YouTube channel. Recently, it has started posting video excerpts of some meetings.

    So the district has demonstrated it has the technical capability and resources to post video of meetings to YouTube. Now, in addition to the excerpts, it should post video of all meetings in their entirety.

    Yes, it takes a long time to upload two or three hours of video to YouTube, but once started the process runs in the background without intervention. No one has to sit and watch the process.

    I have asked the district why it does not make video of its meetings available online. The district responded that it “has a long-standing commitment to the USD 259 community of showing unabridged recordings of regular Board of Education meetings on Cox Cable Channel 20 and more recently AT&T U-verse Channel 99.”

    Showing meetings delayed on cable TV is okay. It was innovative at one time — a long time ago. Okay. But why aren’t meetings shown live? What if you can’t watch the meeting before it disappears from the broadcast schedule after a week? What if you don’t subscribe to cable TV? (This is becoming more common as more people “cut the cord” and rely on services like YouTube for television.) What if you want to watch meetings on your computer, tablet, or smartphone?

    I don’t think the fact that meetings are on cable TV means they can’t also be on YouTube. But that seems like what the school district believes.

    Sometimes increasing transparency is so easy. We must wonder why governmental agencies resist.

  • Kansas school fund balances

    Kansas school fund balances

    Kansas school fund balances rose this year, in both absolute dollars and dollars per pupil.

    As Kansans debate school funding, as the Kansas Supreme Court orders more school spending, and as schools insist that spending has been slashed, a fact remains: Kansas schools don’t spend all the money they’ve been given. Unspent fund balances grow in many years, and grew this year.

    Fund balances are necessary for cash flow management. They buffer the flows of receipts and expenditures. The issue is what levels of balances are necessary, and, more importantly, how the balances change over years.

    In Kansas, school districts report fund balances on July 1 of each year. Looking at fund balances on that date over time gives insight into how districts are managing receipts and expenditures. If a fund balance falls from July 1 of one year to July 1 of the next year, it means that the district spent more money from the fund than it put in the fund. The opposite is also true: If a balance rises, it means less was spent than was put in.

    Based on recent data from the Kansas State Department of Education, fund balances rose rapidly after 2008, remained largely level from 2011 through 2015, and rose for 2016 and 2017.

    For the school year ending in 2017, total fund balances were $2,016,863,070. (This value does not include non-school funds like museums and recreation center funds.) For 2016, the figure was $1,871,026,493. This is an increase of $145,836,577, or 7.8 percent.

    Around half of these fund balances are in bond and capital funds, which are different from operating funds. Without these capital funds, balances rose from $935,116,567 to $970,188,922. This is an increase of $35,072,355, or 3.8 percent.

    When fund balances rise, it is because schools did not spend all their revenue. If schools say that cuts had to be made, and at the same time fund balances are rising, Kansans might wonder why schools did not spend some of these idle fund balances.

    I’ve gathered data about unspent Kansas school funds from Kansas State Department of Education and present it as an interactive visualization in a variety of tables and charts. Data is available for each district since 2008. You may explore the data yourself by using the visualization. Click here to open it in a new window. Data is from Kansas State Department of Education in current dollars (not adjusted for inflation). Visualization created using Tableau Public.

    Top chart: Fund balances in all funds except non-school funds. Bottom: Without bond and capital funds. Click for larger.