Category: Education

  • School spending in the states

    School spending in the states

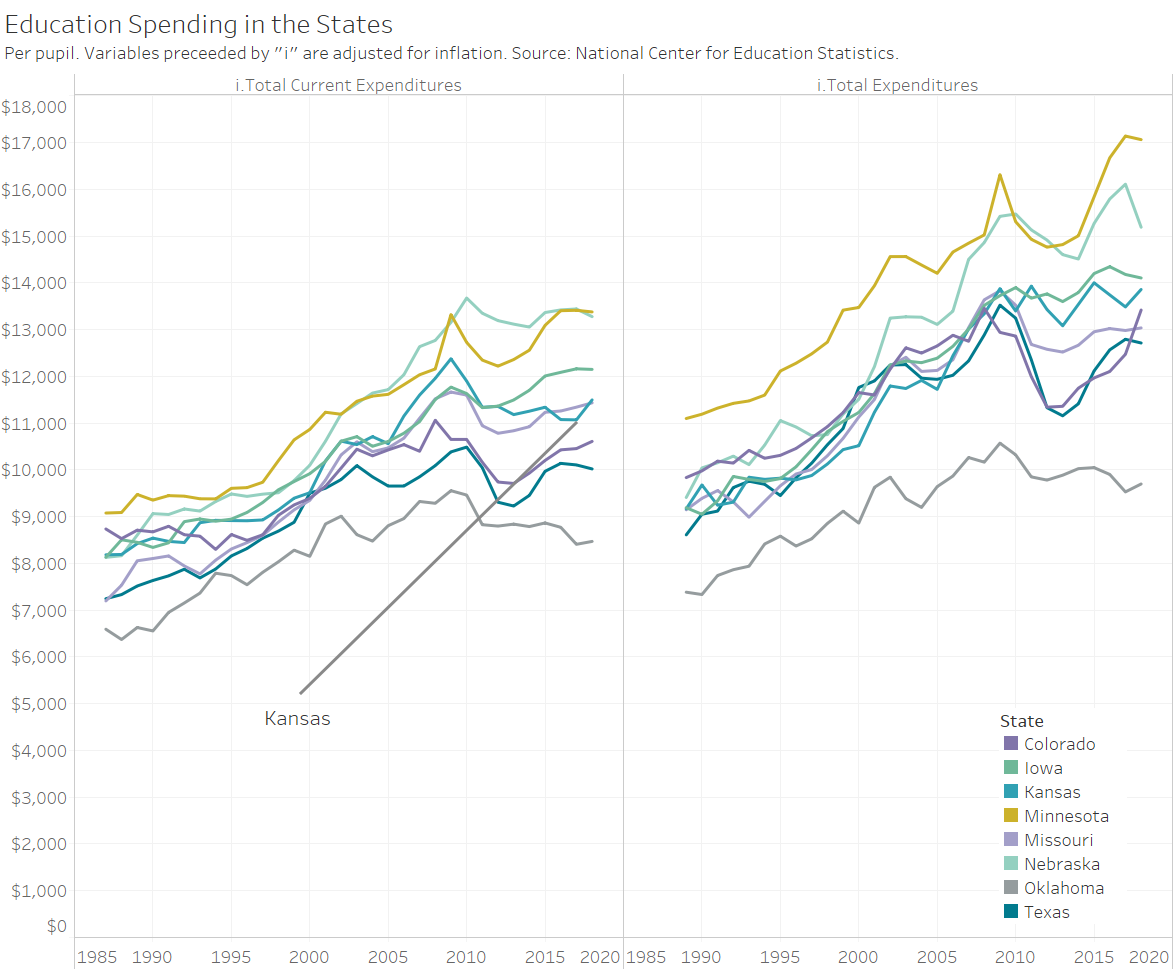
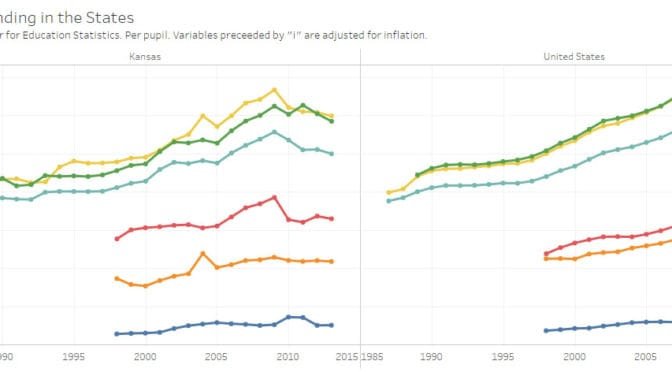
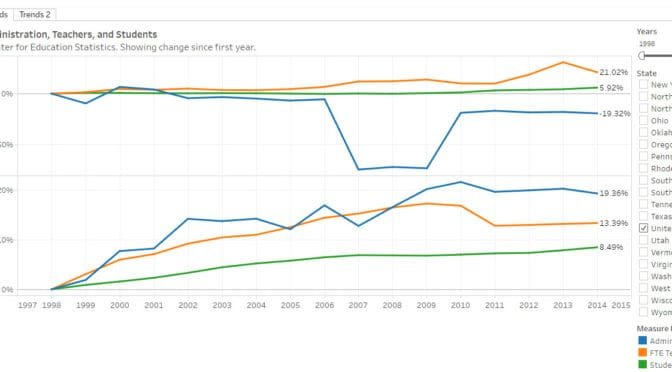
    School spending in the states, presented in an interactive visualization.

    The Elementary/Secondary Information System (ElSi) is a project of National Center for Education Statistics (NCES). NCES is “the primary federal entity for collecting and analyzing data related to education in the U.S. and other nations. NCES is located within the U.S. Department of Education and the Institute of Education Sciences.” Here is data from ElSi regarding per-pupil revenue and spending in the states. (more…)

  • Nation’s report card has little good news

    Nation’s report card has little good news

    This year’s results from the National Assessment of Educational Progress (NAEP) hold little good news. Following, the Center for Education Reform summarizes.

    Statement on Shocking Education Report
    Assessment Finds Majority of U.S. Students Have Declined in Core Subjects

    WASHINGTON D.C. (10.30.19) — The Center for Education Reform (CER), a national leader in the fight to achieve educational excellence in the United States, today issued a statement by CER founder and CEO Jeanne Allen regarding the new scores revealed this morning by the National Center on Education Statistics in the annual National Assessment of Education Progress (NAEP), also known as “The Nation’s Report Card.”

    Key insights from the NAEP report include the following:

    • READING PROFICIENCY: National results have dropped in both grades, with the lowest performing students doing worse
    • MATHEMATICS PROFICIENCY: National results are mixed. Most states remained flat; National 4th grade scores rose 1 point, while 8th grade dropped a point, with the lowest performing students doing worse
    • White, black, Hispanic, and American Indian/Alaskan Native eighth-grade students all scored lower on reading in 2019 than in 2017

    Statement by CER Founder & CEO Jeanne Allen:

    “The NAEP proficiency scores announced today should be shocking to every family, employer, and policymaker. They demonstrate that the vast majority of our nation’s education systems are simply failing to meet the very basic educational needs of American students, threatening their dreams for the future.

    “But while the nation’s overall scores are either flat or declined, there is extraordinary news from the nation’s capital, where the federal government and city leaders worked together to ensure that parents and educators have the power to design, manage, and innovate their schools.

    “In DC where a majority of students are no longer confined to their zip code and almost 50% of students are in charter schools, students showed gains in almost every category. Student proficiency has now shown steady and consistent improvement since 1996, when the District’s charter school law first went into effect.

    “Once ranked at or near the bottom by every measure, the District’s average is now close to the national average, and achievement in reading and math continues to grow at higher rates than almost every other jurisdiction, particularly among traditionally low-performing students.

    “Combined with data from states such as Arizona and Florida where a prevalence of educational options exist, this initial look at the NAEP data suggests that academic proficiency scores rise where educational choices are robust.

    “But even this progress is not good enough. We need to fight to end the flatline of failure by removing the bureaucratic burdens and failed policies that keep students from getting the education they deserve. We need to fight to end the absurdity of systems like Chicago Public Schools, where for 10 days students have been kept out of school because adults think the system is about them. This is surreal and needs to stop. No longer should students’ futures be determined by their zip codes, anywhere.

    “In equally shocking news, ACT released a report, The Condition of College & Career Readiness, showing that college preparedness in math and English are the lowest they’ve been in 15 years. ACT is one of the best barometers of student progress, and our college-bound kids are doing worse than they have in the ACT’s history. This report, along with the NAEP report, show a steady decline in proficiency, a future no one wants to see for the next generation of Americans.

    “As CER Chairman Michael Moe argues, every individual should have the opportunity to participate in the future, and the path to that future is education. Without it, a bright future for millions is in peril.

    “We need everyone involved in the education journey – parents, teachers, and students alike – to join us in this battle.”

    Founded in 1993, the Center for Education Reform aims to expand educational opportunities that lead to improved economic outcomes for all Americans — particularly our youth — ensuring that conditions are ripe for innovation, freedom and flexibility throughout U.S. education.

  • In NAEP mapping study, Kansas shines

    In NAEP mapping study, Kansas shines

    In a new edition of a study that assesses the stringency of state school assessments, Kansas performs well.

    States are free to create their own tests to measure the performance of students in their schools. There is variability in how stringently states construct their tests.

    The U.S. Department of Education, through the National Center for Education Statistics (NCES), conducts the National Assessment of Educational Progress (NAEP) every other year. Known as “The Nation’s Report Card,” it is “the largest nationally representative and continuing assessment of what America’s students know and can do in various subject areas.” 1

    The value of NAEP is this, according to NCES:

    Since standards vary across states, the results of the various state assessments cannot be used to directly compare students’ progress. However, by placing a state standard onto the NAEP scale, a common metric for all states, a NAEP equivalent score of that standard is produced, which can be compared across states.

    The Mapping State Proficiency Standards report provides the results of this analysis. 2

    From the technical notes to the report: “NAEP provided a common scale on which the stringency of the various state criteria for proficiency could be compared.” The purpose of the study is to map each state’s standards to a common standard. By doing this, we can determine whether a state uses a stringent or weak standard to evaluate students. This study does not evaluate the performance — good or bad — of a state’s students. Rather, the study evaluates the state and its standards.

    In years past, the rigor of the Kansas standards have been found by this study to be low, compared to other states. 3 Then, the standards improved. 4

    Now, the recently-released mapping study shows Kansas to have high standards, in some cases the highest in the nation. This analysis by NCES is based on the 2017 administration of NAEP.

    In the nearby illustration taken from the NCES mapping study, states with stronger standards appear on the right end of the scale. Kansas is somewhat above the middle. For grade 4 math, Kansas ranked higher.

    Click for larger.

    For both grade 8 reading and math, Kansas standards were judged most stringent of all states.

    Click for larger.

    This is good news. It means that the Kansas tests are providing a more realistic assessment of Kansas students. Again, this mapping study measures the tests, not the performance of students taking the test. Regarding performance, when properly considered, Kansas often underperforms the nation. 5


    Notes

    1. National Assessment of Educational Progress. About. Available at nces.ed.gov/nationsreportcard/about/.
    2. National Center for Education Statistics. Mapping State Proficiency Standards. Available at ah.* Available at https://nces.ed.gov/nationsreportcard/studies/statemapping/.
    3. Weeks, Bob. Kansas school standards evaluated. Available at https://wichitaliberty.org/wichita-kansas-schools/kansas-school-standards-evaluated/.
    4. Weeks, Bob. Accountability in Kansas public schools. Available at https://wichitaliberty.org/wichita-kansas-schools/accountability-in-kansas-public-schools/.
    5. Weeks, Bob. NAEP results for 2017 available in interactive visualizations. Available at https://wichitaliberty.org/education/naep-results-for-2017-available-in-interactive-visualizations/.
  • Education gap on Wichita City Council

    Education gap on Wichita City Council

    Currently there is discussion in Wichita on whether higher education is valued by residents. Following, from April 2011, a look at the educational achievement of the Wichita City Council. The members of the council cited below were Lavonta Williams, Sue Schlapp, Jim Skelton, Paul Gray, Jeff Longwell, and Janet Miller. Carl Brewer was mayor.

    Before Jim Skelton left the council in January, none of the four men serving on the Wichita City Council had completed a college degree. The three women serving on the council set a better example, with all three holding college degrees.

    Of the candidates running in next week’s election for four council seats and the office of mayor, less than half hold college degrees.

    Is it necessary to complete college in order to serve in an office like mayor or city council? Apparently, none of the four men who held these offices without a degree thought so. The two running to retain their present positions — Mayor Carl Brewer and council member Jeff Longwell (district 5, west and northwest Wichita) — evidently don’t think so, or they would not be running again.

    But we tell young people that college holds the key to success. We encourage schoolchildren to consider college and to take a rigorous high school curriculum in order to prepare for it. We encourage families to save for college. Our region’s economic development agency promotes the number of people with college or advanced degrees. We promote our colleges and universities as a factor that distinguishes Wichita. We hope that our elected officials will set an example we want young people to follow.

    Once in office, we ask our city elected officials to attempt to grasp and understand complex sets of financial data, working with a budget of about half a billion dollars for the City of Wichita. We hope that they will be able to consider large and weighty issues such as the role of government in a free society. Members of the professional management staff — bureaucrats — that manage the city, county, and state are generally required to hold college degrees.

    The irony is that elected officials often are highly reliant on the bureaucratic staff for information, data, and advice, and this professional bureaucracy is often highly educated. Does this imbalance create problems?

    Elected officials compared to regular people

    Amazingly, it turns out that elected officials, as a group, are less knowledgeable about civics than the general population. That’s the finding of Intercollegiate Studies Institute, which surveyed Americans and their knowledge of civics in 2008. After analyzing the data, ISI concluded: “Simply put, the more you know about American government, history, and economics the less likely you are to pursue and win elective office.”

  • Tax benefits for education don’t increase education

    Tax benefits for education don’t increase education

    Here’s evidence of a government program that, undoubtedly, was started with good intentions, but hasn’t produced the intended results.

    Tax season ended last week. Taxpayers have filed for over $30 billion in credits and deductions for college expenses they paid in 2017.

    Evidence now clearly shows that these credits have zero effect on college attendance. The tax credits surely make those who get them better off, but they do nothing to increase education. If their intent is to increase schooling, they are a failure.

    Continue reading at The Brookings Institution article The tax benefits for education don’t increase education.

  • NAEP results for 2017 available in interactive visualizations

    NAEP results for 2017 available in interactive visualizations

    When properly considered, Kansas often underperforms the nation in the most recent assessment of “The Nation’s Report Card.”

    The results for the 2017 administration of the National Assessment of Educational Progress, or NAEP, were recently released. I’ve prepared interactive visualizations of some of the results. To access the visualizations, click on National Assessment of Educational Progress (NAEP).

    When considering NAEP results, it’s important to consider subgroups, such as race/ethnicity and school lunch status, which is a proxy for poverty. It’s important because states vary widely in the composition of subgroups.

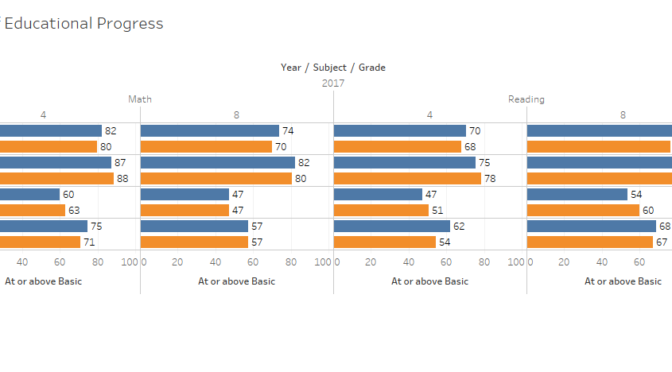
    For example, consider an accompanying example from the visualization. We see that when considering all students, Kansas does better than the national average in percent of students performing as basic or better. This is true in all four combinations of grade and subject.

    Looking at black students alone, however, we see that Kansas underperforms the nation, except in one instance where there is a tie.

    For Hispanic students alone, Kansas does better in all instances except for one tie.

    For white students alone, Kansas underperforms the nation in three instances, and outperforms in one.

    This statistical anomaly is known as Simpson’s Paradox. It may appear when comparing subgroups to aggregated data when the proportional composition of subgroups varies between populations, in this case the states. For grade 4 reading, 64 percent of students in Kansas were white. For the nation, it was 49 percent. This is a difference in composition that must not be ignored.

    The relatively low proportion of minority students is why Kansas appears to perform better than the nation. The apparent superior performance of Kansas melts away when looking at subgroups.

    Kansas and the nation, percent at basic or better. Click for larger.
    Kansas and the nation, percent at proficient or better. Click for larger.
  • Public education factbook for 2017

    Public education factbook for 2017

    The fifth edition of data on public schools in Kansas is available.

    Kansas Policy Institute has released a new edition of its Public Education Fact Book. KPI describes this book:

    KPI’s fifth annual Public Education Fact Book is a one-stop shop for data on public school information from The Sunflower State. Numerous scientific surveys show that citizens are grossly misinformed on many pertinent facts of public education in Kansas. Aid and spending per-pupil are much higher than many Kansans believe, and student achievement is lower than understood. This fact book series aims to rectify this situation.

    This document is available to read online here, or contact KPI for a printed copy.

  • Fake news, meet fake research

    Fake news, meet fake research

    Do you think we have a problem with fake news? Let me introduce you to fake research.

    Think of the term “peer-reviewed research.” What comes to my mind is the academic or scientific researcher, wearing a white lab coat, dispassionately and impartially following the data and experiments down whatever path they lead.

    But it isn’t always that way. Retraction Watch tracks research papers that have been retracted. There are a variety of reasons for retractions. Honest mistakes are made, yes. But striking is how much outright and blatant fraud exists in the academic publishing world. Here is a sampling of some articles from Retraction Watch:

    “A physicist formerly based at the Lawrence Livermore National Laboratory (LLNL) in California has been sentenced to 18 months in prison for faking data.” (U.S. gov’t physicist sentenced to 18 months in prison for fraud)

    “Do you know the difference between a group of researchers in the same field who cite each other’s related work, and a group of authors who purposefully cite each other in order to boost their own profiles?” (How to spot a “citation cartel”)

    “In October, the Journal of Biological Chemistry retracted 19 papers coauthored by cancer biologist Jin Cheng, formerly at the Moffitt Cancer Center in Tampa, Florida. That’s something you don’t see every day.” Also: “It’s every researcher’s worst nightmare: a manuscript gets rejected during peer review, then shows up later — published by one of the reviewers.” (Top 10 Retractions of 2016)

    “When it comes to detecting image manipulation, the more tools you have at your disposal, the better. In a recent issue of Science and Engineering Ethics, Lars Koppers at TU Dortmund University in Germany and his colleagues present a new way to scan images. Specifically, they created an open-source software that compares pixels within or between images, looking for similarities, which can signify portions of an image has been duplicated or deleted.” (Sleuthing out scientific fraud, pixel by pixel)

    “The situation should sound familiar to readers who follow such “sting” operations: Spears submitted a fake paper to the so-called “predatory” journal, it was accepted one month later with no changes, and published.” (Surprise! Paper retracted after author tells journal it’s a “pile of dung”)

    And, to top it off:

    And today, we bring you news of an effort by John Bohannon, of Science magazine, to publish fake papers in more than 300 open access journals. Bohannon, writing as “Ocorrafoo Cobange” of the “Wassee Institute of Medicine” — neither of which exist, of course — explains his process:

    The goal was to create a credible but mundane scientific paper, one with such grave errors that a competent peer reviewer should easily identify it as flawed and unpublishable. Submitting identical papers to hundreds of journals would be asking for trouble. But the papers had to be similar enough that the outcomes between journals could be comparable. So I created a scientific version of Mad Libs.

    The paper took this form: Molecule X from lichen species Y inhibits the growth of cancer cell Z. To substitute for those variables, I created a database of molecules, lichens, and cancer cell lines and wrote a computer program to generate hundreds of unique papers. Other than those differences, the scientific content of each paper is identical.

    The result? 157 journals accepted the paper and 98 rejected it. (Science reporter spoofs hundreds of open access journals with fake papers)

    Retraction Watch has a blog. You can subscribe to email updates. Also, you can keep informed on Facebook and Twitter. An upcoming project is completing a database for tracking retractions.

  • School choice and funding

    School choice and funding

    Opponents of school choice programs argue the programs harm traditional public schools, both financially and in their ability to serve their remaining students. Evidence does not support this position.

    The prevalent argument is that charter schools and other school choice programs drain funds from public schools. That is, if a public school student chooses to attend a charter or private school, and if the money follows the student to the other school, the public school district loses money that it otherwise would have received. Therefore, the public school district is worse off, and so too are its students.

    A rebuttal is that since a public school has shed the responsibility for schooling the student, its costs should fall correspondingly. This would be true if all the costs of a public school are variable. Some costs are fixed, however, meaning they can’t be adjusted quickly — in the short run, that is. An example is the cost to maintain a classroom. If a school has one less student than the year before, it still requires the same support for utilities. One or several fewer students doesn’t mean that fewer teachers are needed.

    Public schools and their lobbyists, therefore, argue that school choice programs are a financial burden to public schools. Under school choice programs, they say, public schools lose students and their accompanying funding, but the public schools retain their fixed costs.

    The Fiscal Effects of School Choice Programs on Public School Districts (cover)The question, then, is what portion of a school’s costs are variable, meaning costs that schools can adjust quickly, and what portion are fixed, meaning they can’t be adjusted quickly? Benjamin Scafidi, professor of economics at Kennesaw State University, has examined schools looking for the answer to this question. His paper The Fiscal Effects of School Choice Programs on Public School Districts, published by EdChoice (formerly The Friedman Foundation for Educational Choice), holds answers to these questions.

    The first question is this: What is the relation of school choice programs to school districts’ variable costs? Scafidi has endeavored to determine the breakdown between variable and fixed costs in each state. In Kansas, for the 2008 – 2009 school year, total spending per student was $11,441. Of that, Scafidi estimates $3,749, or 32.8 percent, were fixed costs. Variable costs were $7,692, or 67.2 percent. Since then spending has risen, but there’s no reason to think the allocation of costs between fixed and variable has changed materially. For the school year ending in 2015 total spending per student was $13,1241. That implies fixed costs per student of $4,305 and variable costs per student of $8,819.

    Now, how much money would a public school lose if a student chose to attend a school other than the traditional public schools? For Kansas this question is complicated by recent changes in the way public schools are funded. Prior to the school year ending in 2016, Kansas used a school funding formula that started with a figure called “base state aid per pupil.” For 2015 the value was $3,852, and that is the starting point for calculating state spending per student.

    In a recent presentation on this topic, Scafidi said: “Any school choice program where about $8,000 per student or less, on average, follows the child to the school of his or her choice, improves the fiscal situation of the public school district, on average, and students who remain in public schools have more resources available for their education.” Considering only base state aid per pupil, a typical Kansas school district, which has variable costs of $8,819 per student, has its fiscal situation improved when it loses a student and the accompanying $3,852 in state funding.

    Kansas School Finance Formula, from Kansas Policy Institute, August 2014
    Kansas School Finance Formula, from Kansas Policy Institute, August 2014
    Many Kansas students, however, trigger much more funding due to weightings that compensate for the purported higher costs of some situations. The largest weighting in Kansas, based magnitude, is the “at-risk” weighting. It adds 45.6 percent to base state aid. So if a Kansas public school loses such a student and weighting, it loses $5,608 in funding. That is far less than its variable costs of $8,819. State funding for Kansas schools in the school year ending in 2015 was $8,5672 per student, still less than school districts’ variable costs.

    I asked Scafidi what is the dividing line between variable and fixed costs? The answer is that within two or three years, schools should be able to adjust their fixed costs to be in line with their needs. This is in line with the economic and accounting reality that says in the long run, all costs are variable.

    Can school districts adjust their costs quickly in response to changing enrollments? This may be a problem for the very smallest districts, those with just one or two teachers per grade, Scadifi concedes. In his paper, Scafidi illustrates two examples of districts in Georgia with just over 1,000 students making adjustments. In Kansas, there are 286 school districts. Of these, 207 have enrollment of less than 1,000 students, but only 20 percent if the state’s students are in these small districts.

    School districts often dispute the contention that they are able to reduce their variable costs rapidly in response to enrollment changes. Scafidi notes that if school districts say they cannot reduce costs when they lose students, the implication is that all of their costs are fixed. If that is true, then schools should not receive additional funding when enrollment rises. If all their costs truly are fixed, the total cost of running a school district does not change with enrollment — either up or down.

    Going forward in Kansas

    Kansas is in the process of formulating a new school financing method. For the school years ending in 2016 and 2017 the state has used a block grant method, whereby state funding to school districts was frozen at the 2015 level with some increases programmed into the law. Current law anticipates a new funding formula being passed in the 2017 legislative session and applied to the school year ending in 2018.

    One of the most important goals for the new funding method should be transparency and flexibility. The prior school finance formula was criticized as being complex and difficult to understand. For example, in June the Kansas Legislature held a special session in order to increase school funding in response to a decision by the Kansas Supreme Court. But, more than half of the higher funding the Wichita school district received went to property tax reduction, rather than being spent on schools.3 Citizens have trouble understanding how increasing state school funding means a reduction in property tax instead of more teachers or schoolbooks. This illustrates a problem with transparency in the prior funding formula.

    Remaining students

    We have seen that school choice programs do not harm the finances of local school districts. The second question concerns the quality of education for the students who remain in public schools.

    To answer this question, we must recognize the wide variation of teacher efficacy. Some are very good, and some very poor. Further, the difference between good and bad is large. Eric A. Hanushek and others have found that very good teachers routinely produce 1.5 years of gain in achievement during an academic year. Bad teachers produce 0.5 years of gain.4 If a student is unfortunate enough to experience ineffective teachers two or three years in a row, the student may be so far behind as to never catch up.

    What does this have to do with school choice programs? If public schools have to downsize due to students lost for any reason — including school choice programs — this gives public schools an opportunity to shed their least effective teachers. This means that students who remain in public schools have a higher likelihood of experiencing the most effective teachers.


    Notes

    1. Kansas State Department of Education. Total Expenditures by District. Available at www.ksde.org/Agency/Fiscal-and-Administrative-Services/School-Finance/Budget-Information/Total-Expenditures-by-District.
    2. ibid.
    3. Lowry, Brian. Kansas schools will stay open as court OKs funding fix. Wichita Eagle, June 28, 2016. Available at www.kansas.com/news/local/education/article86508017.html.
    4. Hanushek and Rivkin. Teacher Quality. Available here.