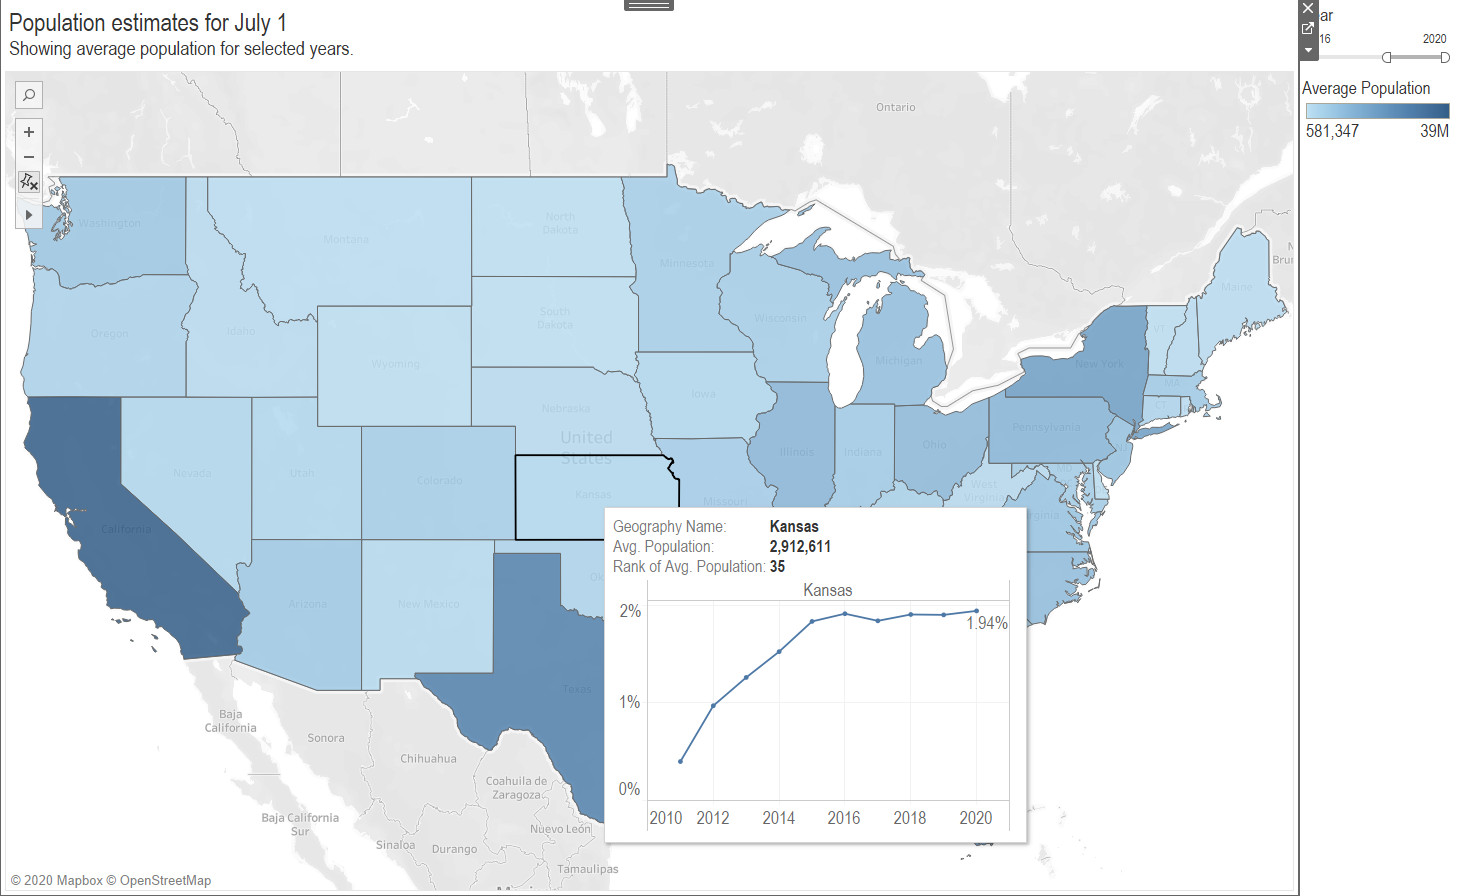
Annual population estimates for states from the United States Census Bureau presented in an interactive visualization.
Each year the United States Census Bureau releases population estimates for the United States and geographical divisions of states, counties, cities, and towns. I present this data and associated computations of my own in an interactive visualization.
This data comes from the Census Bureau’s Population Estimates Program (PEP). It is not data from a census. Instead, the Bureau uses “current data on births, deaths, and migration” to produce annual estimates of the population of areas such as states. The estimates are produced for July 1 of each year.
The Bureau’s page for this program is here.
There are a variety of charts and tables to select. To access the interactive visualization, click here.
For more visualizations, click here.

