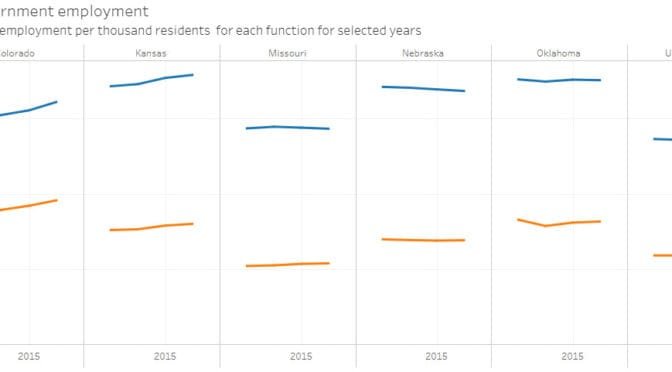
An interactive visualization of state government employment, grouped by state and function.
These are state government employees only. Local and federal government employees are not included.
The Source of this data is United States Census Bureau, Local Government Employment and Payroll Data. The program’s page is Annual Survey of Public Employment & Payroll (ASPEP). The data is gathered in March, specifically for the pay period that includes March 12.
In the visualization, I’ve multiplied the March payroll number by 12 to produce an approximation of annual payroll. Using each state’s population for each year, I’ve also computed the annual payroll on a per-resident basis and the number of full-time equivalent (FTE) employees per thousand residents.
These are state government employees only. Federal government and local government employees are not included. Sometimes this causes discrepancies that need to be understood by considering other data. For example, Hawaii has no local employees in elementary and secondary education, as it has one school district which is run by the state. (1)Wikipedia. Hawai’i Department of Education. Available at https://en.wikipedia.org/wiki/Hawai%27i_Department_of_Education. Because in most states, elementary and secondary education is primarily a local government expense, Hawaii, in these charts, ranks as the state with the highest number of government employees, considering only state government employees.
Click here to access the visualization.
For more visualizations, click here.
For the following examples, click for larger versions.


![]()
References
| ↑1 | Wikipedia. Hawai’i Department of Education. Available at https://en.wikipedia.org/wiki/Hawai%27i_Department_of_Education. |
|---|