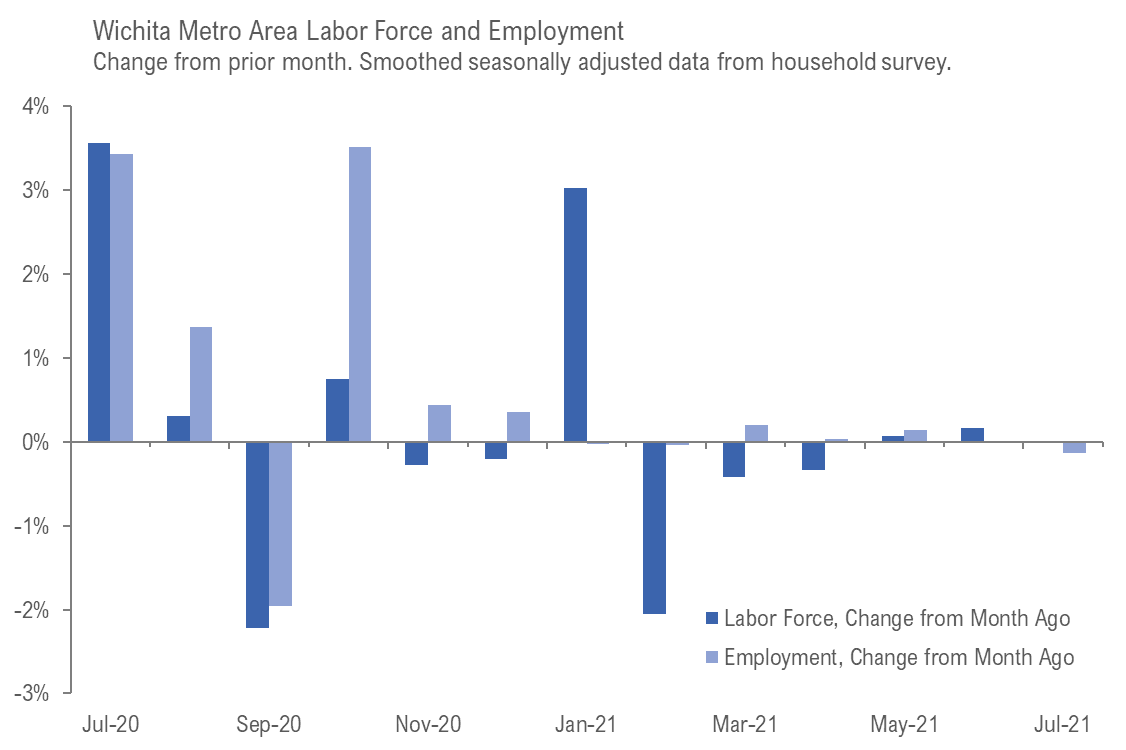
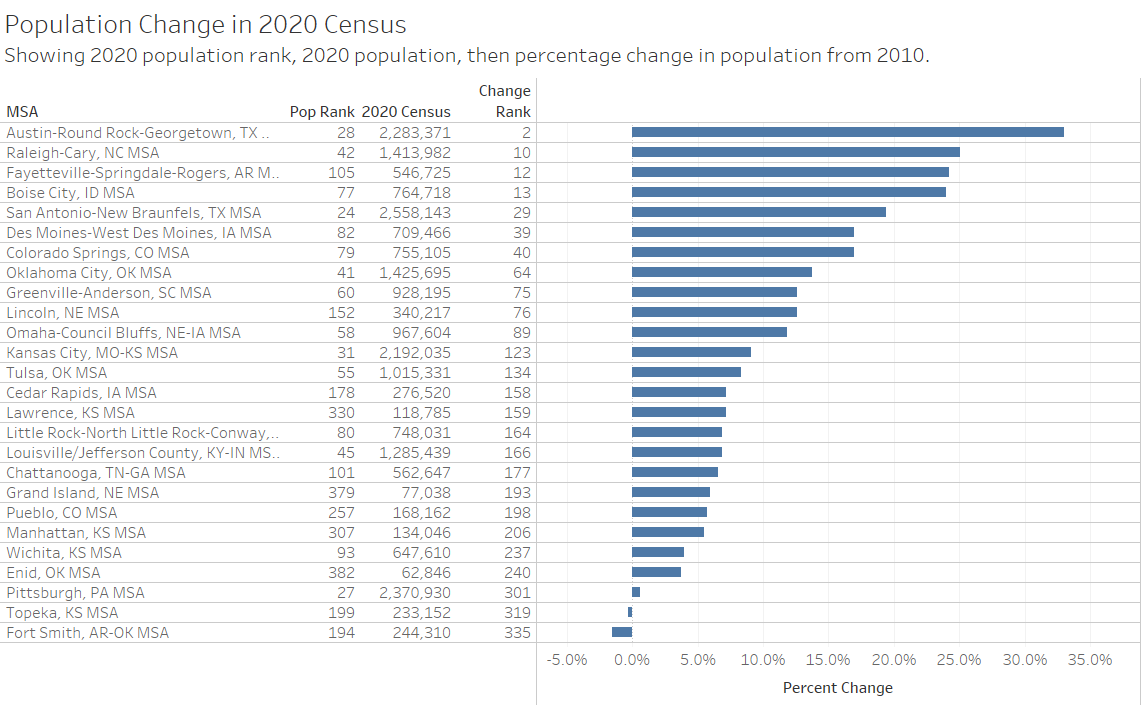
For the Wichita metropolitan area in July 2021, the number of unemployed persons is down, the unemployment rate is down, and the number of people working is up when compared to the same month one year ago. The recent trend has fewer people working and a rising unemployment rate. (more…)
Tag: Wichita Regional Chamber of Commerce

Downtown Wichita Tax Base
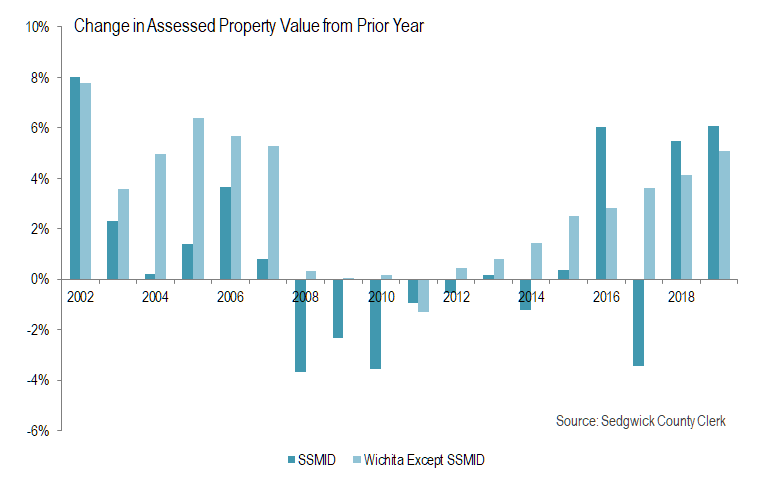
There’s been much investment in downtown Wichita. But it isn’t evident in the assessed value of property, although the recent trend is positive. (more…)

Metro Monitor for Wichita, 2019 edition
In a report looking at the economics of the 100 largest metropolitan areas, Wichita often ranks near the bottom.
Each year Brookings Institution creates an index of major metropolitan areas called Metro Monitor. The report, says Brookings, “explores the local realities of America’s economic progress, illuminating how metropolitan economies are performing today and over the past decade.” The report for 2019 is available here.
The report examines the 100 largest metropolitan areas. For 2018, the Wichita MSA ranked as the 89th largest, falling from rank 82 as recently as 2011. 1
Growth
To examine growth of a metro, Brookings considered percentage change in jobs, percentage change in gross metropolitan product, and percentage change in jobs at young firms. The nearby charts shows the results. (Some data is not available for all metro areas.)
Click charts for larger versions.
Prosperity
Prosperity looks at percentage changes in productivity, standard of living, and average wage.
Inclusion
Inclusion looks at percentage changes in median earnings, relative poverty, and employment rate.
Racial inclusion
Racial inclusion looks at change in white/people of color median earnings gap, relative poverty gap, and employment rate gap.
Looking forward
As the Brookings analysis ends with 2017, what might we find if the analysis was based on 2018 and 2019 data? Some of the data Brookings uses is not available until after a lengthy delay, such GDP for metropolitan areas. That data, which is an important indicator of a region’s economic health, is not yet available for 2018 for metropolitan areas.
Employment data is available quickly, however. The nearby chart, displaying data from the Bureau of Labor Statistics, shows changes in the number of jobs for Wichita and the nation, displaying the percentage change from the same month of the prior year. 2 It’s easy to see the slump in Wichita in 2017. Since then Wichita has improved, with some months showing greater job growth than the nation. From January 2018 to August 2019, national jobs grew by 2.6 percent, and in the Wichita MSA, by 2.2 percent. 3
—
Notes- Weeks, Bob. Wichita population falls; outmigration continues. Available at https://wichitaliberty.org/wichita-government/wichita-population-falls-outmigration-continues/. ↩
- An interactive version of the chart is available at https://fred.stlouisfed.org/graph/?g=p11T. ↩
- FRED, from the Federal Reserve Bank of St. Louis, is a resource for examining economic data and creating charts and tables. Most of the available data is data gathered from other sources, in this case the Bureau of Labor Statistics. FRED provides a consistent interactive interface to the data, and provides several ways to share the data. Start at https://fred.stlouisfed.org/. ↩

From Pachyderm: Envision and the Wichita Chamber of Commerce
From the Wichita Pachyderm Club this week: Michael Monteferrante. He is President and CEO of Envision, Inc. and Chairman of the Wichita Regional Chamber of Commerce. This audio presentation or podcast was recorded on September 6, 2019.
Shownotes

Wichita and other airports
How does the Wichita airport compare to others?
The nearby chart shows data starting in 2010 for Wichita and selected airports, as well as all U.S. airports. For all measures except load factor, Wichita is at or near the bottom. Often the trend for Wichita underperforms the other airports, too.
It is not too surprising that the Wichita airport lags others, as the Wichita economy has been underperforming, even losing jobs in 2017. Now we know that the metropolitan area and city proper have lost population.
Local business leaders have formed a campaign to promote using the airport. The statistics in this chart and the visualization end shortly before that campaign started.
This chart was created from a visualization holding data from TranStats, a service of the Bureau of Transportation Statistics (BTS), which is the independent statistical agency within the United States Department of Transportation (DOT). While monthly data is available, this visualization holds annual totals through 2018.
The visualization holds data for all U.S. airports with scheduled flights. To view and use the interactive visualization, click here.

Wichita and selected airports. Click for larger. 
New metropolitan rankings regarding knowledge-based industries and entrepreneurship
New research provides insight into the Wichita metropolitan area economy and dynamism.
The Walton Family Foundation has released a study titled “The Most Dynamic Metropolitans,” saying it is new research ranking the economic performance of metropolitan areas in the Heartland and across the country. 1
Of the study, the authors write “Our Most Dynamic Metropolitan Index, and the analysis contained in this report provides objective insight into the communities providing economic opportunity for their residents, separating high performers from the low. Most Dynamic Metropolitans provides fact-based metrics on near-term and medium-term performance and prospects for long-term growth. The index allows economic development officials the ability to monitor their metro’s vivacity relative to others on a national basis or within their region and state.”
In the overall rankings, Wichita was number 319 of 379 metropolitan areas examined. Of note, this research recognizes the importance of young firms:
While most of our metrics are commonly used indicators of economic development, the young firm employment ratio is a relatively new measure. We use factor analysis to test our hypothesis that the ratio is an indicator of longer-term economic growth. Factor analysis is a statistical tool that can derive categories, called factors, from several variables by finding the ways clusters of variables move together. A factor analysis on all of our metrics tells us that we generally have the two factors we claimed to have above: one closely relating to variables such as 2016-2017 growth in average annual pay and 2017-2018 job growth. The second most closely relating to per-capita personal income, 2013-2017 growth in real GDP, 2013-2017 average annual pay growth and the young firm employment ratio. Thus, our hypothesis regarding the young firm employment ratio seems valid.
There have been some rankings showing Wichita doing well in jobs at young firms. 2 That’s good, as young firms — which are different from small business — are vitally important to economic growth. 3
This study, however, shows Wichita lagging in young firm employment ratio. In these rankings, Wichita came in at position 247 of 379 metro areas. That is better than the overall ranking for Wichita, which is at number 319.
The young firm employment ratio is calculated using data from 2016. Perhaps newer data will show something different.
—
Notes- Walton Family Foundation. New Metropolitan Rankings Show Knowledge-Based Industries and Entrepreneurship Drive Success. June 10, 2019. Press release with links to documents available at https://www.waltonfamilyfoundation.org/about-us/newsroom/new-metropolitan-rankings-show-knowledge-based-industries-and-entrepreneurship-drive-success. ↩
- Weeks, Bob. Metro Monitor evaluates the Wichita economy. Available at https://wichitaliberty.org/economics/metro-monitor-evaluates-wichita-economy-2018/. ↩
- Jason Wiens and Chris Jackson. The Importance of Young Firms for Economic Growth. Available at https://www.kauffman.org/what-we-do/resources/entrepreneurship-policy-digest/the-importance-of-young-firms-for-economic-growth. ↩


