Tag: Wichita Chamber of Commerce
-

Wichita metro employment by industry
An interactive visualization of Wichita-area employment by industry.
-

From Pachyderm: Envision and the Wichita Chamber of Commerce
From the Wichita Pachyderm Club this week: Michael Monteferrante. He is President and CEO of Envision, Inc. and Chairman of the Wichita Regional Chamber of Commerce. This audio presentation or podcast was recorded on September 6, 2019.
-
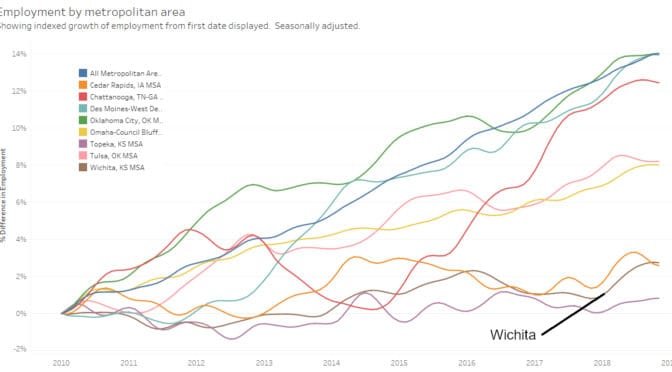
Metropolitan employment and labor force
A visualization of employment, labor force, and unemployment rate for metropolitan areas, now with data through May 2019.
-
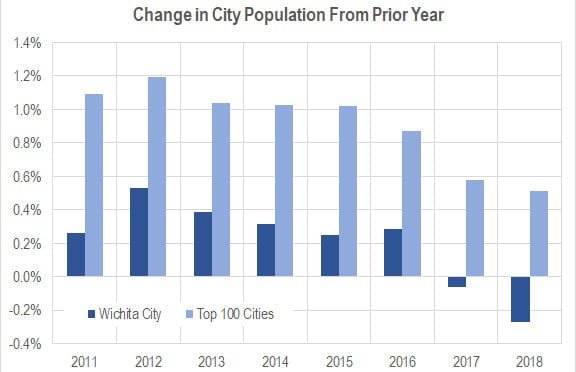
Wichita population, 2018
The City of Wichita lost 1,052 in population from 2017 to 2018, a decline of 0.27 percent.
-

Wichita personal income growing, but slowly
Among the nation’s 383 metropolitan areas, Wichita ranked 347th for personal income growth.
-

More Wichita planning on tap
We should be wary of government planning in general. But when those who have been managing and planning the foundering Wichita-area economy want to step up their management of resources, we risk compounding our problems.
-

State of the City, Wichita: The bright future
Wichita Mayor Jeff Longwell’s State of the City video doesn’t seem to be based on reality.
-
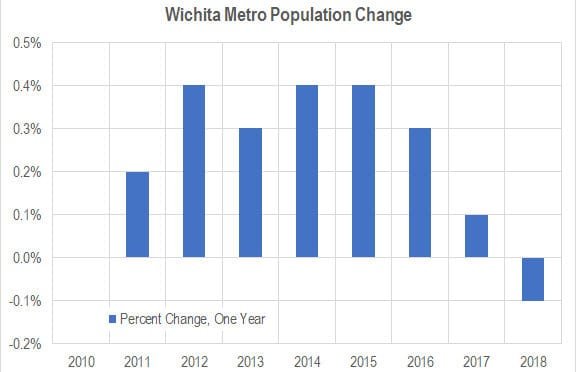
Wichita population falls; outmigration continues
The population of the Wichita MSA fell from 2017 to 2018, and net domestic migration continues at a high level.
-
Wichita mayor promotes inaccurate picture of local economy
Wichita city leaders will latch onto any good news, no matter from how flimsy the source. But they ignore the news they don’t like, even though it may come from the U.S. Census Bureau, U.S. Bureau of Labor Statistics, or U.S. Bureau of Economic Analysis.
-
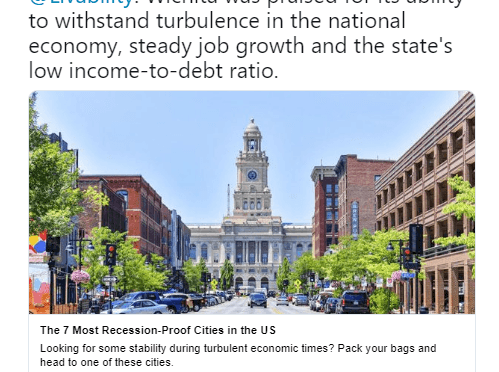
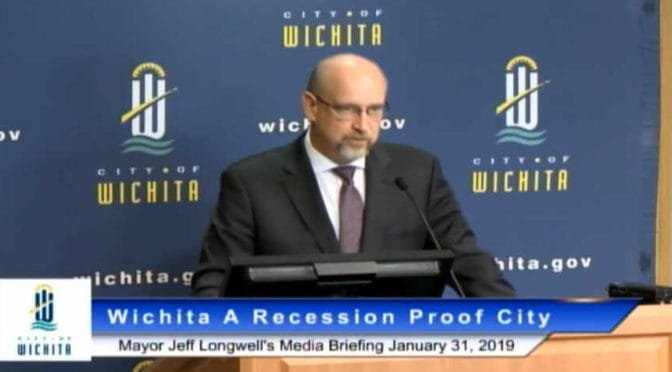
Wichita, a recession-proof city
Wichita city officials promote an article that presents an unrealistic portrayal of the local economy.
-

Wichita migration not improving
Data from the United States Census Bureau shows that the Wichita metropolitan area has lost many people to domestic migration, and the situation is not improving.
-
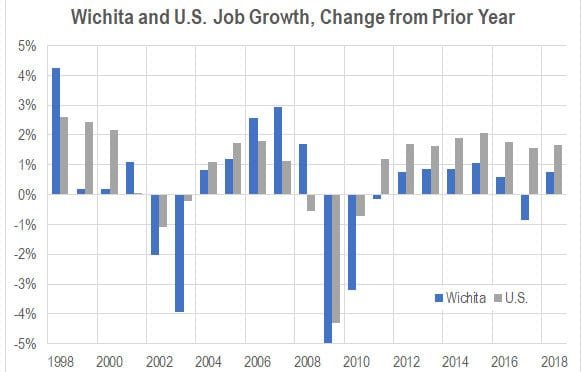
Wichita employment to grow in 2019
Jobs are forecasted to grow in Wichita in 2019, but the forecasted rate is low.