Tag: Wichita Chamber of Commerce
-

Large County Employment, Second Quarter 2023
Employment in large counties, including Sedgwick County and others of interest.
-
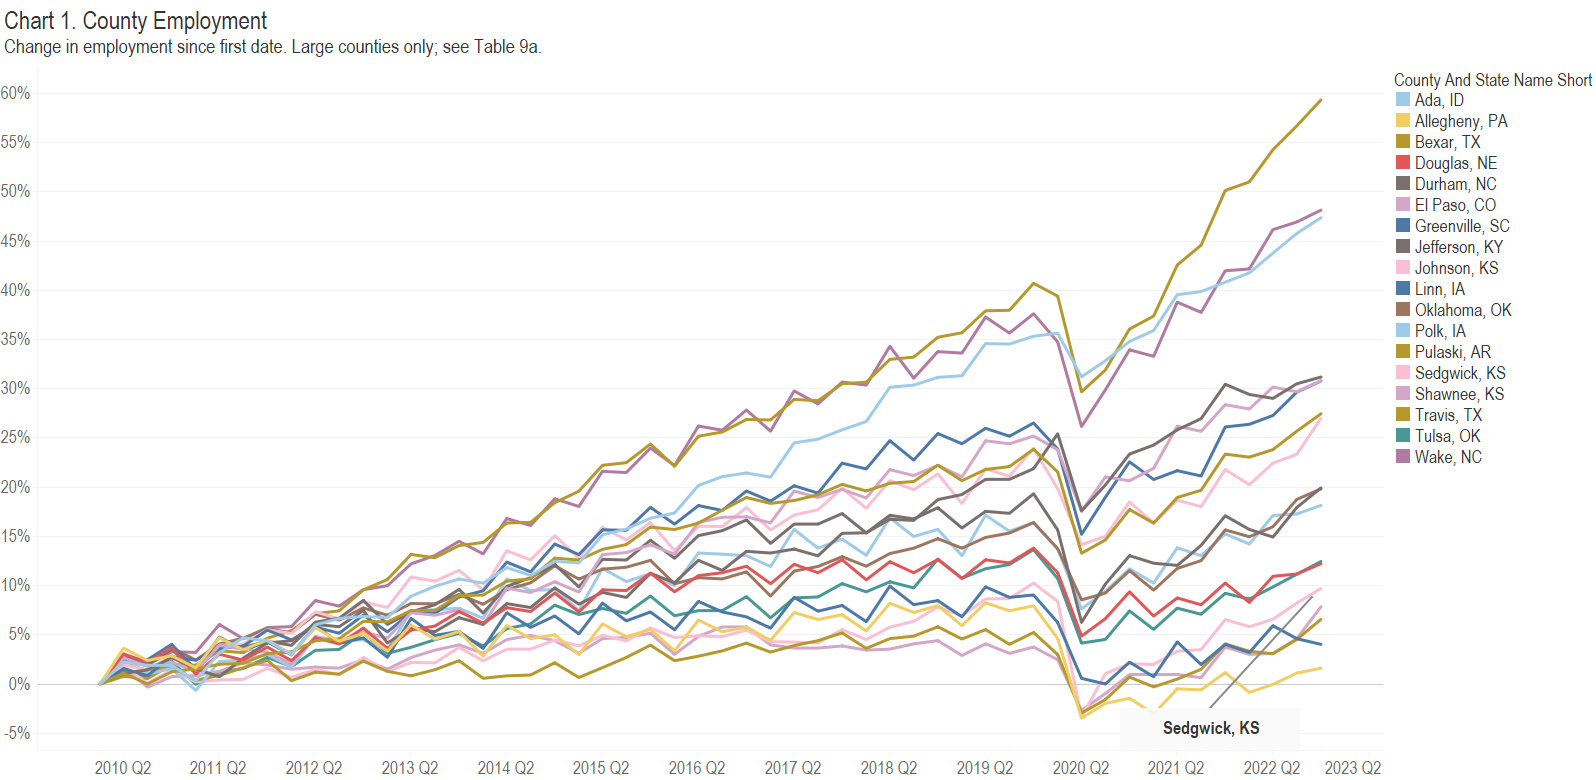
County Employment
Employment in large counties, including Sedgwick County and others of interest.
-
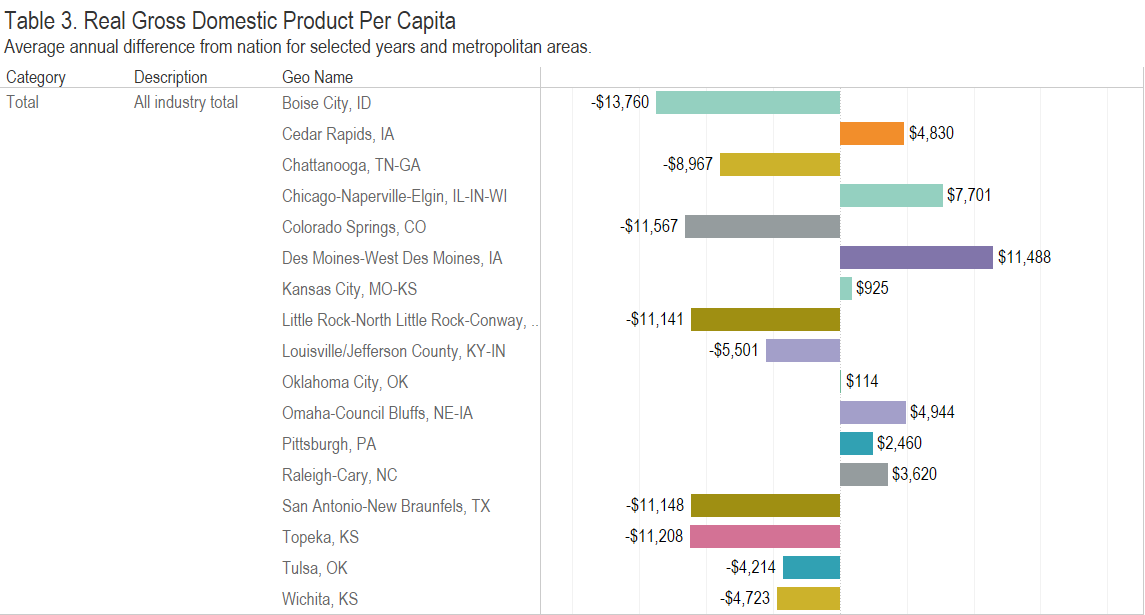
Gross Domestic Product in Metropolitan Areas
Examining the economy of metropolitan areas in an interactive visualization. Wichita examples included.
-
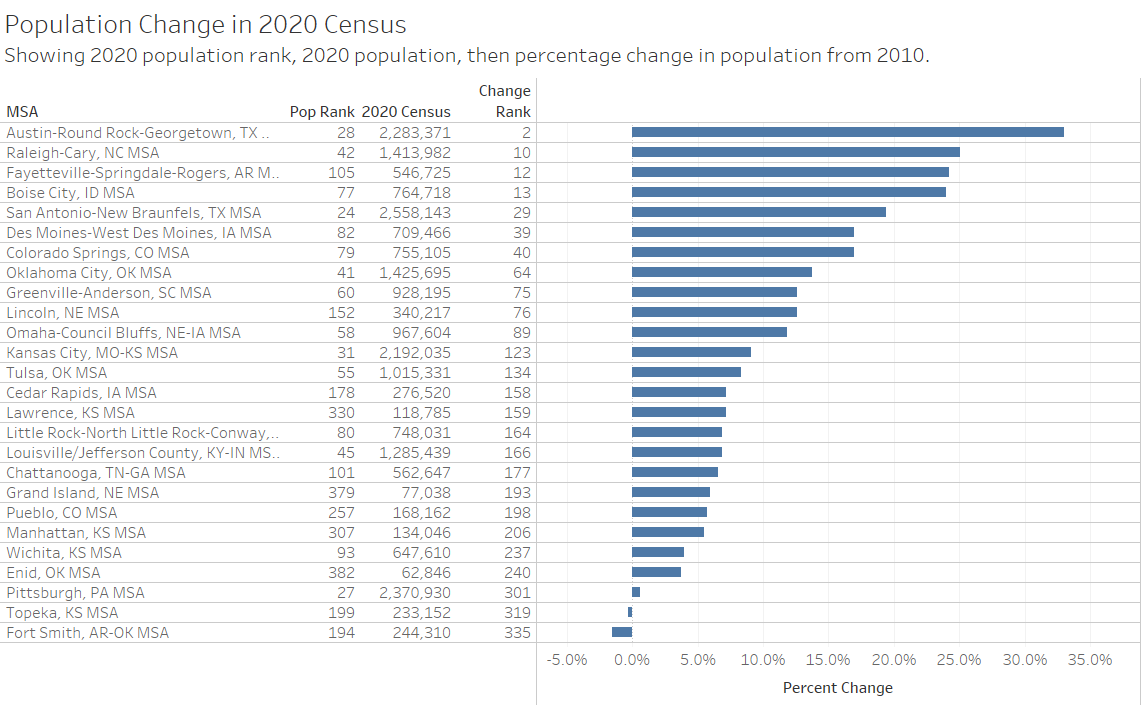
Wichita Population
The Wichita metro population grew from 2010 to 2020, but at a slow rate.
-
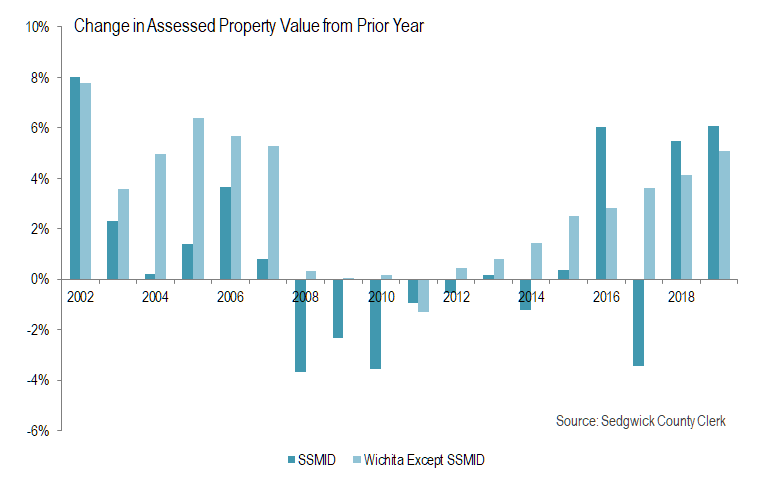
Downtown Wichita Tax Base
There’s been much investment in downtown Wichita. But it isn’t evident in the assessed value of property, although the recent trend is positive.
-
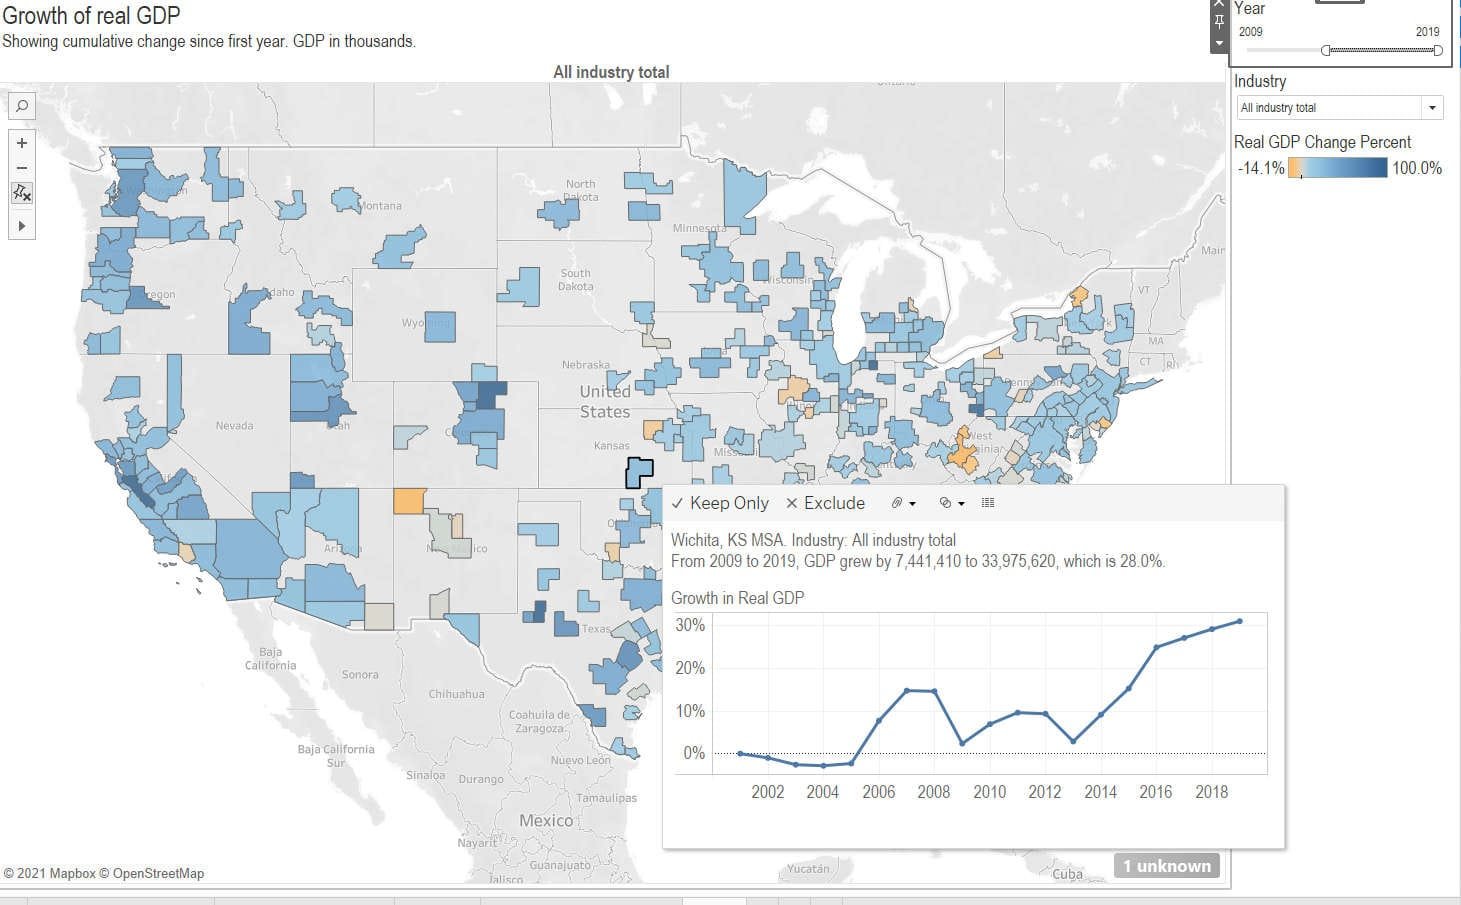
GDP by metropolitan area and component
An interactive visualization of gross domestic product by metropolitan area and industry.
-

Metropolitan employment and labor force
A visualization of employment, labor force, and the unemployment rate for metropolitan areas, now with data through May 2020.
-

Metropolitan employment and labor force
A visualization of employment, labor force, and unemployment rate for metropolitan areas, now with data through February 2020.
-

Sedgwick County talent attraction
In an index ranking counties in talent attraction, Sedgwick County has not performed well.
-

Wichita personal income grows
Wichita personal income grew at a faster rate in 2018.
-
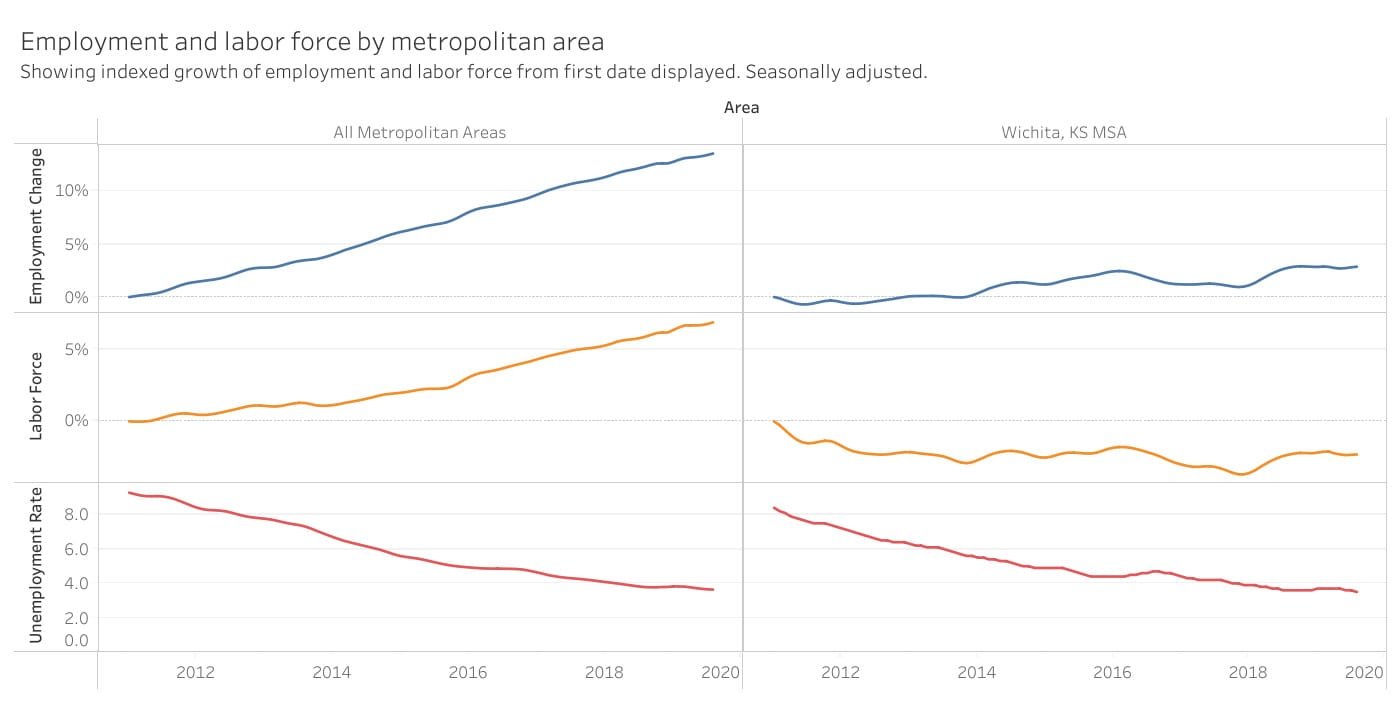
The cause of the low unemployment rate in Wichita
The unemployment rate for Wichita and the nation is nearly equal over the last eight years. Job growth for Wichita, however, has been much slower than the nation, and the labor force for Wichita is actually smaller than in January 2011. This is what has led to a low unemployment rate in Wichita: Slow job…
-

Wichita jobs and momentum
Given recent data and the CEDBR forecasts, Wichita’s momentum is a slowly growing economy, with the rate of growth declining.