Tag: Wichita and Kansas schools

  • Kansas school spending

    Kansas school spending

    Kansas school district spending, updated through 2020 and adjusted for inflation.

    What is the trend in Kansas school spending? This visualization presents several tables and illustrations of spending data. It is presented separately for each district, with a special district “State Totals – 999” being the sum of all districts. (more…)

  • Kansas school spending, through 2020

    Kansas school spending, through 2020

    Charts of Kansas school spending presented in different forms.

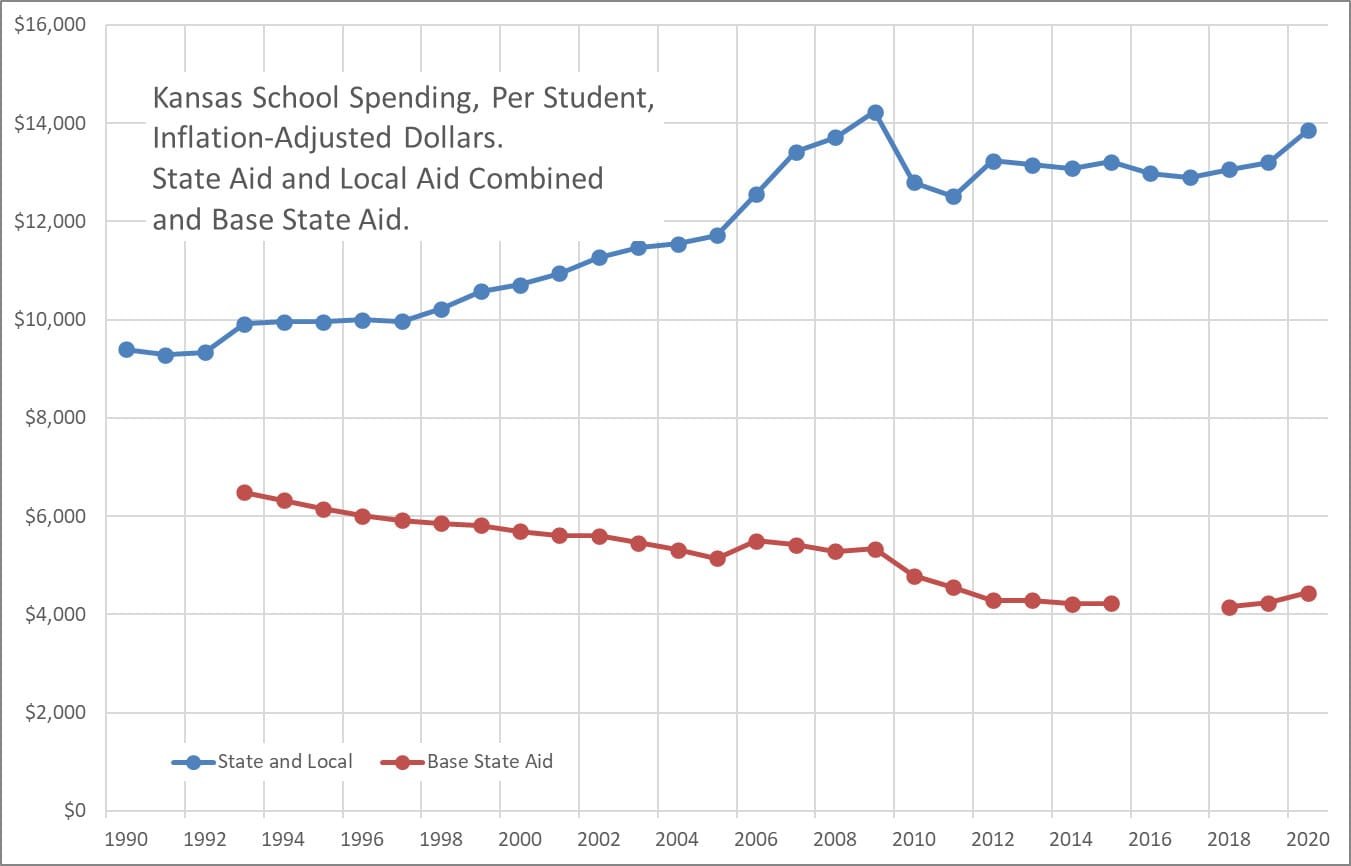
    Recently Kansas State Department of Education released spending figures for the 2020 school year, that is, the school year starting in 2019 and ending in 2020.

    One of the most important charts shows state spending per-pupil, adjusted for inflation. It shows the total of state and local spending, which is useful because in 2015 the state made a change in the way revenue is allocated between state and local sources. It also shows base state aid per pupil, which is an important number as it is the starting point for the school funding formula.

    Why is total state and local spending higher than base state aid? The answer is weightings. These are amounts that are added to the base to pay for things like at-risk children, English language learners, and other items. The value of weightings has grown over time, so as base state aid has generally fallen, total spending has generally risen.

    A second chart shows the ratio of total state and local spending to base state aid.

    This is not simply a technical matter. In discussions of school policy, sometimes only the base aid figure is used. As it has fallen, some formulate an argument that school spending has been cut. That is easily refuted by looking at total state and local spending.

    Of note, base state aid was not used in school years 2016 and 2017, which explains the gap in some of the series.

    I’ve gathered these charts and others and present them in a presentation. Use arrow keys to move through the charts. Click here to access.

    Kansas school spending, showing state and local aid compared to base state aid. Click for larger.

    Kansas school spending, showing ratio of state and local aid to base state aid. Click for larger.

  • Wichita property tax on commercial property: High

    Wichita property tax on commercial property: High

    An ongoing study reports that property taxes on commercial and industrial property in Wichita are high. In particular, taxes on commercial property in Wichita are among the highest in the nation.

    Click for larger.

    The study is produced by Lincoln Institute of Land Policy and Minnesota Center for Fiscal Excellence. It’s titled “50 State Property Tax Comparison Study” and may be read here. It uses a variety of residential, apartment, commercial, and industrial property scenarios to analyze the nature of property taxation across the country. I’ve gathered data from selected tables for Wichita.

    In Kansas, residential property is assessed at 11.5 percent of its appraised value. Commercial property is assessed at 25 percent of appraised value, and public utility property at 33 percent. (Appraised value is the market value as determined by the assessor. Assessed value is multiplied by the mill levy rates of taxing jurisdictions to compute tax.)

    This means that commercial property faces 2.104 times the property tax rate as residential property, according to this study. (1)The ratio of 25 to 11.5 is 2.174, so some small factors have a role. The U.S. average is 1.713. Whether higher assessment ratios on commercial property as compared to residential property is desirable public policy is a subject for debate. But because Wichita’s ratio is high, it leads to high property taxes on commercial property.

    For residential property taxes, Wichita ranks below the national average. For a property valued at $150,000, the effective property tax rate in Wichita is 1.19 percent, while the national average is 1.34 percent. The results for a $300,000 property were similar.

    Of note is the property taxes on a median-valued home. In this case, Wichita is a bargain, due to our lower housing prices. A home at the median value in Wichita pays $1,655 in taxes, while the nationwide average is $4,562. (The median home value in Wichita is $139,800 and for the nation, $326,392, according to this report.)

    Looking at commercial property, Wichita taxes are high. For example, for a $100,000 valued property, the study found that the national average for property tax is $2,206 or 1.84 percent of the property value. For Wichita the corresponding values are $3,229 or 2.69 percent, ranking seventh-highest among the 50 largest cities. Wichita property taxes are 46 percent higher than the national average, for this scenario.

    For industrial property taxes, the situation in Wichita is better, with Wichita ranking near the middle of the 50 largest cities. For an industrial property worth $1,000,000, taxes in Wichita are $29,372. The national average is $30,498.

    References

    References
    1The ratio of 25 to 11.5 is 2.174, so some small factors have a role.

  • Kansas school employment

    Kansas school employment

    Kansas school employment rose for the current school year.

    Figures released by the Kansas State Department of Education show the number of teachers and certified employees rose for the 2019-2020 school year.

    The number of Pre-K through grade 12 teachers rose to 31,337 from 31,153, an increase of 0.59 percent. Certified employees rose to 43,305 from 42,861, or by 1.04 percent. 1 These are not the only employees of school districts. 2

    Enrollment rose from 476,482 to 477,032, or 0.12 percent. As a result, the ratio of teachers to students was unchanged (measured to two decimal places), and the ratio of certified employees to students fell.

    The relative change in enrollment and employment is not the same in every district. To help Kansas learn about employment trends in individual school districts, I’ve gathered the numbers from the Kansas State Department of Education and present them in an interactive visualization. Click here to use it.

    Photo credit: unsplash-logoElement5 Digital


    Notes

    1. According to KSDE, certified employees include Superintendent, Assoc./Asst. Superintendents, Administrative Assistants, Principals, Assistant Principals, Directors/Supervisors Spec. Ed., Directors/Supervisors of Health, Directors/Supervisors Career/Tech Ed, Instructional Coordinators/Supervisors, All Other Directors/Supervisors, Other Curriculum Specialists, Practical Arts/Career/Tech Ed Teachers, Special Ed. Teachers, Prekindergarten Teachers, Kindergarten Teachers, All Other Teachers, Library Media Specialists, School Counselors, Clinical or School Psychologists, Nurses (RN or NP only), Speech Pathologists, Audiologists, School Social Work Services, and Reading Specialists/Teachers. Teachers include Practical Arts/Vocational Education Teachers, Special Education Teachers, Pre-Kindergarten Teachers, Kindergarten Teachers, Other Teachers, and Reading Specialists/Teachers. See Kansas State Department of Education. Certified Personnel. http://www.ksde.org/Portals/0/School%20Finance/reports_and_publications/Personnel/Certified%20Personnel%20Cover_State%20Totals.pdf.
    2. There are also, according to KSDE, non-certified employees, which are Assistant Superintendents, Business Managers, Business Directors/Coordinators/Supervisors, Other Business Personnel, Maintenance and Operation Directors/Coordinators/Supervisors, Other Maintenance and Operation Personnel, Food Service Directors/Coordinators/Supervisors, Other Food Service Personnel, Transportation Directors/Coordinators/Supervisors, Other Transportation Personnel, Technology Director, Other Technology Personnel, Other Directors/Coordinators/Supervisors, Attendance Services Staff, Library Media Aides, LPN Nurses, Security Officers, Social Services Staff, Regular Education Teacher Aides, Coaching Assistant, Central Administration Clerical Staff, School Administration Clerical Staff, Student Services Clerical Staff, Special Education Paraprofessionals, Parents as Teachers, School Resource Officer, and Others. See Kansas State Department of Education. Non-Certified Personnel Report. http://www.ksde.org/Portals/0/School%20Finance/reports_and_publications/Personnel/NonCertPer%20Cov_St%20Totals.pdf.
  • Performance levels in Wichita schools

    Performance levels in Wichita schools

    There is some good news in the performance level reports for Wichita public schools.

    Since 2015, Kansas test scores have been reported in a new way. Kansas State Department of Education explains:

    Kansas assessment results are now reported in four levels.

    Level 1 indicates that a student shows a limited ability to understand and use the mathematics skills and knowledge needed for college and career readiness.

    Level 2 indicates that a student shows a basic ability to understand and use the mathematics skills and knowledge needed for college and career readiness.

    Level 3 indicates that a student shows an effective ability to understand and use the mathematics skills and knowledge needed for college and career readiness

    Level 4 indicates that a student shows an excellent ability to understand and use the mathematics skills and knowledge needed for college and career readiness.

    For USD 259, the Wichita public school district, the trend is that an increasing proportion of students are at performance level 1 until this year, when the percent at performance level 1 fell to 46.1 percent from 47.0 percent. This chart holds the values.

    The percent at performance level 2 or better rose from 34.4 percent last year to 35.9 percent this year.

    The percent at performance level 3 or better fell to 13.7 percent from 14.3 percent the previous year.

    The percent at performance level 4 rose to 4.4 percent from 4.2 percent the previous year.

    Click here for a larger version of the following chart.

  • Kansas school salaries

    Kansas school salaries

    Kansas school salaries, visualized.

    This is an interactive visualization of Kansas school salaries for superintendents, principals, and teachers, for each school district.

    To learn more about the data and use the visualization, click here. Following, an example from the visualization.

    Click for larger.
  • Wichita public schools, by the charts

    Wichita public schools, by the charts

    Data from the annual report for the 2018-2019 school year for USD 259, the Wichita, Kansas public school district.

    The Comprehensive Annual Financial Report for USD 259, the Wichita public school district, provides a look at trends over the years. The document, along with those from previous years, is available here. Here are some highlights from the CAFR for the year ending June 30, 2019, known as fiscal year 2019. The CAFR was released in December 2019.

    (Click charts for larger versions.)

    The following chart shows data from the CAFR along with my calculations. I took two data series, “total revenue” and “sum of state and local revenue,” then divided by FTE enrollment and adjusted for inflation. (The inflation adjustments cast past dollar values in terms of current-dollar equivalents, meaning past values are usually reduced.) I plot the sum of state and local revenue because in 2015 there was a change in the way some taxes were allocated. Plotting the sum of the two removes the effect of the change.

    While USD 259 — and schools generally — complain about funding cuts, the following chart shows funding nearly always increases, and over time, by quite a bit.

    The following chart shows spending categorized by “instruction” and “instructional support” per student in inflation-adjusted dollars. Capital spending is not included in this chart.

    In 2006, USD 259 spent $571 per student (inflation-adjusted) on administration. For 2019 the figure is $904. Could the Wichita public school district cut administration spending to 2006 levels, on a per-student, inflation-adjusted basis?

    The Wichita school district has been able to reduce its student/teacher ratios substantially over the last ten to fifteen years. (Student/teacher ratio is not the same statistic as class size.) There have been ups and downs along the way, but for all three school levels, the ratios are lower than they were years ago, and by substantial margins. This means that Wichita schools have been able to increase the employment of teachers at a faster rate than enrollment has risen.

    On enrollment, the superintendent’s letter says this:

    Budget reduction measures, stagnant population growth and changes to Kindergarten funding at the state level have all contributed to a decreasing enrollment trend which began in FY’16. Enrollment losses have primarily been at the elementary level. Those losses have been somewhat offset by increases in secondary enrollment, virtual and alternative programs. The elementary enrollment decline continued into FY’20, with a decrease of almost 800 elementary students. Once again, secondary enrollment offset some of this loss, increasing more than 350 students. The declines in past few years can partially be attributed to cost-cutting measures under the block grant, including denial of out-of-district students, the consolidation of alternative high school programs, and the combination of a longer school day and shorter school year, which many parents viewed as negatively impacting their students. Further, now that the State fully funds all-day Kindergarten, parents who used to enroll students in the District to obtain all-day Kindergarten services can now receive those same services in the surrounding area districts. Additional FY’19 funding allowed the District to return to the longer school year, but that action did not bring back elementary students to the District for FY’ZO. The District has instituted several promotion and program initiatives to attract students to the District, but it remains unclear if this will be continuing trend in the years to come.

    In the previous year’s report, there was this commentary on enrollment:

    The District’s enrollment trend over the last ten years has reflected an average increase of over 100 students a year. However, budget reduction measures and changes to Kindergarten funding at the state level are beginning to impact this trend. In FY’17, official enrollment decreased by 572 students, or one percent. Official enrollment in FY’18 increased by 80 students, but gains in virtual and alternative programs were offset by a significant decrease in elementary age students. The elementary enrollment decline continued into FY’19, with a loss of over 500 elementary students. Offsetting some of this loss, Secondary enrollment increased by 240 students. The declines in past few years can partially be attributed to cost-cutting measures under the block grant, including denial of out-of-district students, the consolidation of alternative high school programs, and the combination of a longer school day and shorter school year, which many parents viewed as negatively impacting their students. Further, now that the State fully funds all-day Kindergarten, parent who used to enroll students in the District to obtain all-day Kindergarten services can now receive those same services in the surrounding area districts. Additional FY’19 funding allowed the District to return to the longer school year, but it remains unclear if this action will bring back elementary students to the District.’

    Since 2015, Kansas test scores have been reported in a new way. Kansas State Department of Education explains:

    Kansas assessment results are now reported in four levels. Level 1 indicates that a student shows a limited ability to understand and use the mathematics skills and knowledge needed for college and career readiness. Level 2 indicates that a student shows a basic ability to understand and use the mathematics skills and knowledge needed for college and career readiness. Level 3 indicates that a student shows an effective ability to understand and use the mathematics skills and knowledge needed for college and career readiness. Level 4 indicates that a student shows an excellent ability to understand and use the mathematics skills and knowledge needed for college and career readiness.

    For Wichita, the trend is that an increasing proportion of students are at performance level 1 until this year when the percent at performance level 1 fell to 46.1 percent from 47.0 percent.

    Following, a chart of the portion of Wichita public school students testing at performance level 1, the lowest level.

    Following, for performance level 2 or better, indicating, “a student shows a basic ability to understand and use the mathematics skills and knowledge needed for college and career readiness.” The percent at performance level 2 or better rose from 34.4 percent last year to 35.9 percent this year.

    Following, for performance level 3 or better, indicating, “a student shows an effective ability to understand and use the mathematics skills and knowledge needed for college and career readiness.” The percent at this level fell to 13.7 percent from 14.3 percent the previous year.

    Following, for performance level 4, indicating, “a student shows an excellent ability to understand and use the mathematics skills and knowledge needed for college and career readiness.” The percent at this level rose to 4.4 percent from 4.2 percent the previous year.

    Following, charts of suspensions and expulsions.

  • Kansas sees large drop in test scores

    Kansas sees large drop in test scores

    Using demographically-adjusted scores, Kansas falls in state rankings of National Assessment of Educational Progress (NAEP).

    The U.S. Department of Education, through the National Center for Education Statistics (NCES), conducts the National Assessment of Educational Progress (NAEP) every other year. Known as “The Nation’s Report Card,” it is “the largest nationally representative and continuing assessment of what America’s students know and can do in various subject areas.”

    The results for 2019 were released last week, and Kansas does not do well. Looking at state rankings, here are the findings based on demographically-adjusted scores.

    Grade 4 math: In 2017, Kansas ranked 16. In 2019, Kansas ranked 30.
    Grade 8 math: In 2017, Kansas ranked 14. In 2019, Kansas ranked 24.
    Grade 4 reading: In 2017, Kansas ranked 20. In 2019, Kansas ranked 34.
    Grade 8 reading: In 2017, Kansas ranked 16. In 2019, Kansas ranked 26.

    The adjusted scores are from the Urban Institute, America’s Gradebook: How Does Your State Stack Up?

    In a compilation by Matthew M. Chingos published in Education Next, the author notes:

    Change is generally more interesting than stability, and there are certainly examples of states moving up and down the rankings between 2017 and 2019. The table below shows the top and bottom five states in terms of their improvement (or decline) in the demographically adjusted rankings across all four NAEP tests. Four of the five states that moved up most in the rankings are in the South, compared to none of those in the bottom (which are otherwise spread across the country).

    Looking at change across all four tests, Kansas had the largest drop in state rankings except for New Hampshire.

  • From Pachyderm: Wichita school board candidates

    From Pachyderm: Wichita school board candidates

    From the Wichita Pachyderm Club this week: Candidates for the board of USD 259, the Wichita public school district. This was recorded October 4, 2019.

    In board district 3, incumbent Ernestine Krehbiel is running unopposed, so this event did not include that district.

    In board district 4, the candidates are James W. Kilpatrick, Jr. and Stan Reeser (incumbent).

    For the at-large board district, which covers the entire school district, the candidates are Sheril Logan (incumbent) and Joseph Shepard.

    Of note, the boundaries of the Wichita school district are not the same as the City of Wichita boundaries. Substantial parts of the city lie in other districts such as the Maize, Goddard, Andover, and Derby school districts, while the Wichita school district includes all or parts of Bel Aire, Kechi, and Park City.

    Also, while candidates for a specific school board district must live within that district and represent that district, voters in the entire Wichita school district will see the candidates for all board districts on their ballot, and may vote in each contest.

    The district offers this map.

    Shownotes

    From left: Joseph Shepard, Stan Reeser, James Kilpatrick, and Sheril Logan.