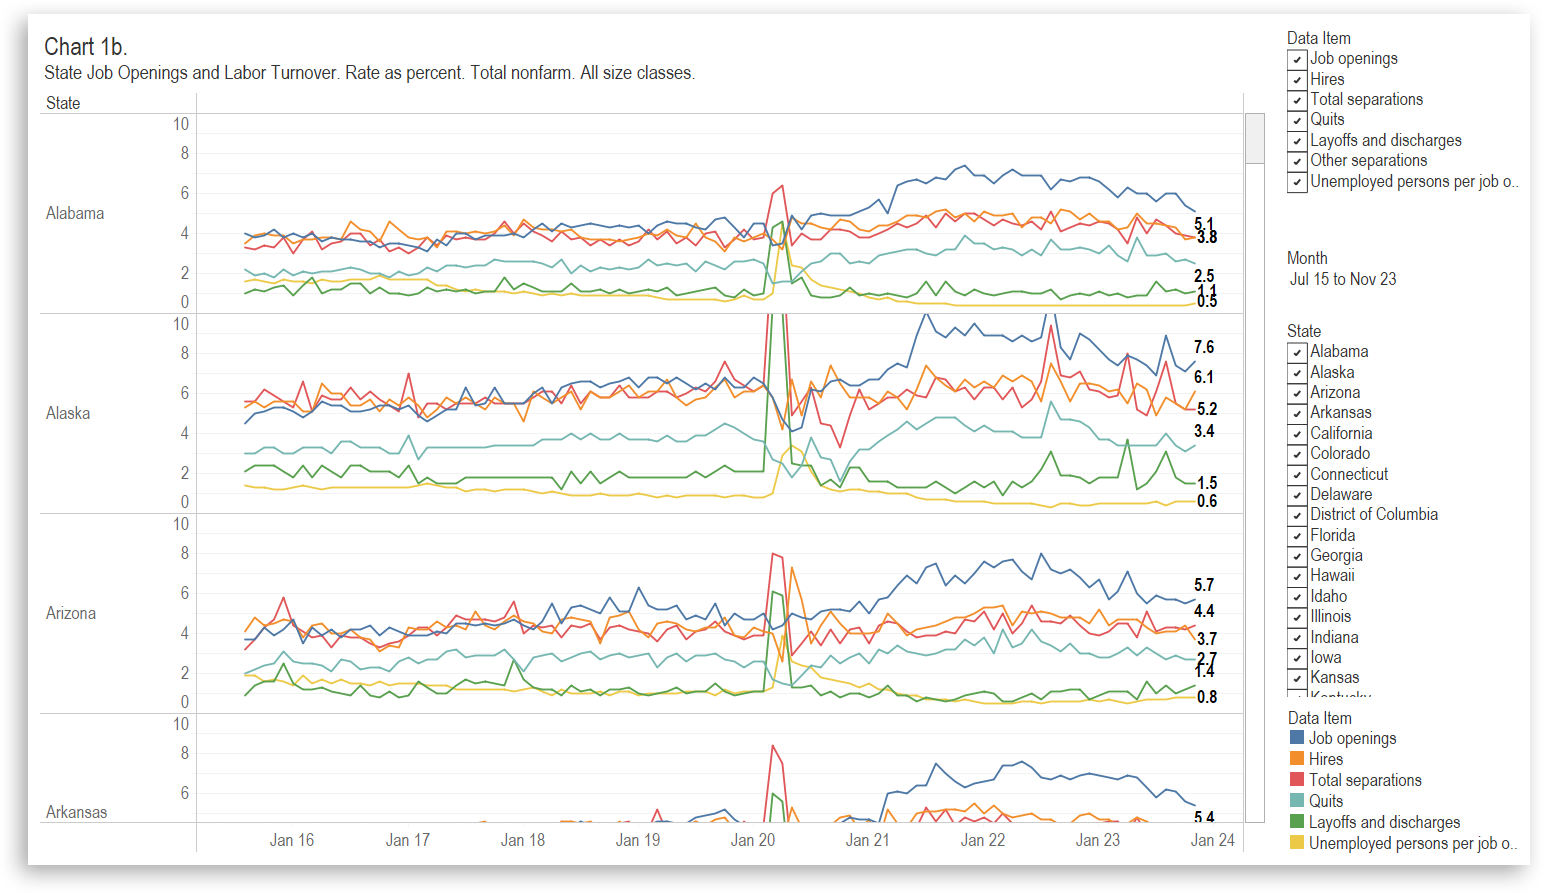
Data on monthly job turnover in the states and presented in an interactive visualization. (more…)
Tag: Visualizations
Following are visualizations of data. Many are interactive and created using Tableau Public. In some cases I’ve recorded myself using the visualization to tell a story, and all you have to do is watch.

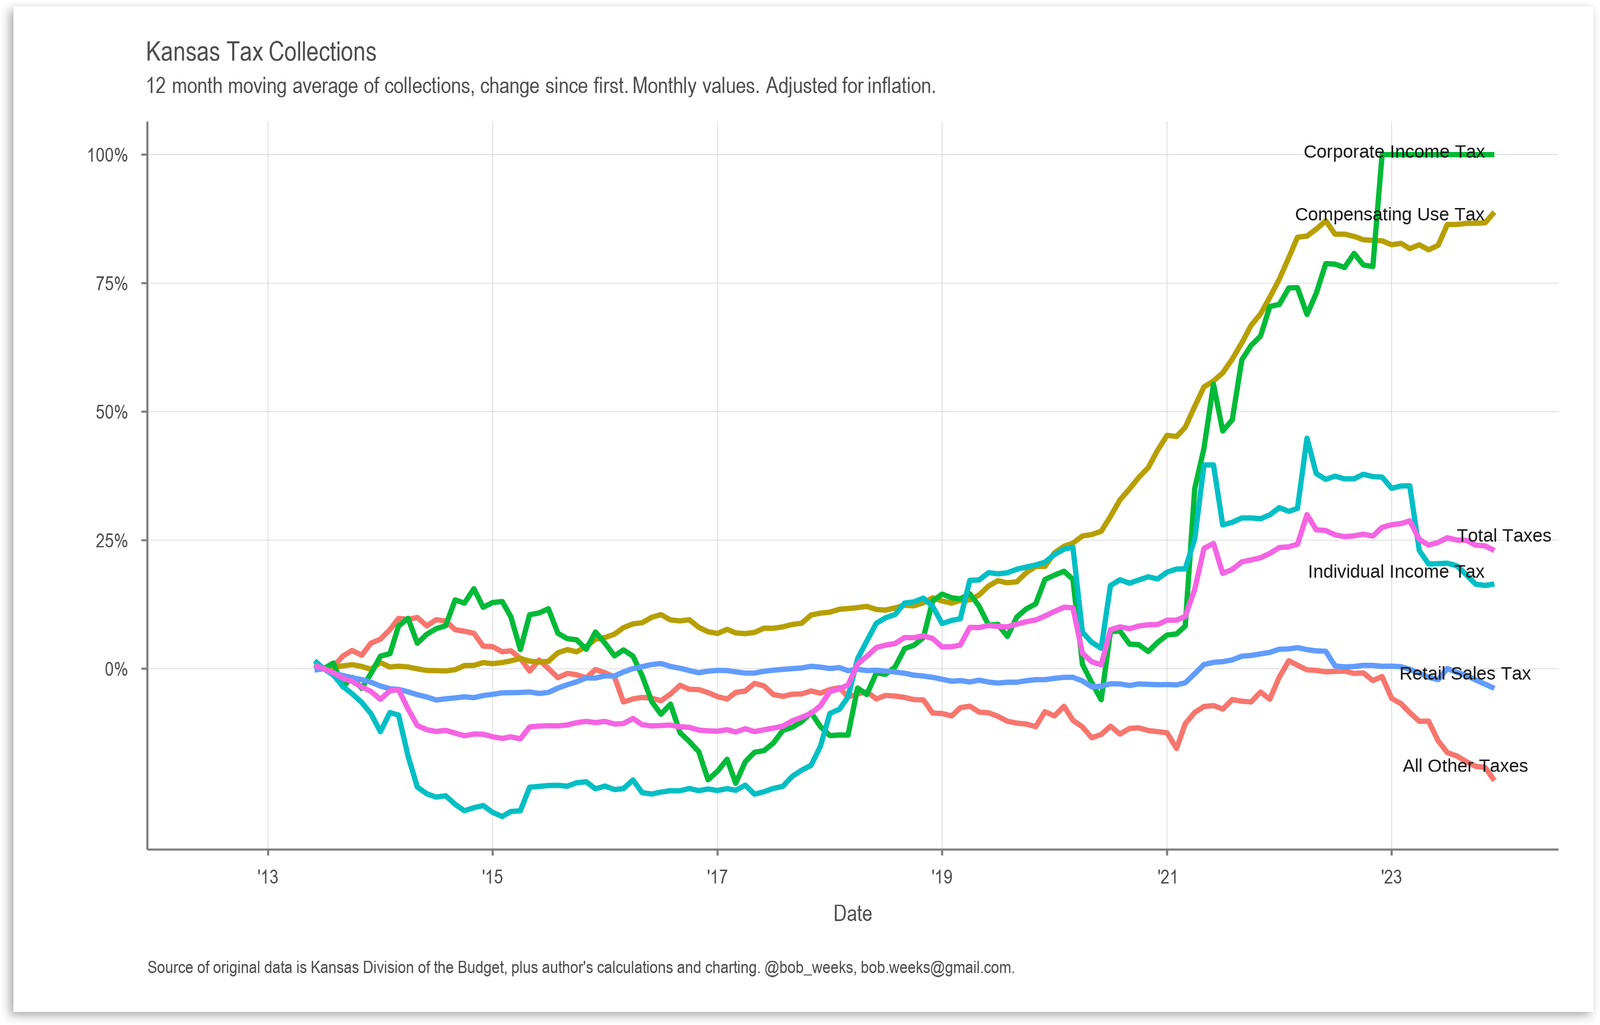
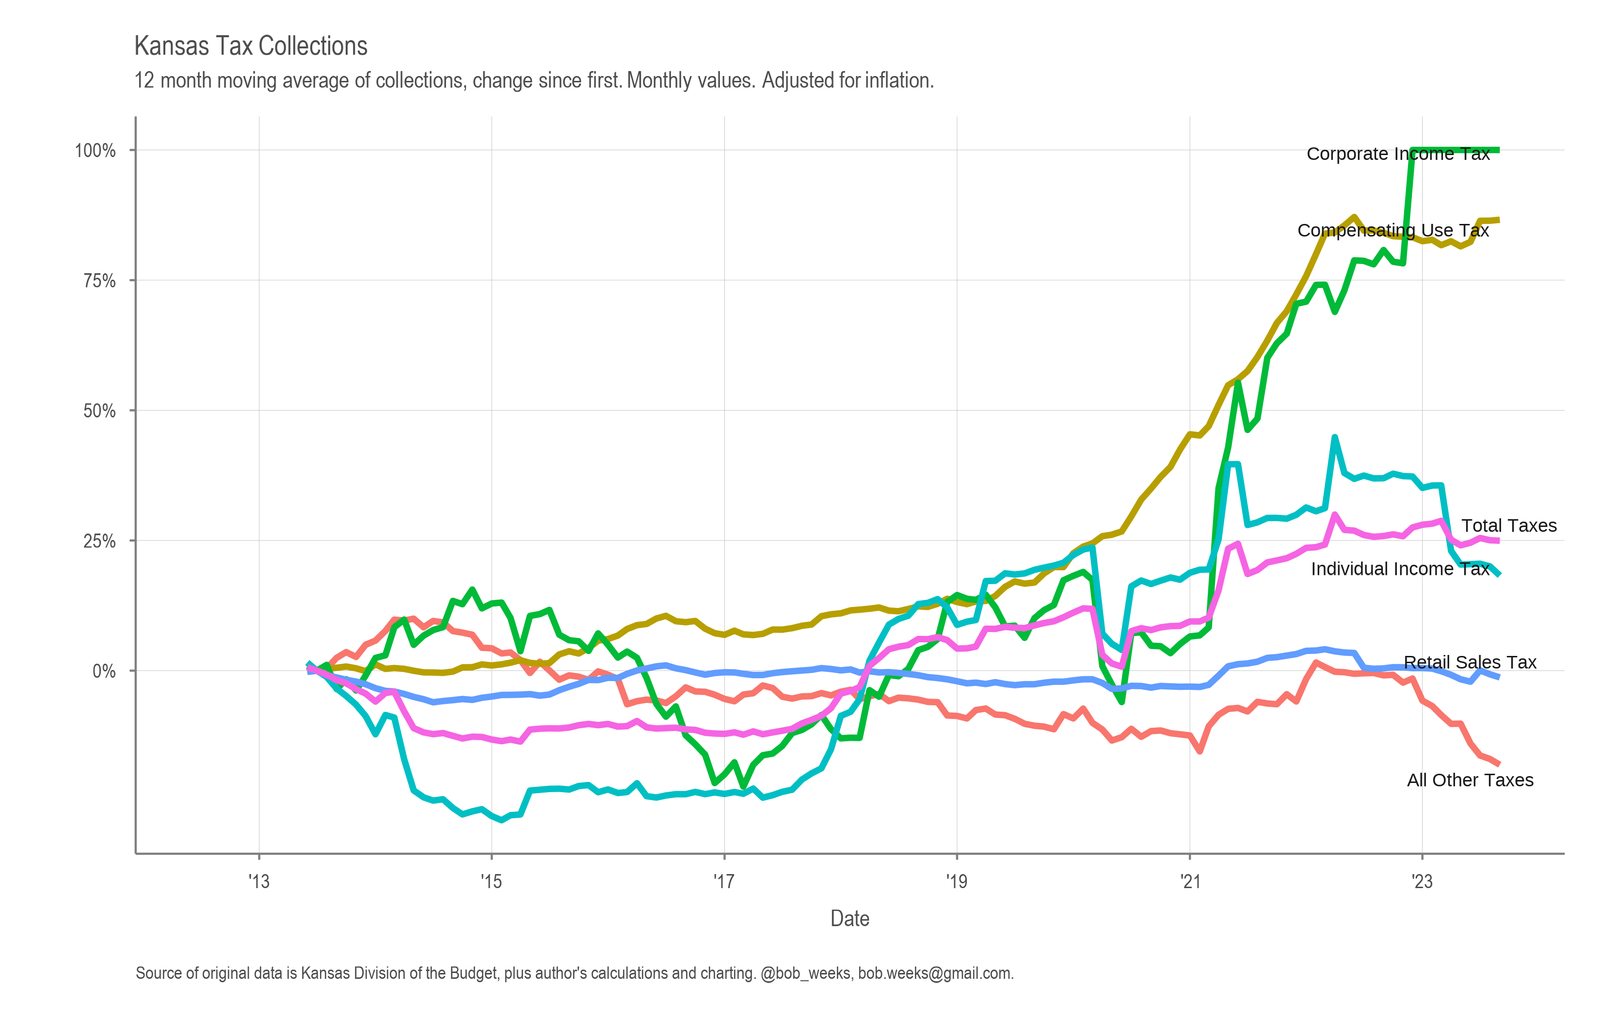
Kansas Tax Revenue, December 2023
For December 2023, Kansas tax revenue was 3.8 percent lower than December 2022, and 3.4 percent lower than estimated. (more…)

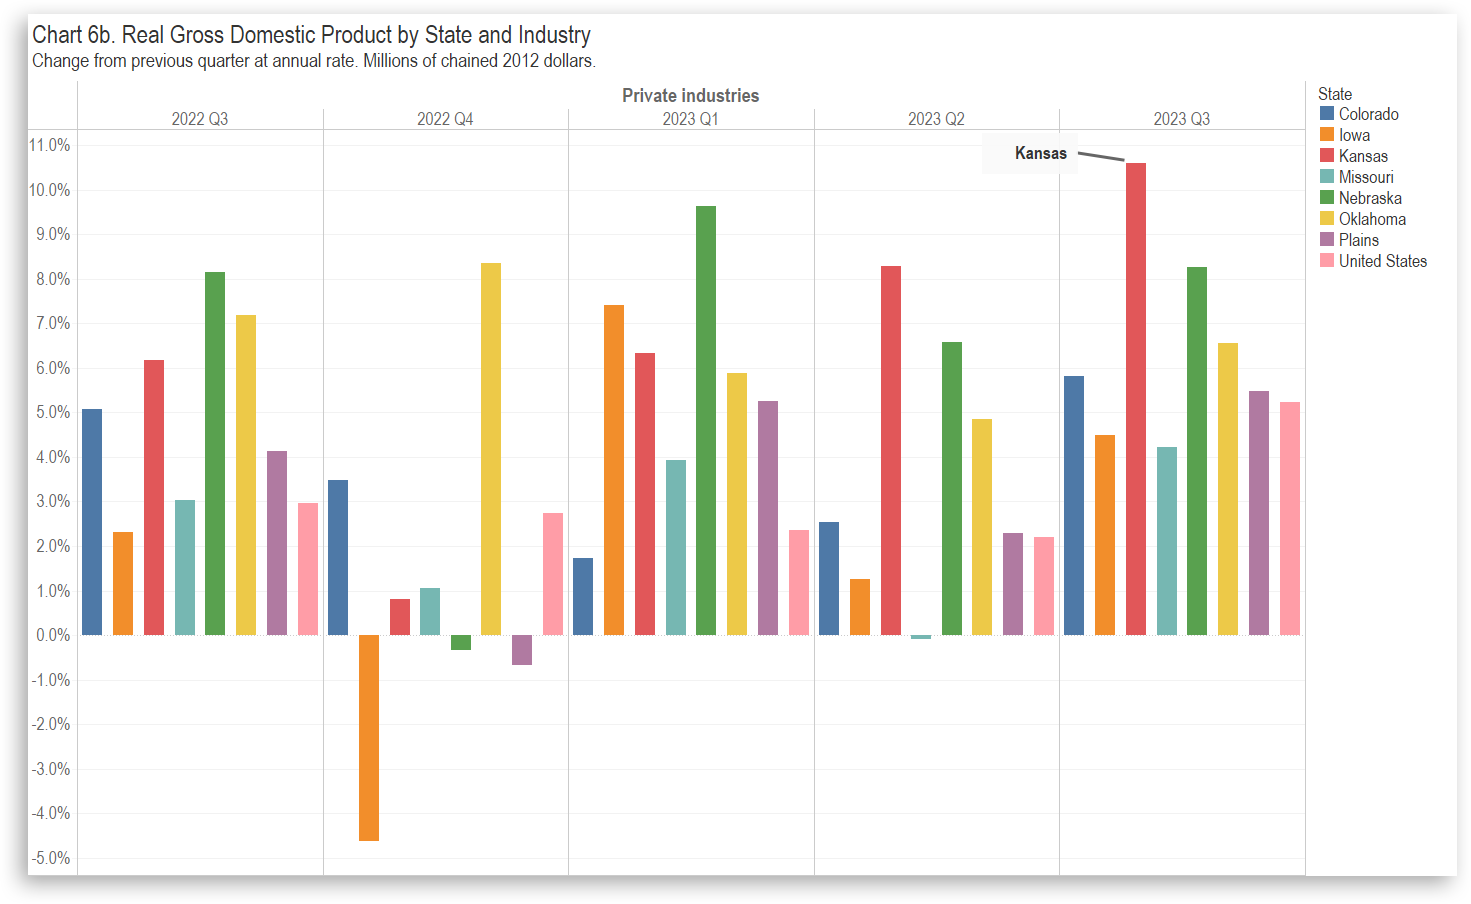
Kansas GDP, Third Quarter of 2023
In the third quarter of 2023, the Kansas economy grew at the annual rate of 9.7 percent. Real Gross Domestic Product rose in all states, with Kansas ranking first. (more…)

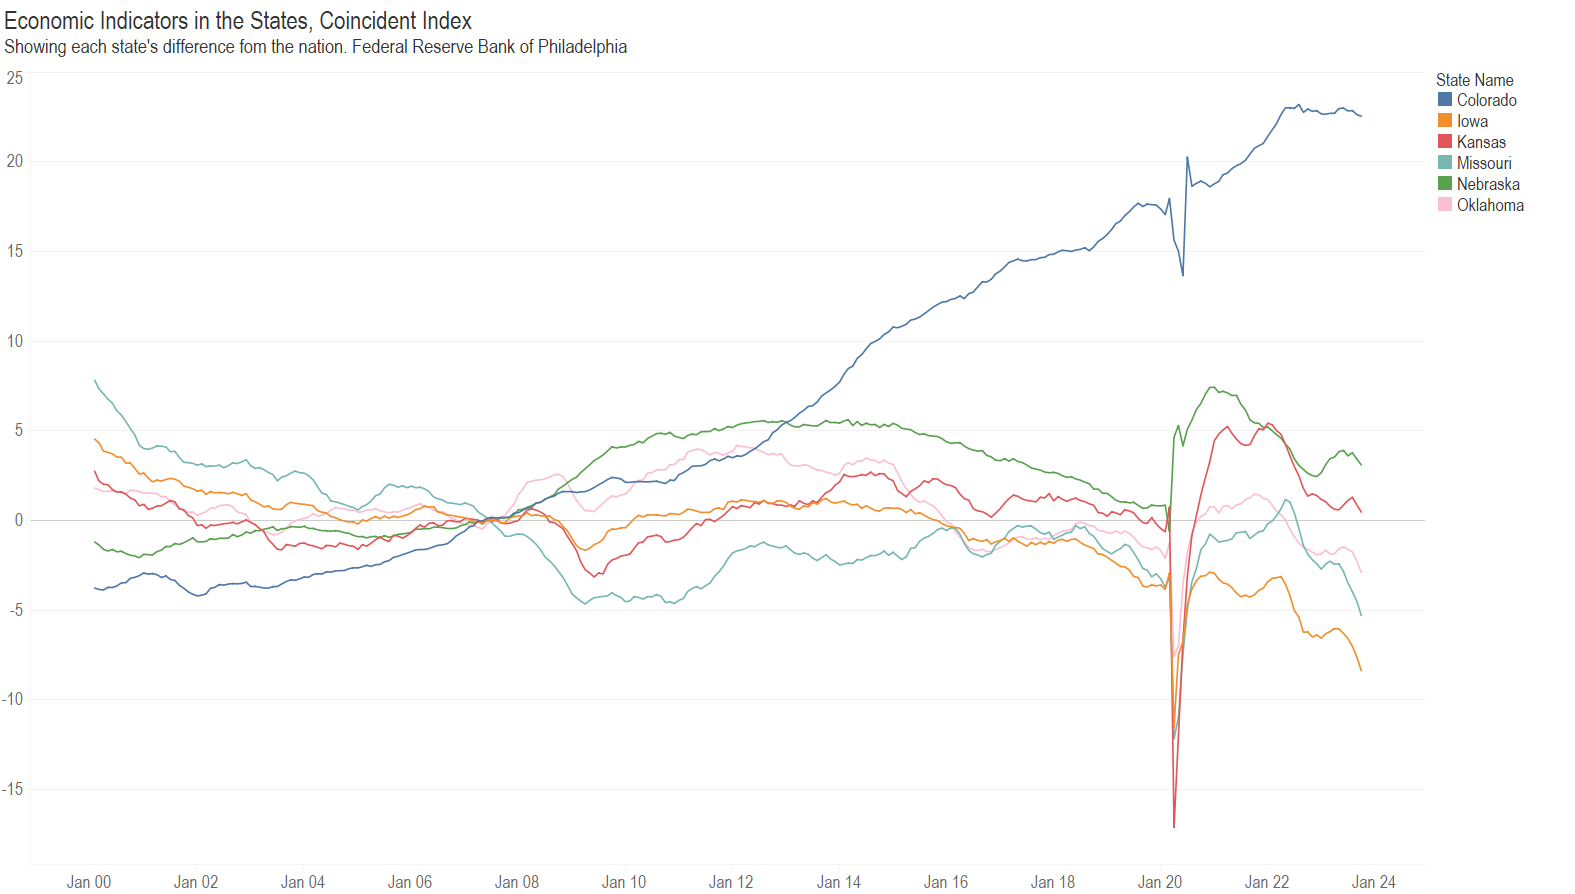
Economic Indicators in the States
A visualization of coincident economic indicators for the states. (more…)

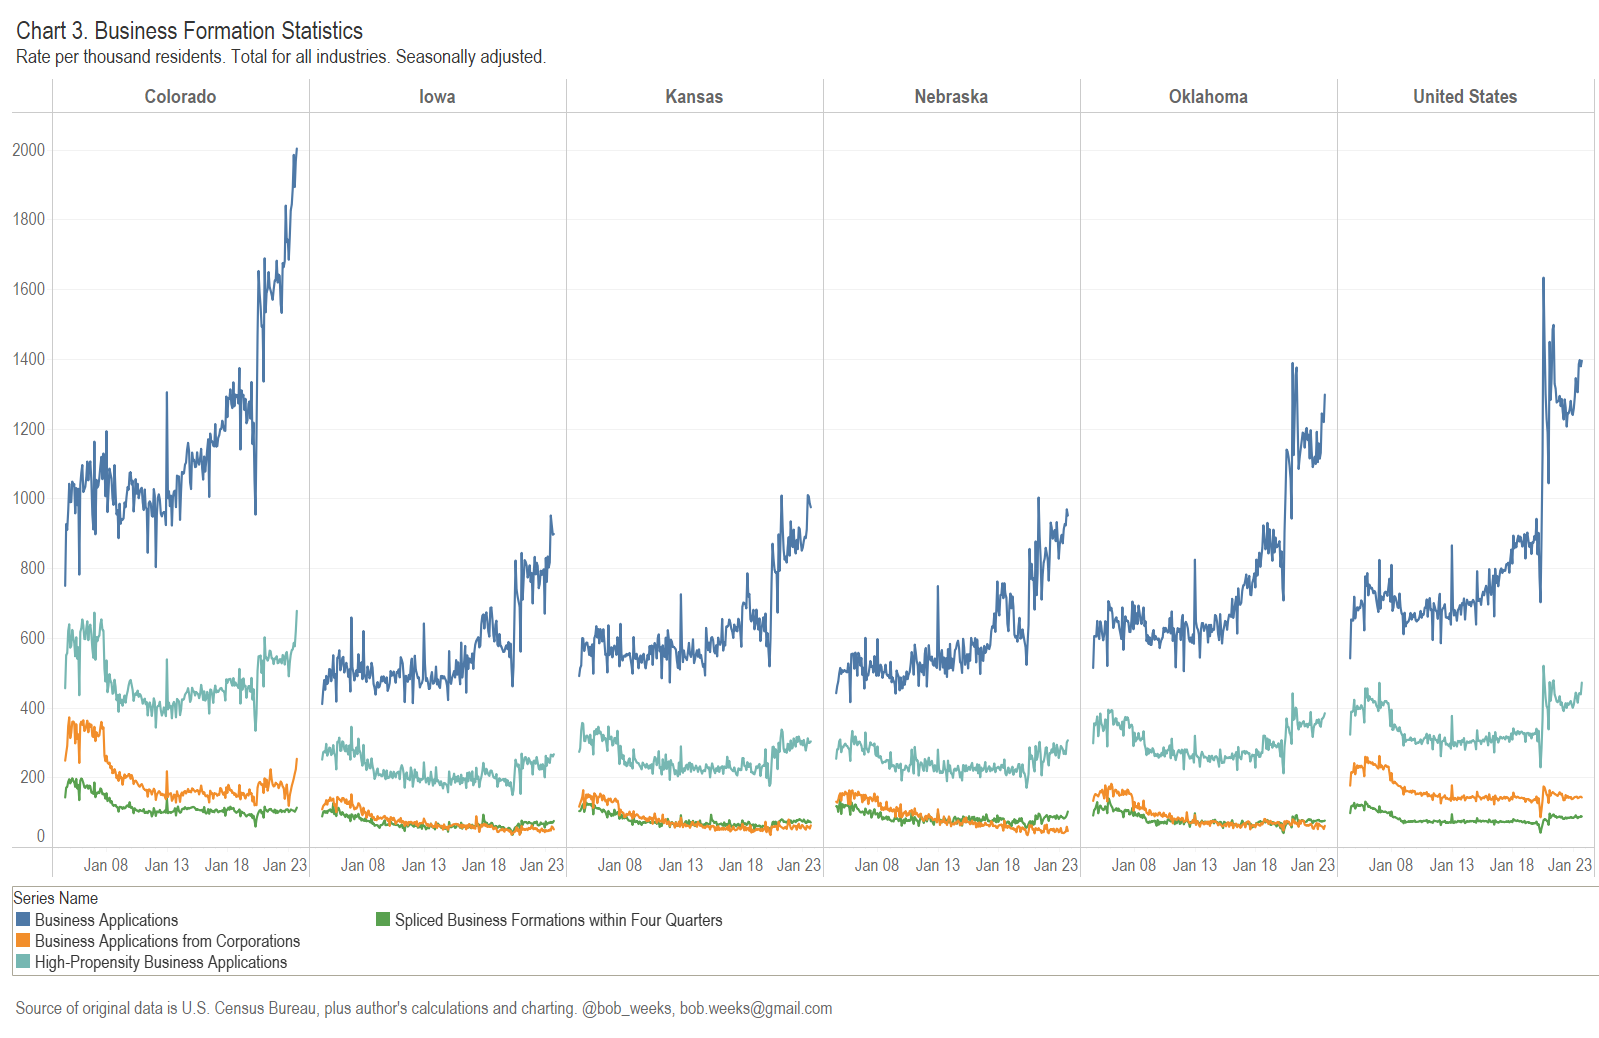
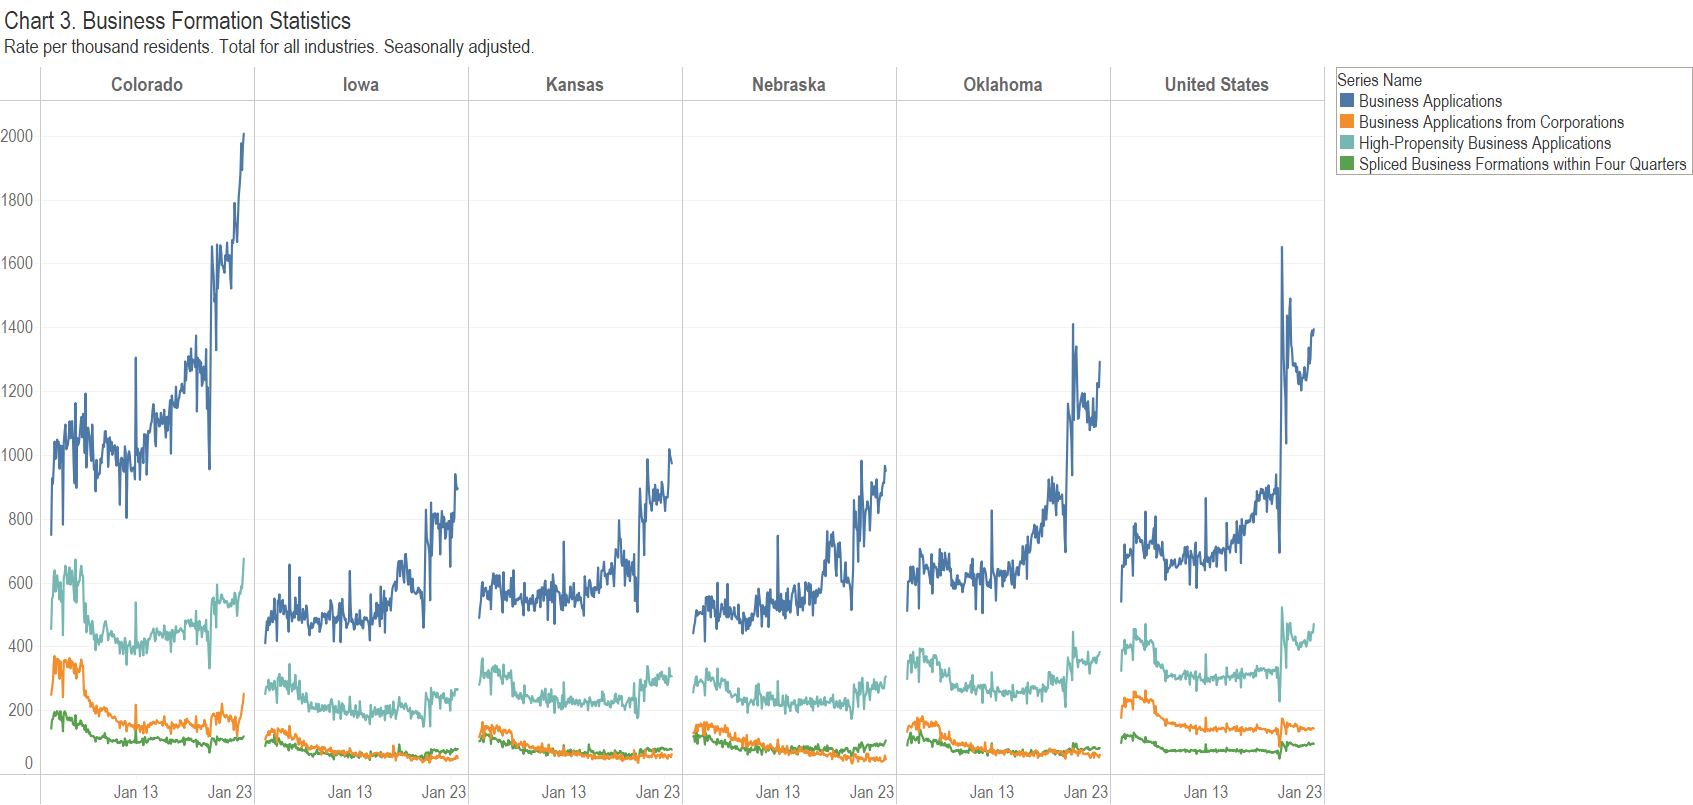
Business Formation in Kansas
For both business applications and business formations, Kansas does better than some states, but lags many states and the nation. (more…)

Kansas Tax Revenue, October 2023
For October 2023, Kansas tax revenue was 7.4 percent lower than October 2022, and 4.1 percent lower than estimated. (more…)

Business Formation in Kansas
For both business applications and business formations, Kansas does better than some states, but lags many states and the nation. (more…)
Kansas Tax Revenue, September 2023
For September 2023, Kansas tax revenue was 3.2 percent lower than September 2022, and 4.4 percent higher than estimated. (more…)