Tag: Visualizations
-
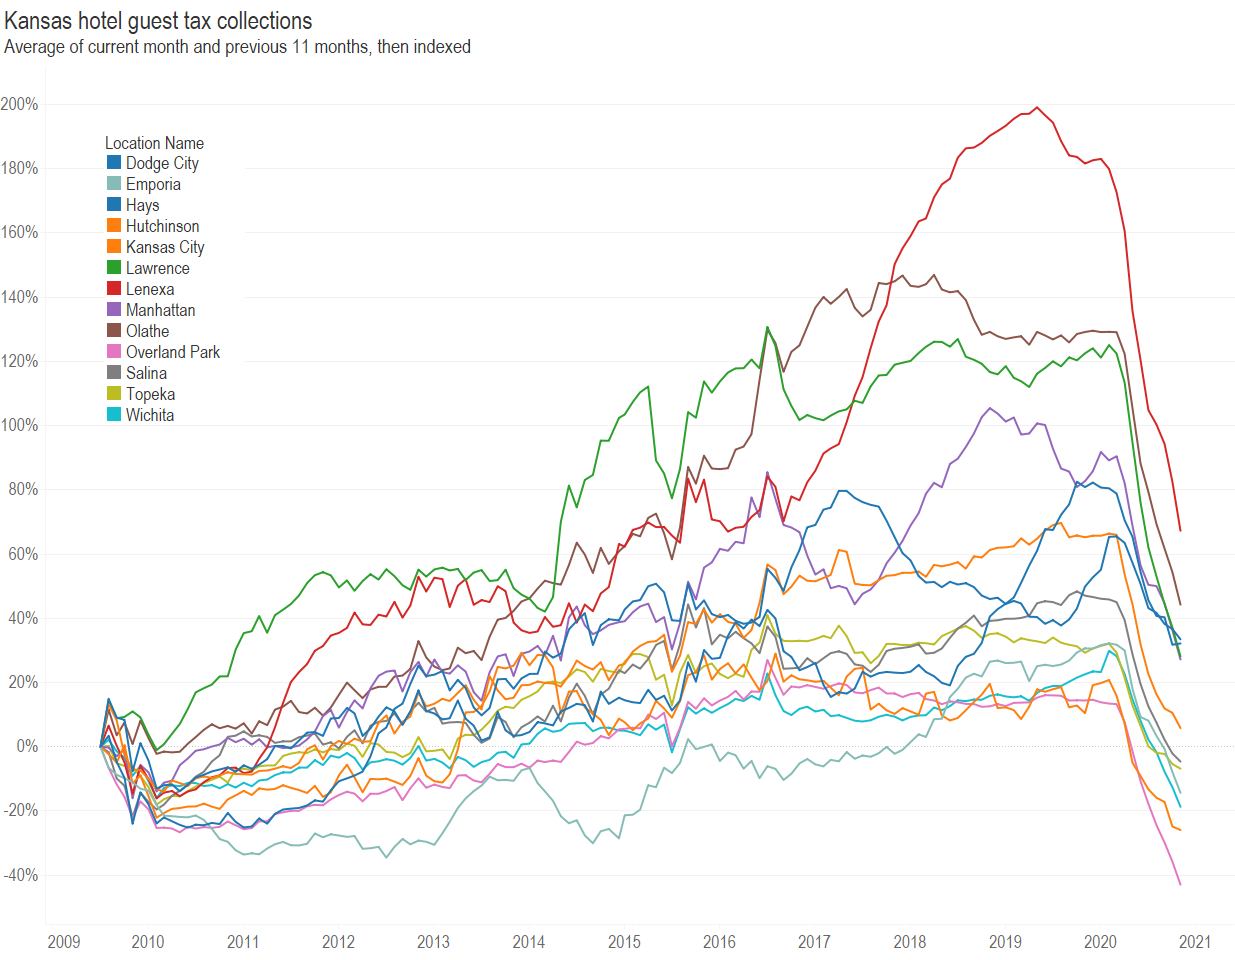
Updated: Kansas hotel guest tax collections
Kansas hotel guest tax collections presented in an interactive visualization. Updated with data through November 2020.
-
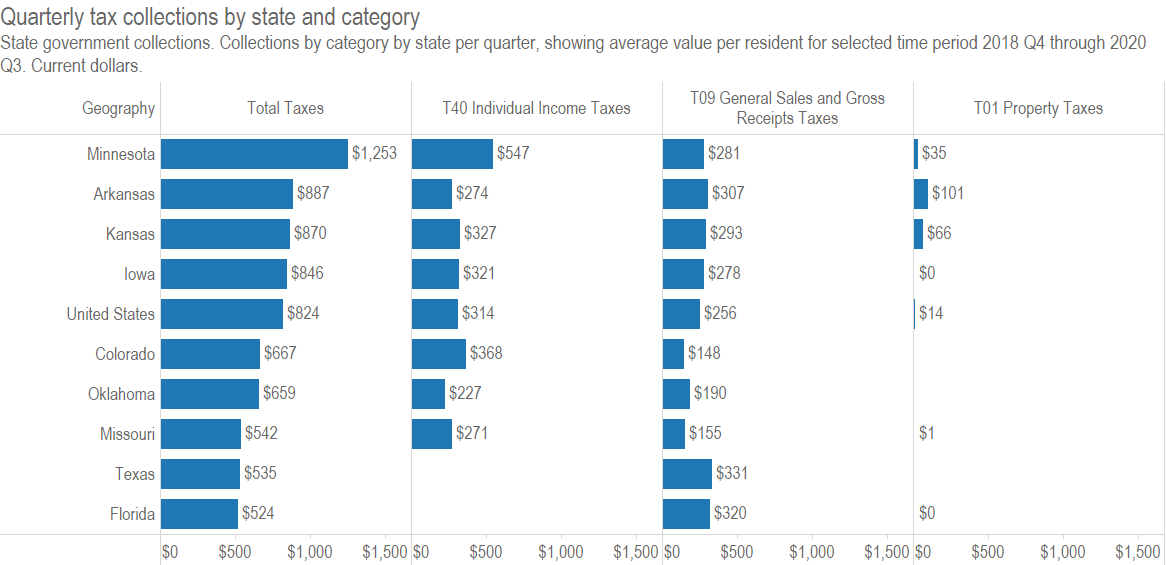
Quarterly state government tax collections
State government tax revenue has generally recovered since the second quarter.
-
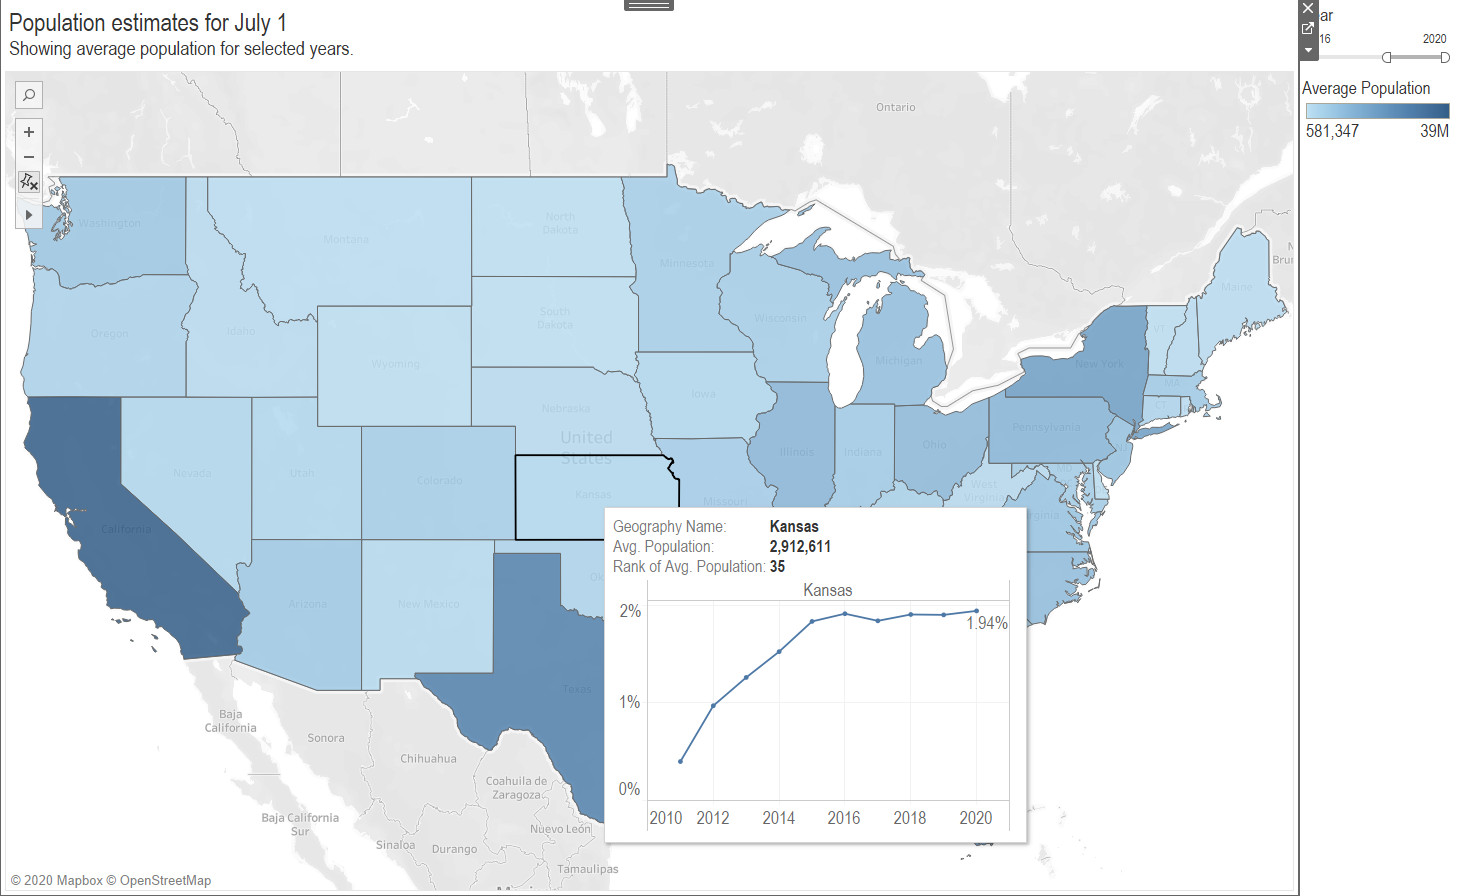
State population estimates for 2020
Compared to the nation and surrounding states, Kansas is growing slowly. An interactive visualization.
-
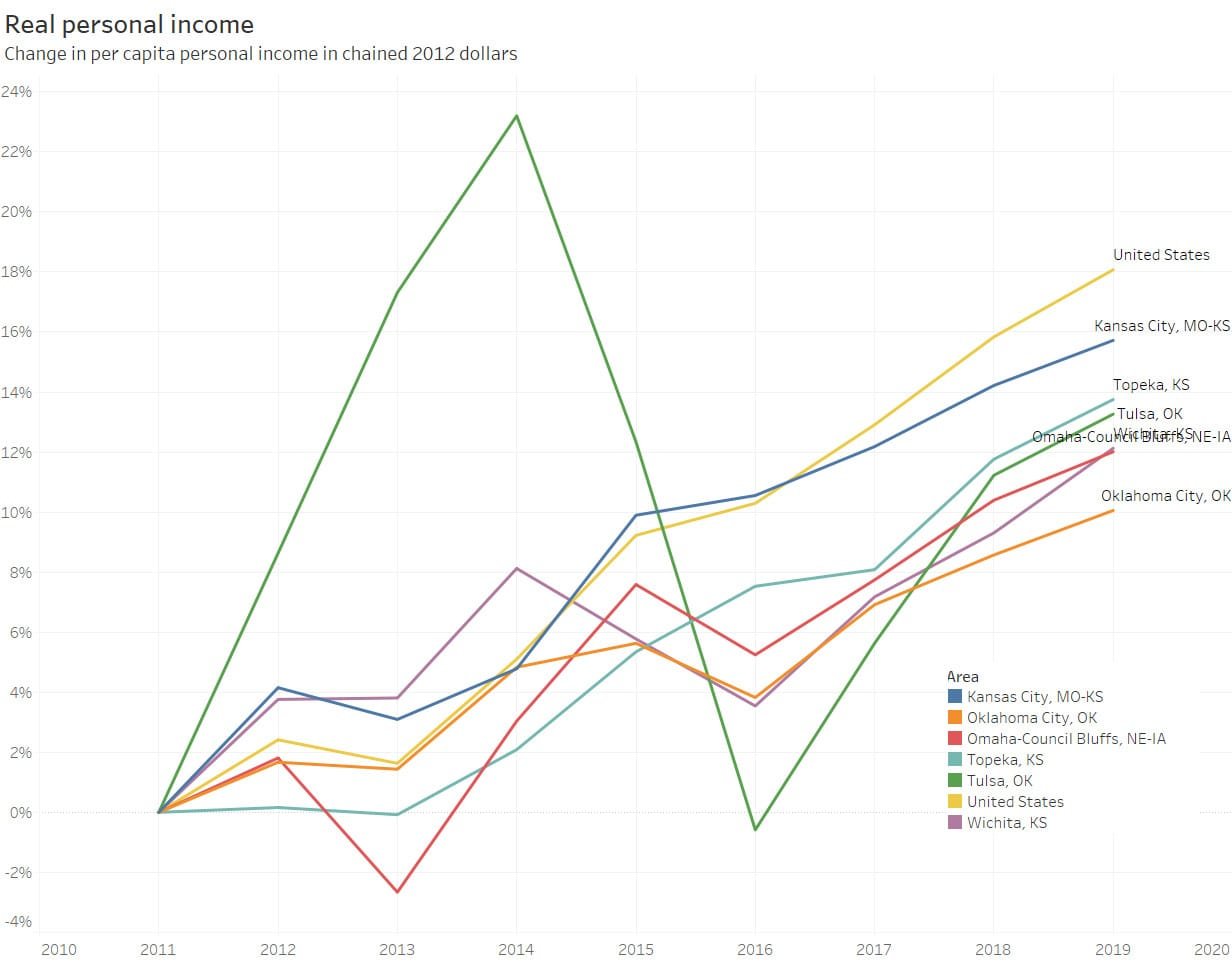
Real personal income in Wichita and other metropolitan areas
When adjusted for regional differences, per capita personal income in Wichita is relatively high. In recent years growth in per capita and total personal income has been slow, but better in 2019.
-
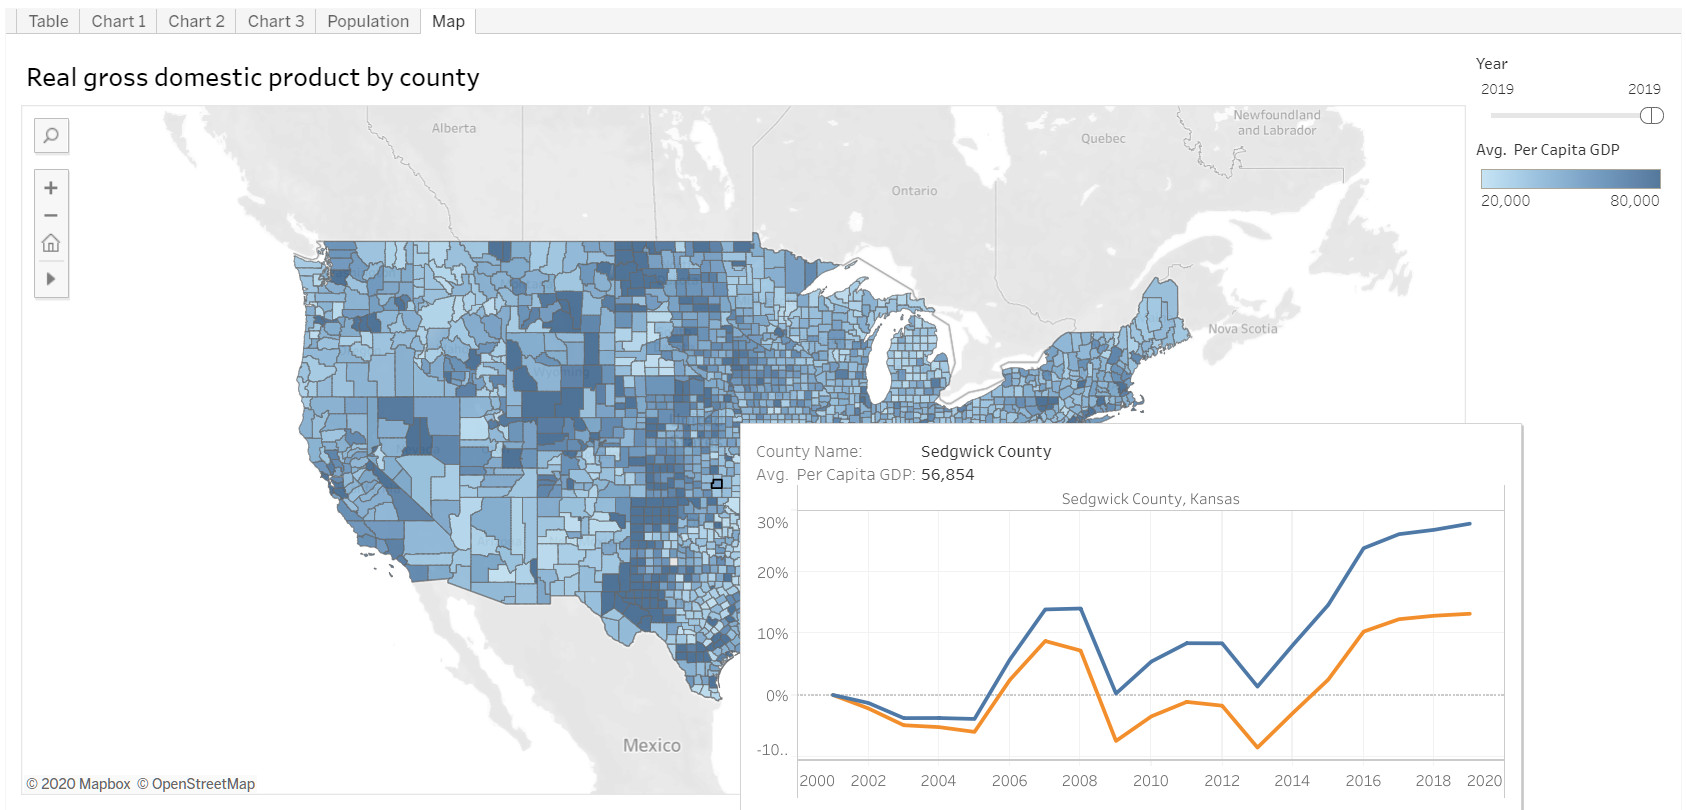
Real gross domestic product by county
Real GDP values by county, presented in an interactive visualization.
-
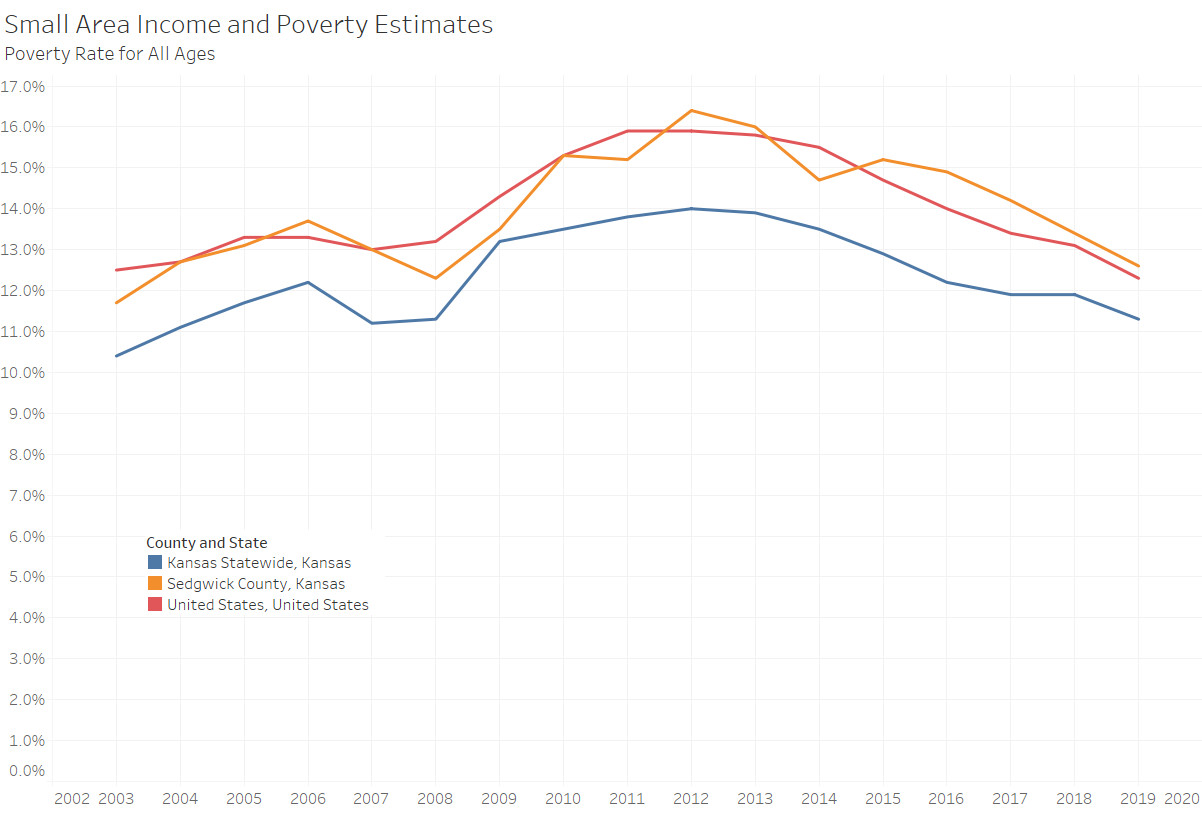
Small area income and poverty estimates
An interactive visualization of household income and poverty data for states and counties, now with data through 2019.
-

Monthly state retail sales
Monthly retail sales by state and major retail sector, in an interactive visualization.
-
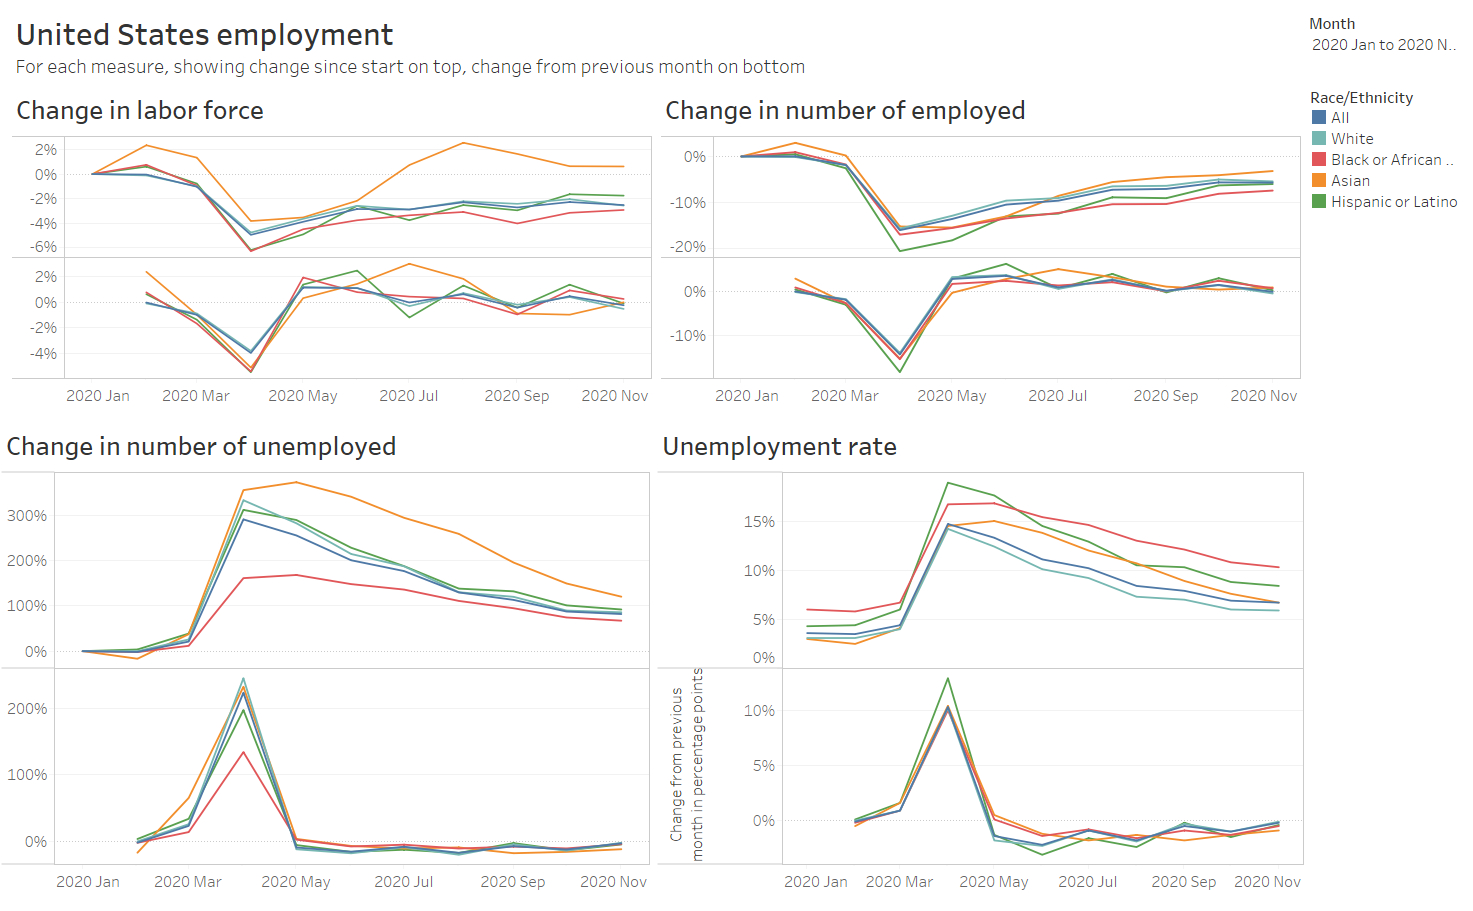
National employment, November 2020
An interactive visualization of national employment data, updated through November 2020.
-
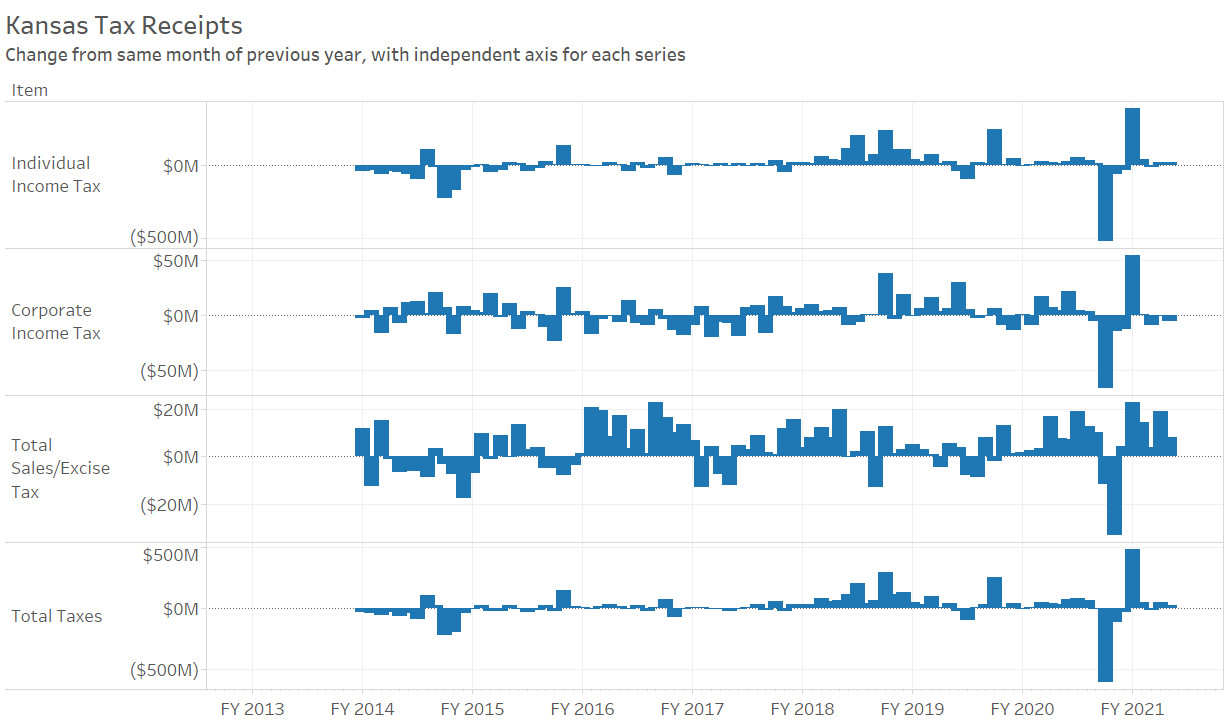
Kansas tax revenue, November 2020
For November 2020, total Kansas tax revenue was 4.3 percent greater than last November. Over the five months of the current fiscal year, tax revenue rose by 20.6 percent.