Tag: Visualizations
-
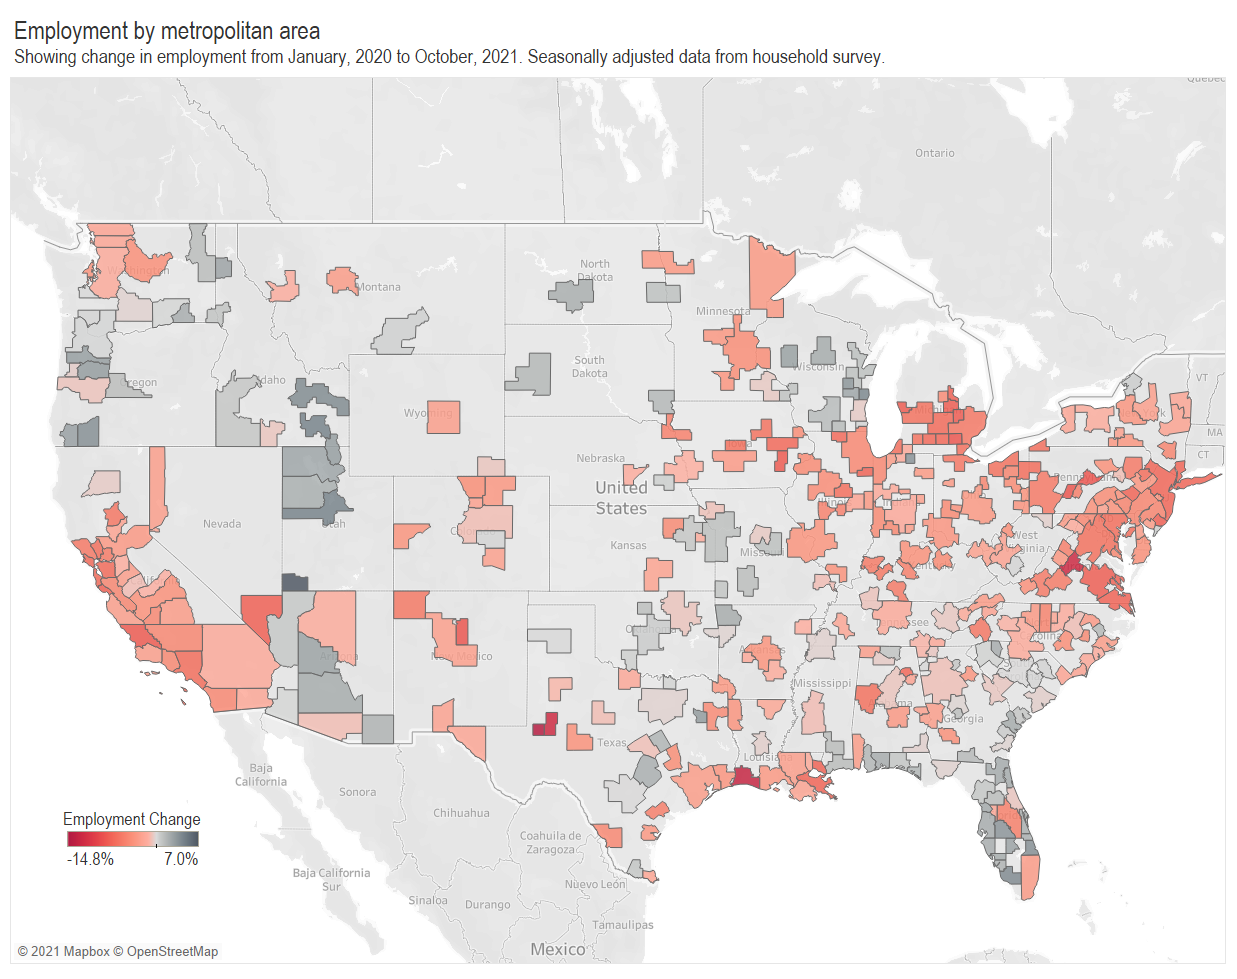
Wichita since the start of the pandemic
How has Wichita fared since the start of the pandemic compared to other metropolitan areas?
-
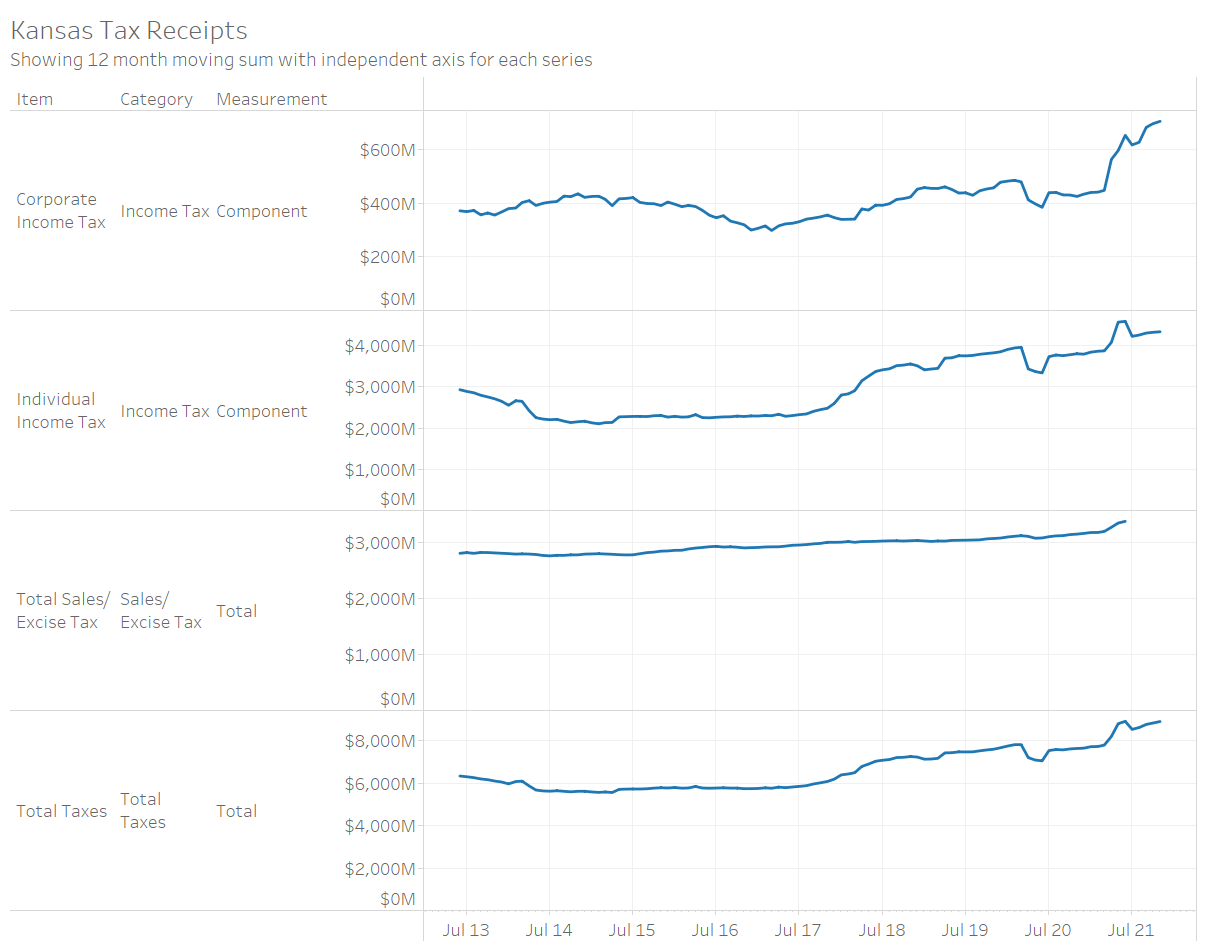
Kansas tax revenue, November 2021
For November 2021, Kansas tax revenue was 12.6 percent greater than November 2020, and 5.4 percent less than October.
-
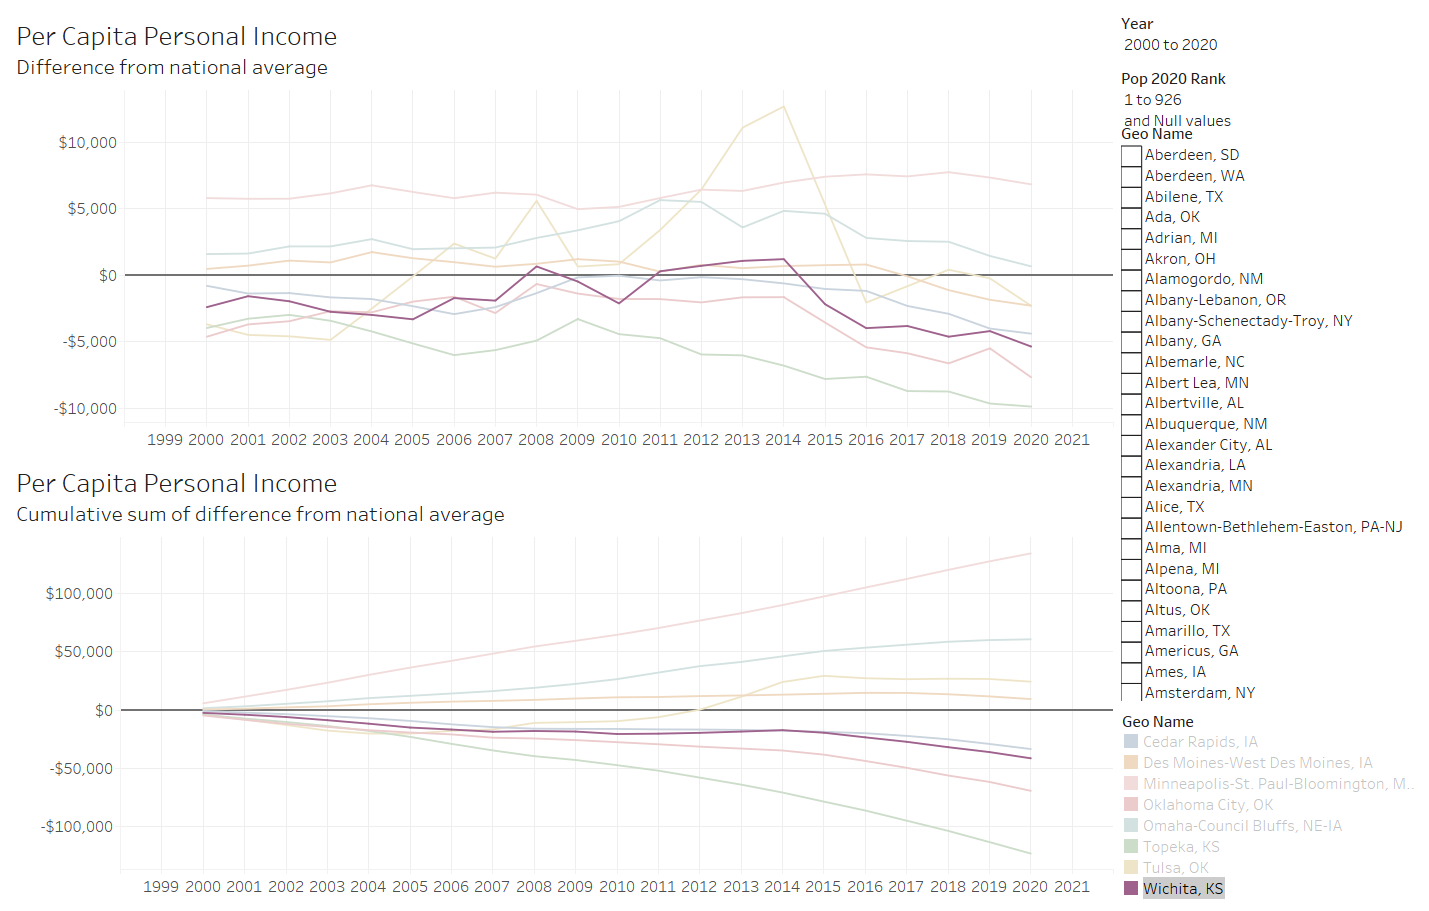
Per Capita Personal Income in Metropolitan and Micropolitan Areas
How does Wichita compare in Personal Income? We can learn in this interactive visualization of Per Capita Personal Income in urban areas in the United States.
-
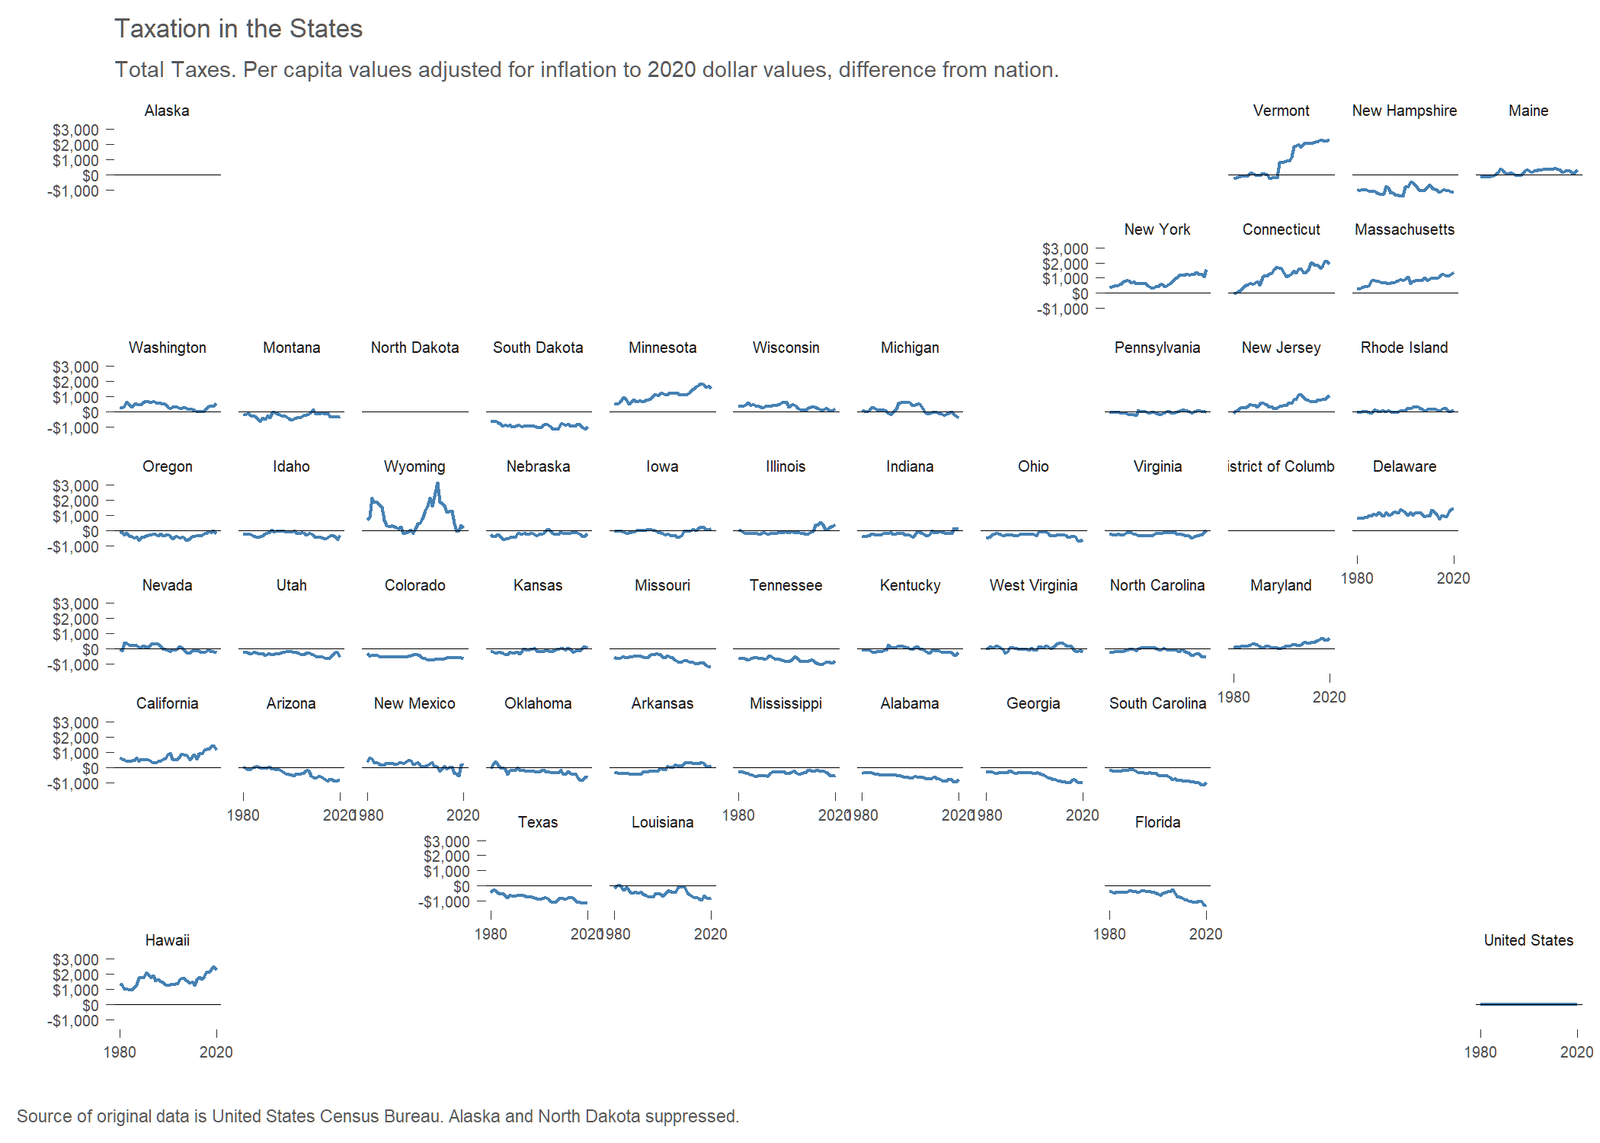
Taxation in the States
How does taxation differ in the states? There can be large differences.
-
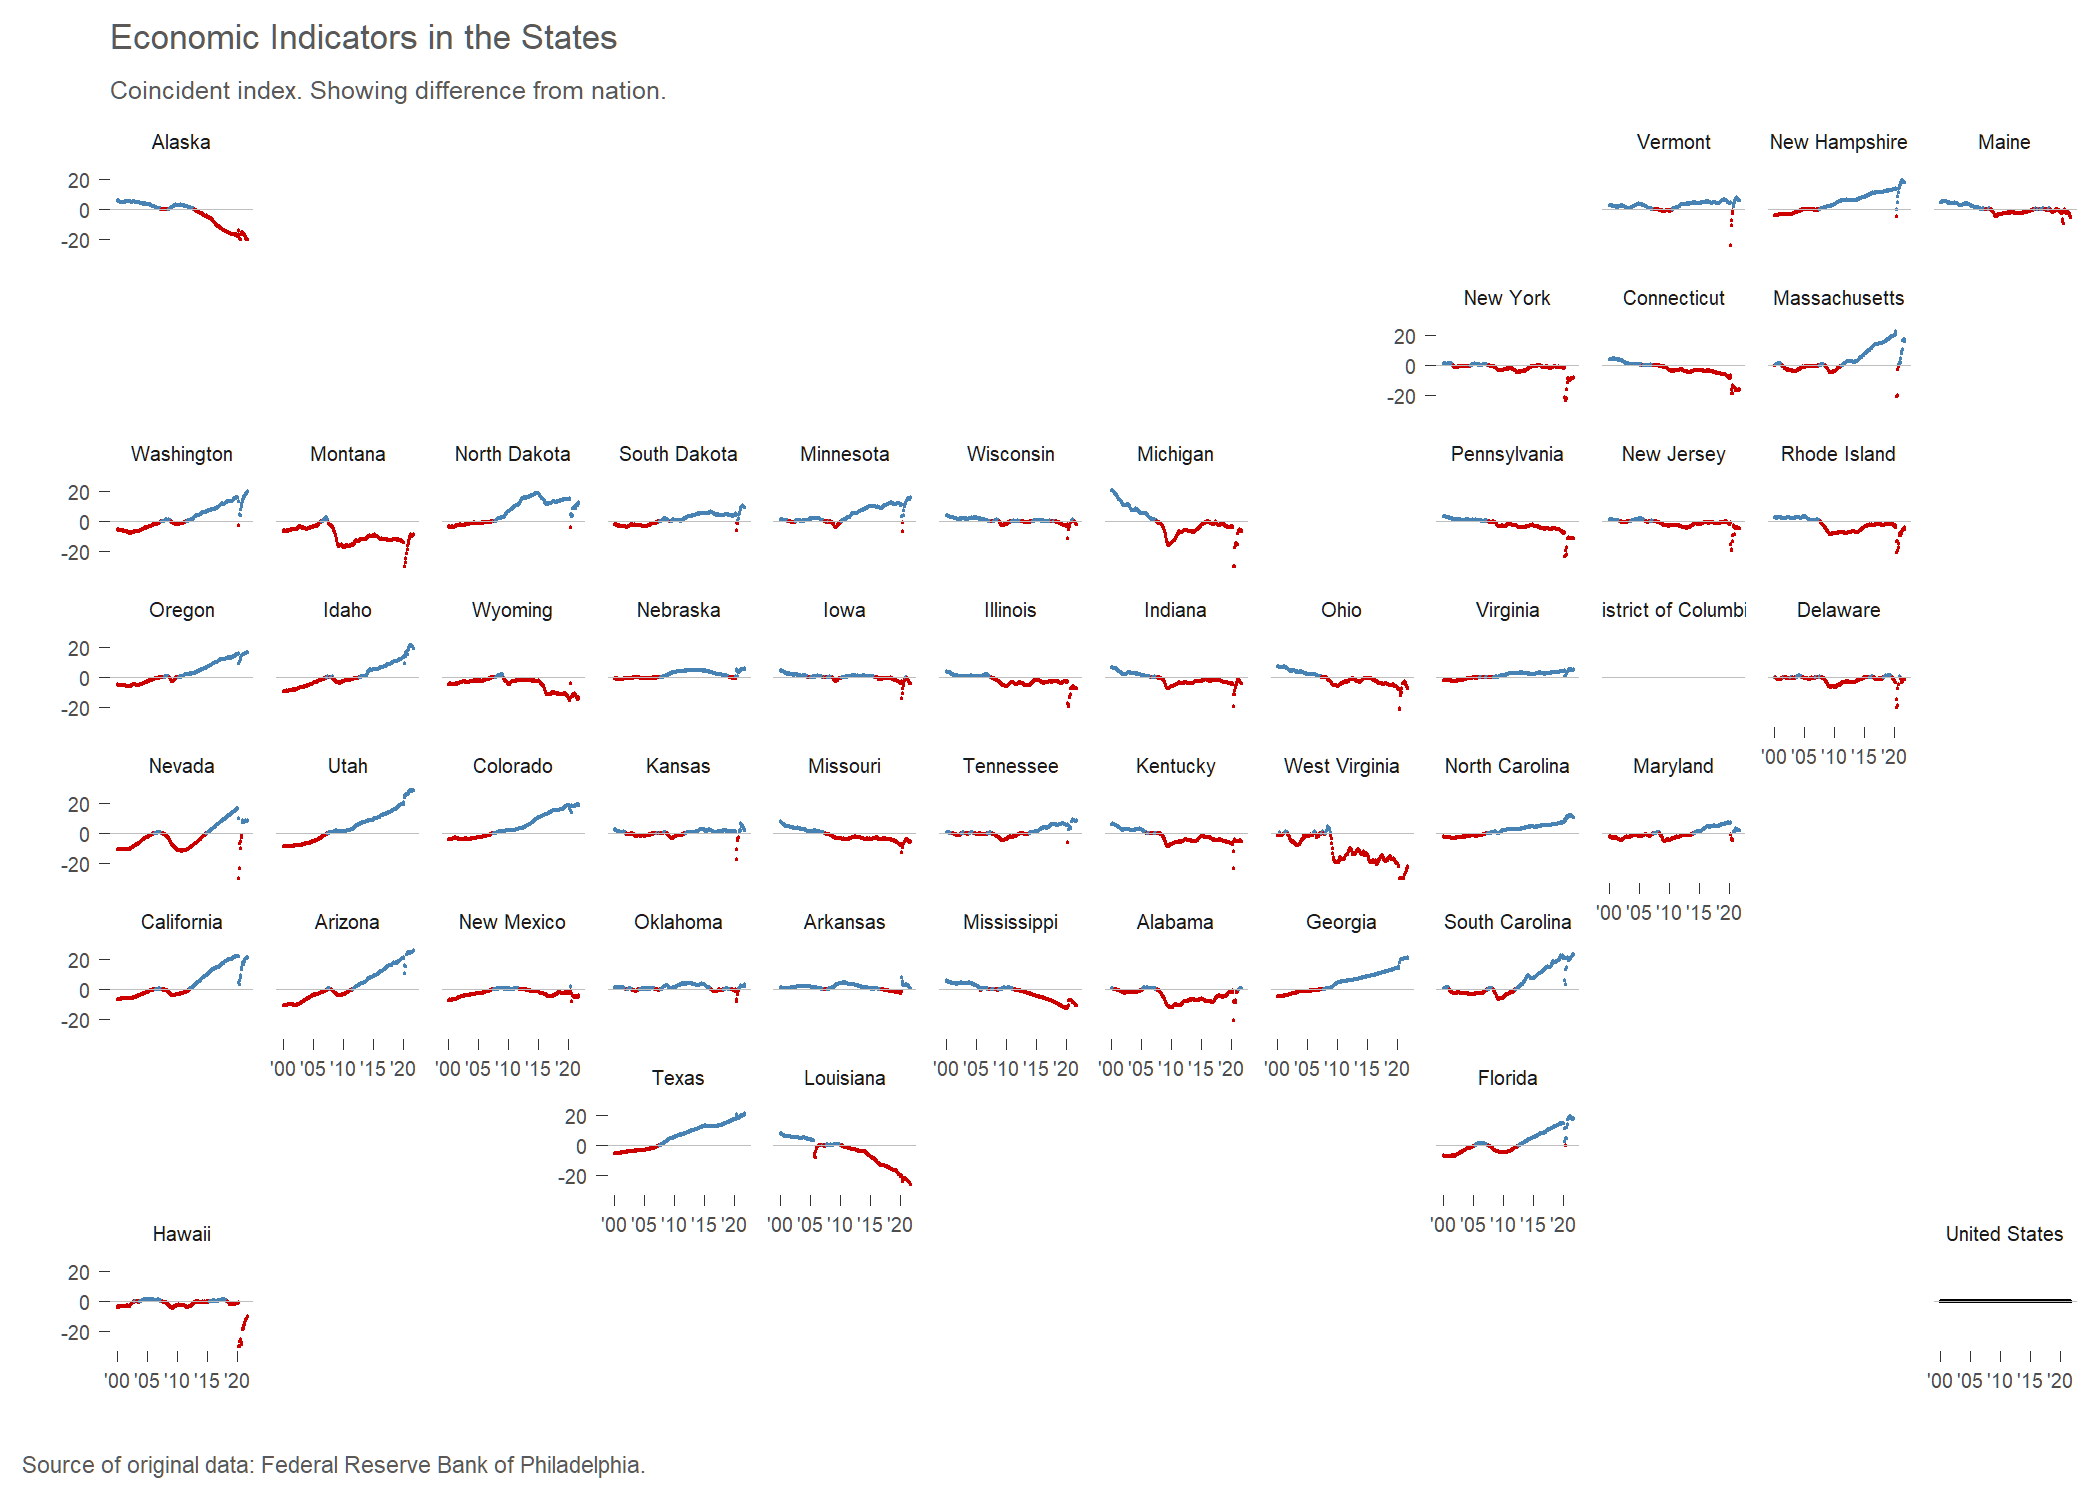
Updated: Economic Indicators in the States
A visualization of coincident and leading economic indicators for the states.
-
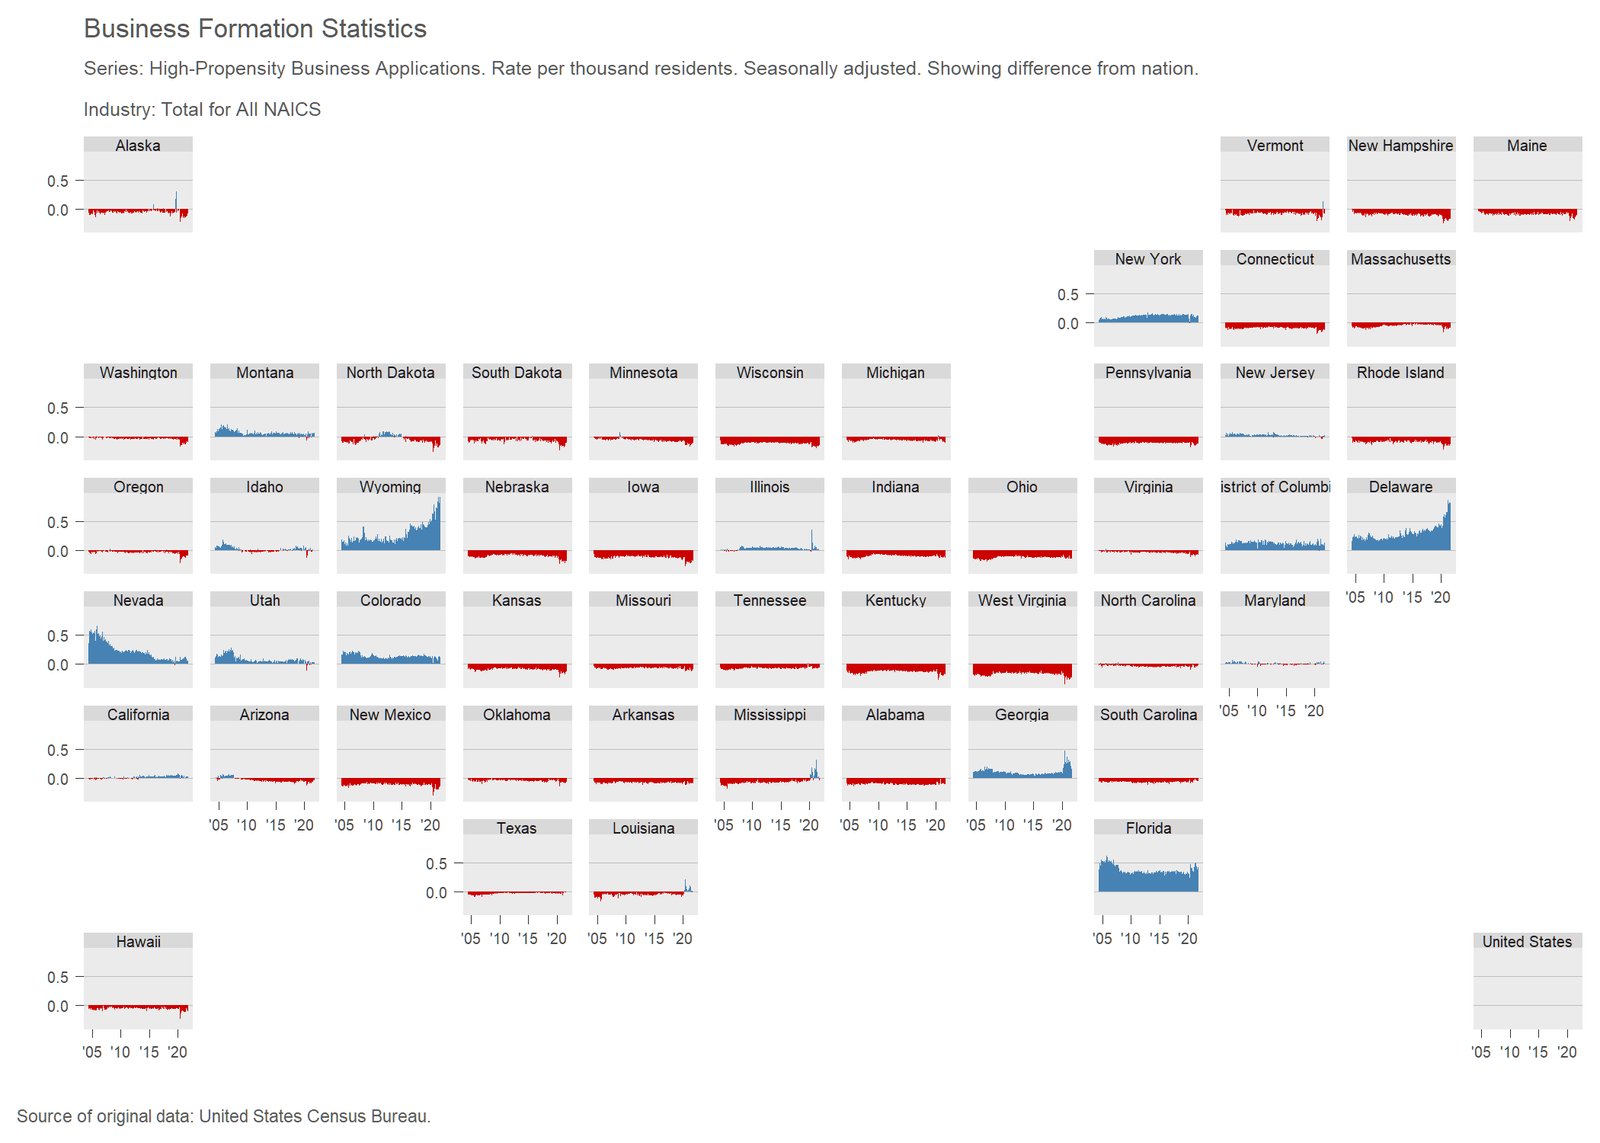
Business Formation in Kansas
For both business applications and business formations, Kansas is growing slowly compared to other states.
-
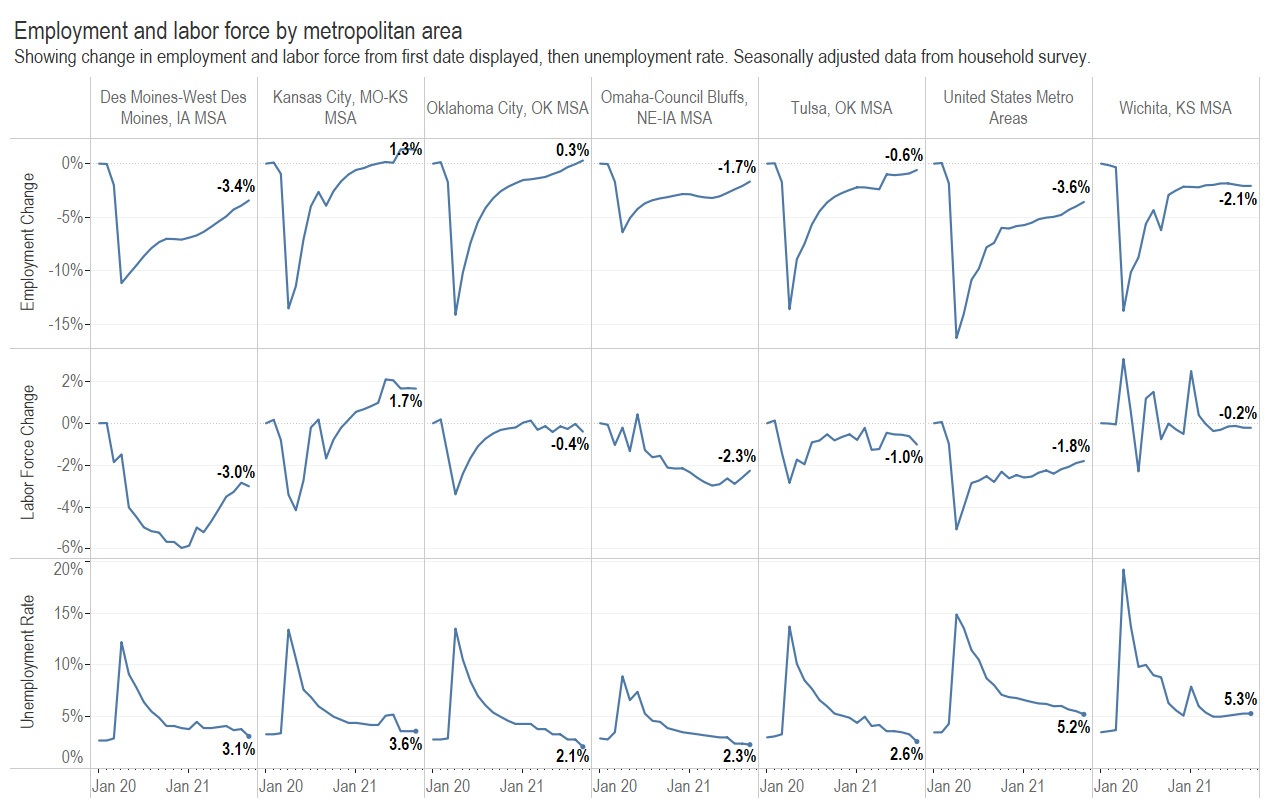
Wichita since the start of the pandemic
How has Wichita fared since the start of the pandemic compared to other metropolitan areas?
-

Kansas tax revenue, October 2021
For October 2021, Kansas tax revenue was 11.1 percent greater than October 2020, and 24.4 percent less than September.
-
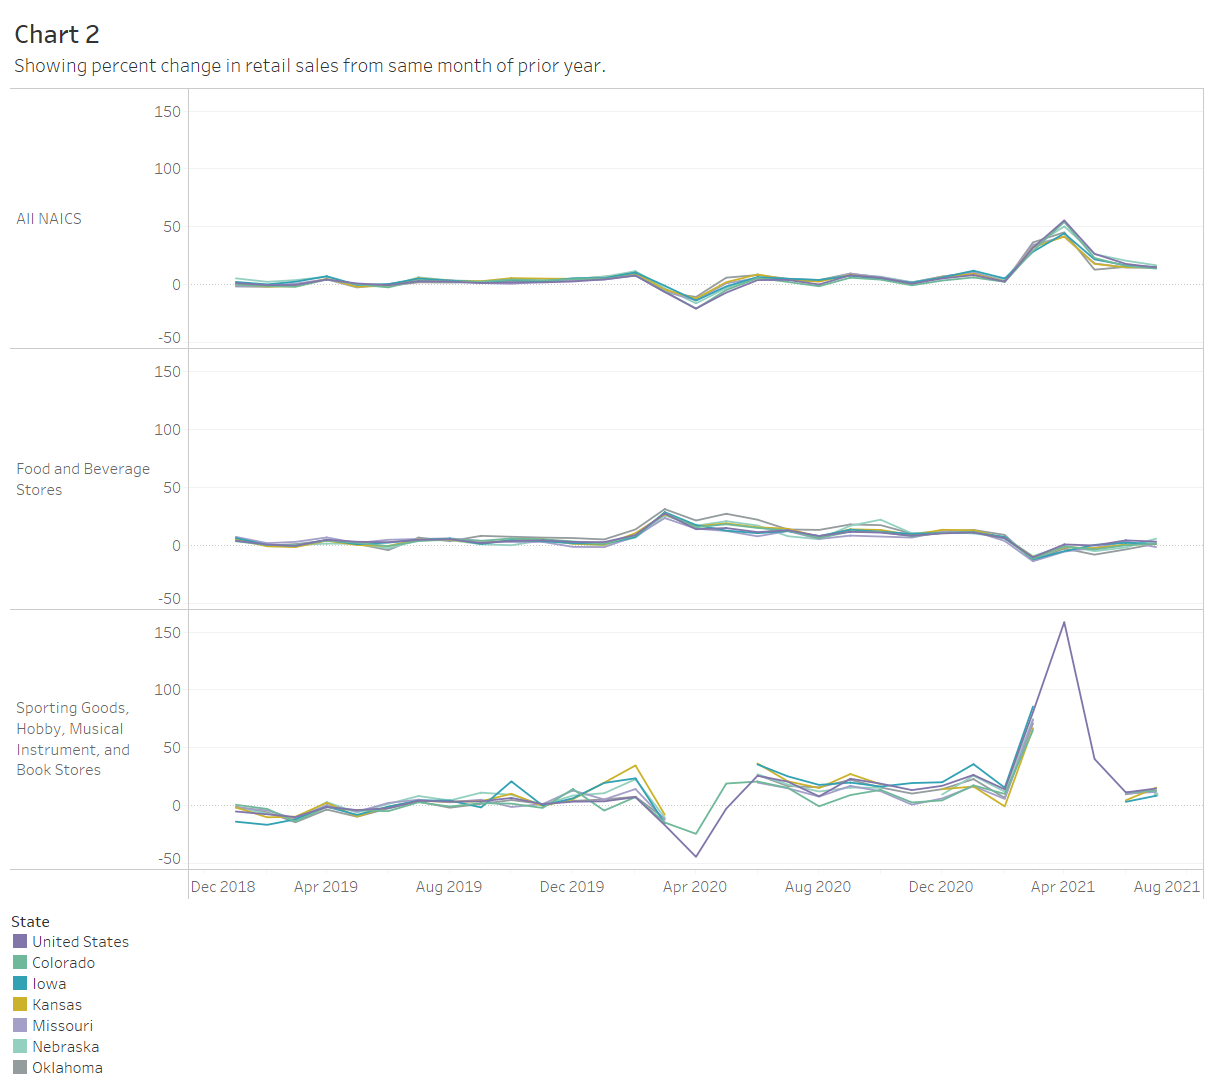
Monthly state retail sales
Monthly retail sales by state and major retail sector, in an interactive visualization.