Tag: United States government

  • Deficit shrank in August, but …

    Deficit shrank in August, but …

    The top takeaway of the Congressional Budget Office Monthly Budget Review for August 2020 is that the deficit for the month is smaller than last August. But there are details.

    Sometimes it pays to read the fine print. Otherwise, you may receive a false impression. Here is the monthly budget review for August 2020, which is the eleventh month of fiscal year 2020:

    The federal budget deficit in August 2020 was $198 billion, CBO estimates, $3 billion less than the deficit in August of last year. However, that comparison is distorted by shifts in the timing of certain payments in both years that had opposite effects on the August deficit in their respective years.

    Because September 1, 2019, fell on a weekend, federal payments totaling about $52 billion were made in August rather than in September of that year (increasing the deficit in August). A similar shift, of $57 billion, occurred this year, but from August into July, reducing the August 2020 deficit. Without those timing shifts, the deficit this August would have been $106 billion (or 72 percent) larger than in the same month last year. Outlays for unemployment compensation contributed significantly to the deficit this August, accounting for about half of the increase in government spending (excluding the timing shifts). (emphasis added)

    The full report is at Monthly Budget Review for August 2020.

    As can be seen in the nearby chart, the deficit for fiscal year 2020 was tracking closely the deficit for the prior year. Then came spending on the pandemic. (The full report has an interactive version of the chart.)

    But duplicating the budgetary performance, deficit-wise, of fiscal 2019 is not a positive accomplishment. As CBO reported earlier: “In fiscal year 2019, which ended on September 30, the federal budget deficit totaled $984 billion — $205 billion more than the shortfall recorded in 2018. The deficit increased to 4.6 percent of the nation’s gross domestic product (GDP) in 2019, up from 3.8 percent in 2018 and 3.5 percent in 2017. As a result, federal debt held by the public rose to 79.2 percent of GDP, up from 77.4 percent at the end of fiscal year 2018.” (emphasis added)

    Click for larger.
  • Border wall procedures criticized

    Border wall procedures criticized

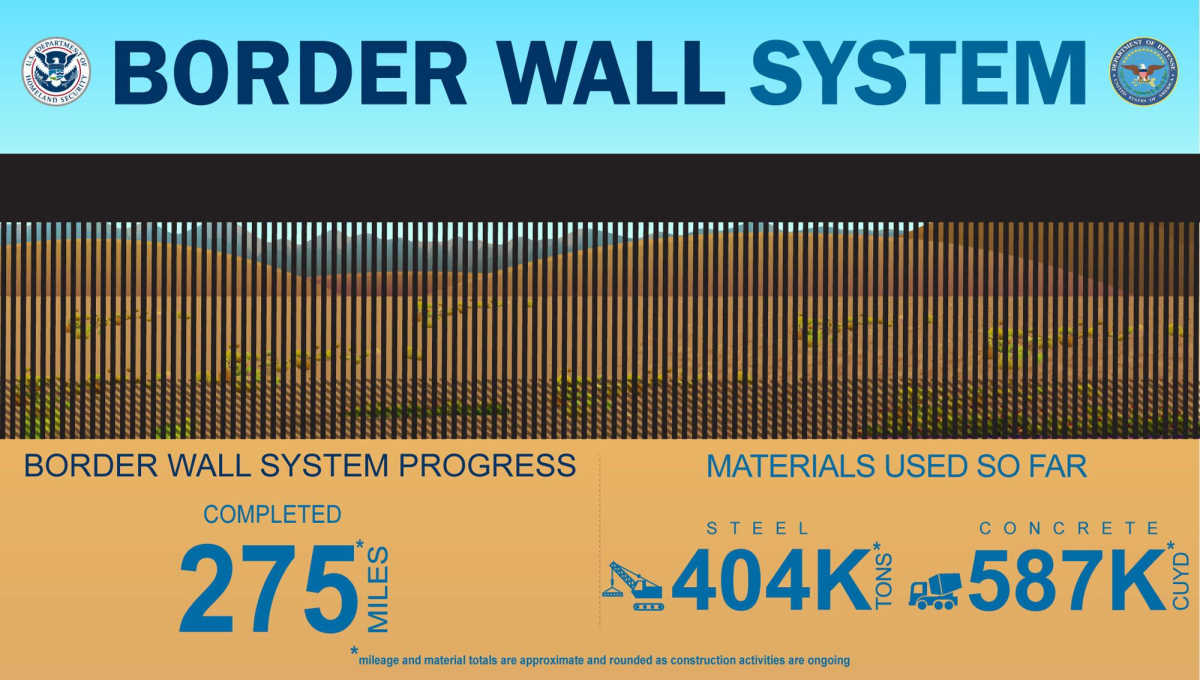
    A government watchdog says the procedures for acquiring the southern border wall are inadequate, and the ability to maintain complete operational control is diminished.

    A report by the Office of Inspector General of the Department of Homeland Security finds that U.S. Customs and Border Protection found the procedures for procuring the southern border wall inadequate for the task.

    Specifically, the IG found that CBP did not attempt to identify “the most effective, appropriate, and affordable solutions to obtain operational control of the southern border as directed.” Instead, the IG described the methods as “outdated.”

    The report found other deficiencies and concluded: “the likelihood that CBP will be able to obtain and maintain complete operational control of the southern border with mission-effective, appropriate, and affordable solutions is diminished.”

    The report is dated July 14, 2020 with the title “CBP Has Not Demonstrated Acquisition Capabilities Needed to Secure the Southern Border.” It is report number OIG-20-52 and is available here.

    The executive summary is this:

    U.S. Customs and Border Protection has not demonstrated the acquisition capabilities needed to effectively execute the Analyze/Select Phase of the Wall Acquisition Program. Specifically, CBP did not conduct an Analysis of Alternatives to assess and select the most effective, appropriate, and affordable solutions to obtain operational control of the southern border as directed, but instead relied on prior, outdated border solutions to identify materiel alternatives for meeting its mission requirement. CBP did not use a sound, well-documented methodology to identify and prioritize investments in areas along the border that would best benefit from physical barriers. Additionally, the Department did not complete the required plan to execute the strategy to obtain and maintain control of the southern border, as required by its Comprehensive Southern Border Security Study and Strategy. Without an Analysis of Alternatives, a documented and reliable prioritization process, or a plan, the likelihood that CBP will be able to obtain and maintain complete operational control of the southern border with mission-effective, appropriate, and affordable solutions is diminished. We made three recommendations to improve CBP’s ongoing investments for obtaining operational control of the southern border. DHS concurred with recommendation 2 but did not concur with recommendations 1 and 3.

  • Federal revenue and outlays

    Federal revenue and outlays

    An interactive visualization of federal government revenue and spending from 1962 to the present.

    This data comes from the Congressional Budget Office Budget and Economic Data page. While CBO often makes projections of the future and those projections may be controversial, the data in this visualization is historical.

    CBO presents this data in current dollars and as a percent of gross domestic product, or GDP. When current dollars are adjusted to account for inflation, the result is “real dollars.” In this visualization, I have used the CPI to convert current dollars to the value of dollars in 2019.

    CBO also presents data as a percentage of gross domestic product. This is a measure of the portion of our national income that is spent as outlays or taxed as revenue.

    Click here to learn more about the data and access this visualization.

    Example from the visualization. Click for larger.
  • Relations with North Korea

    Relations with North Korea

    The Congressional Research Service has produced a summary and timeline of recent events pertaining to the United States and North Korea relationship.

    In May the Congressional Research Service published a timeline of events relating to the relationship between the United States and North Korea. The document is available here: North Korea: A Chronology of Events from 2016 to 2020.

    Here is a portion of the report’s introduction, with footnote references removed:

    Since Kim and President Trump’s first summit in Singapore in June 2018, however, little progress has been made on denuclearization, despite two more Kim-Trump meetings (a February 2019 summit in Hanoi and a one-hour June 2019 meeting in Panmunjom). Since the June 2019 meeting, only one round of talks has been held and it did not produce a breakthrough. U.S. officials say their North Korean counterparts have refused to engage in additional negotiations.

    The deadlock largely is due to disagreements over the timing and sequencing of concessions that each side should provide.4 In particular, North Korea is seeking significant sanctions relief in return for the steps it claims it already has taken, but U.S. officials have said sanctions will not be eased until denuclearization is complete.

    Meanwhile, North Korea appears to be enhancing its military capabilities. In addition to continuing to produce nuclear material, between May 2019 and late March 2020, North Korea conducted multiple short-range ballistic missile (SRBM) tests; such tests violate United Nations Security Council prohibitions. Its motivation was possibly to advance the reliability of its solid fuel and guidance systems and develop capabilities to thwart short-range missile defense systems.

    In February 2020 written testimony before the Senate Armed Services Committee, the Commander of U.S. Northern Command said “recent engine testing suggests North Korea may be prepared to flight test an even more capable ICBM design that could enhance Kim’s ability to threaten our homeland during a crisis or conflict.” President Trump has dismissed the significance of these tests. Since the Hanoi summit, North Korea also has largely refused to interact with South Korea, spurning Moon’s efforts.

    In a possible signal that the active diplomatic phase of current U.S.-DPRK relations may be coming to an end, Kim in December 2019 announced that, due to the United States’ policies “to completely strangle and stifle the DPRK … there is no ground” for North Korea to continue to maintain its nuclear and missile testing moratorium. Kim criticized the United States’ continuation of sanctions, joint military exercises with South Korea, and shipments of advanced military equipment to South Korea. Kim warned, “the world will witness a new strategic weapon to be possessed by the DPRK in the near future.” The statement noted that this could be adjusted depending on the “U.S. future attitude.”

  • Electoral College math

    Electoral College math

    In the Electoral College, residents of different states have widely varying influence.

    When thinking about the desirability of the Electoral College for electing a president, the arithmetic should be considered.

    I have performed a few calculations, gathering state populations and the number of Electoral College votes. Here are the two extremes: In Wyoming, there are 192,579 people for each Electoral College vote (577,737 / 3). In Texas, the number is 755,312. That’s a difference of 3.92, which is a lot, I would say. For Kansas, the number is 485,251. The average value for a state (weighting all states equally) is 513,088, although the population of the country divided by 538 is 608,118. (I include the District of Columbia, as it has EC votes.)

    Sample of the table in the visualization.

    I present these calculations in an interactive visualization that you may access here.

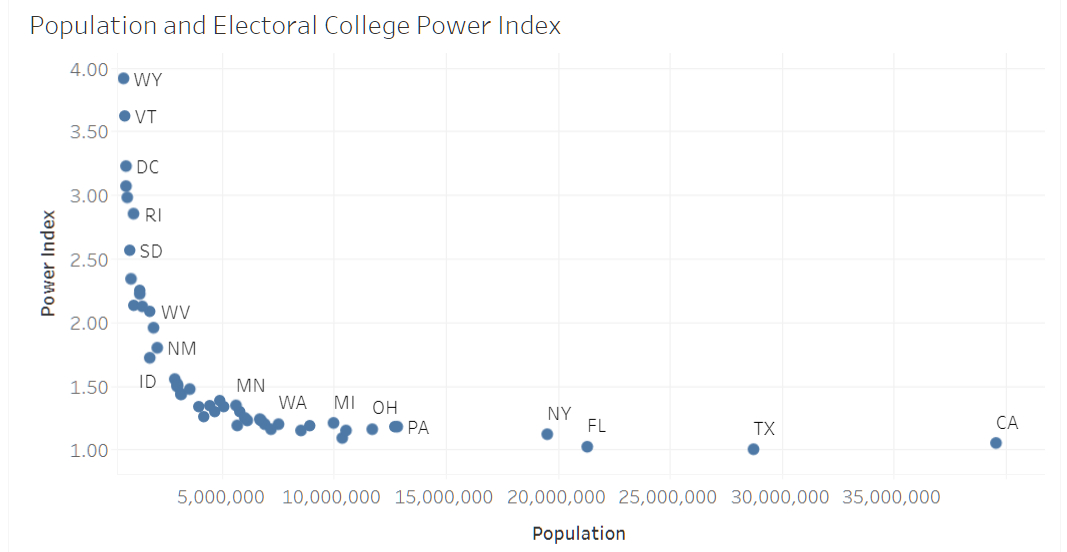
    Plot of state population versus Electoral College Power Index. Click for larger.

    The visualization also holds a plot of state populations and Electoral College Power Index. By that, I mean the relative “power” of a state resident over their Electoral College votes. The state with the highest number of residents per Electoral College vote is Texas, which is assigned the value of one. Wyoming’s value is 3.92.

    Note that a California resident, by living in the most populated state, votes in a state with 719,219 persons per Electoral College vote, which is the third-lowest state in power index (1.05). When Vermonters vote, they vote in a state with 208,766 residents per Electoral College vote, which is a power index of 3.62.

  • Federal budget summary for 2019

    Federal budget summary for 2019

    Federal revenues for 2019 were up, but spending increased by a larger amount, resulting in a higher deficit.

    The Congressional Budget Office has released its summary for fiscal year 2019, which ended on September 30, 2019. The headline numbers are these:

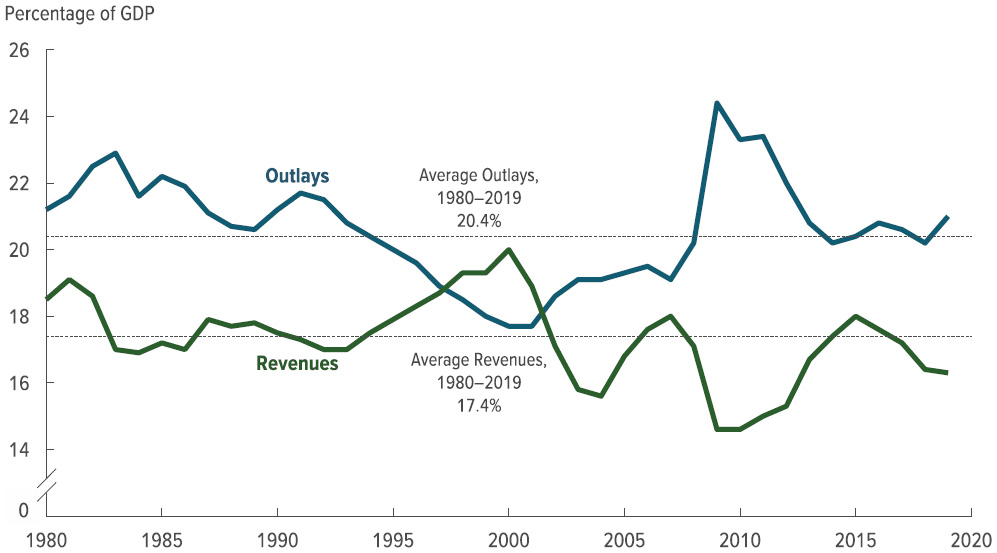
    In fiscal year 2019, which ended on September 30, the federal budget deficit totaled $984 billion — $205 billion more than the shortfall recorded in 2018. The deficit increased to 4.6 percent of the nation’s gross domestic product (GDP) in 2019, up from 3.8 percent in 2018 and 3.5 percent in 2017. As a result, federal debt held by the public rose to 79.2 percent of GDP, up from 77.4 percent at the end of fiscal year 2018.

    CBO reports that total receipts were up by 4.0 percent over the previous year, but outlays rose by 8.2 percent. A timing factor, however, inflates the outlay figure, as CBO notes: “That increase would have been about $44 billion smaller — resulting in an increase of 7.1 percent — if not for the shift of certain payments from October 2017 to September 2017 because October 1 fell on a weekend.”


    The chart of outlays and receipts provided by CBO expresses these values as a percent of gross domestic product. Federal outlays are now above the long-term average.

    The release page for the report is Monthly Budget Review: Summary for Fiscal Year 2019. It holds a link to the complete report.

  • From Pachyderm: United States Representative Ron Estes

    From Pachyderm: United States Representative Ron Estes

    From the Wichita Pachyderm Club this week: United States Representative Ron Estes. This audio presentation or podcast was recorded on August 23, 2019.

    Shownotes

    • Representative Ron Estes Congressional Office: estes.house.gov
    • Map of Kansas district 4 from U.S. Census Bureau

  • WichitaLiberty.TV: United States Representative Ron Estes

    WichitaLiberty.TV: United States Representative Ron Estes

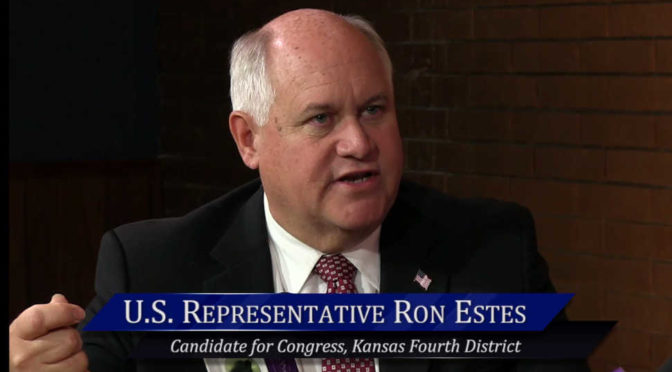
    In this episode of WichitaLiberty.TV: Republican candidate for Congress Representative Ron Estes explains why he should continue to be our representative in the United States House of Representatives. View below, or click here to view at YouTube. Episode 214, broadcast October 21, 2018.

    Shownotes

  • WichitaLiberty.TV: Candidate for Congress James Thompson

    WichitaLiberty.TV: Candidate for Congress James Thompson

    In this episode of WichitaLiberty.TV: Democratic Party candidate for Congress James Thompson explains why he should be our next representative in the United States House of Representatives. View below, or click here to view at YouTube. Episode 213, broadcast October 14, 2018.

    Shownotes