Using data from Tax Foundation, I examined state political sentiment and state tax collections.
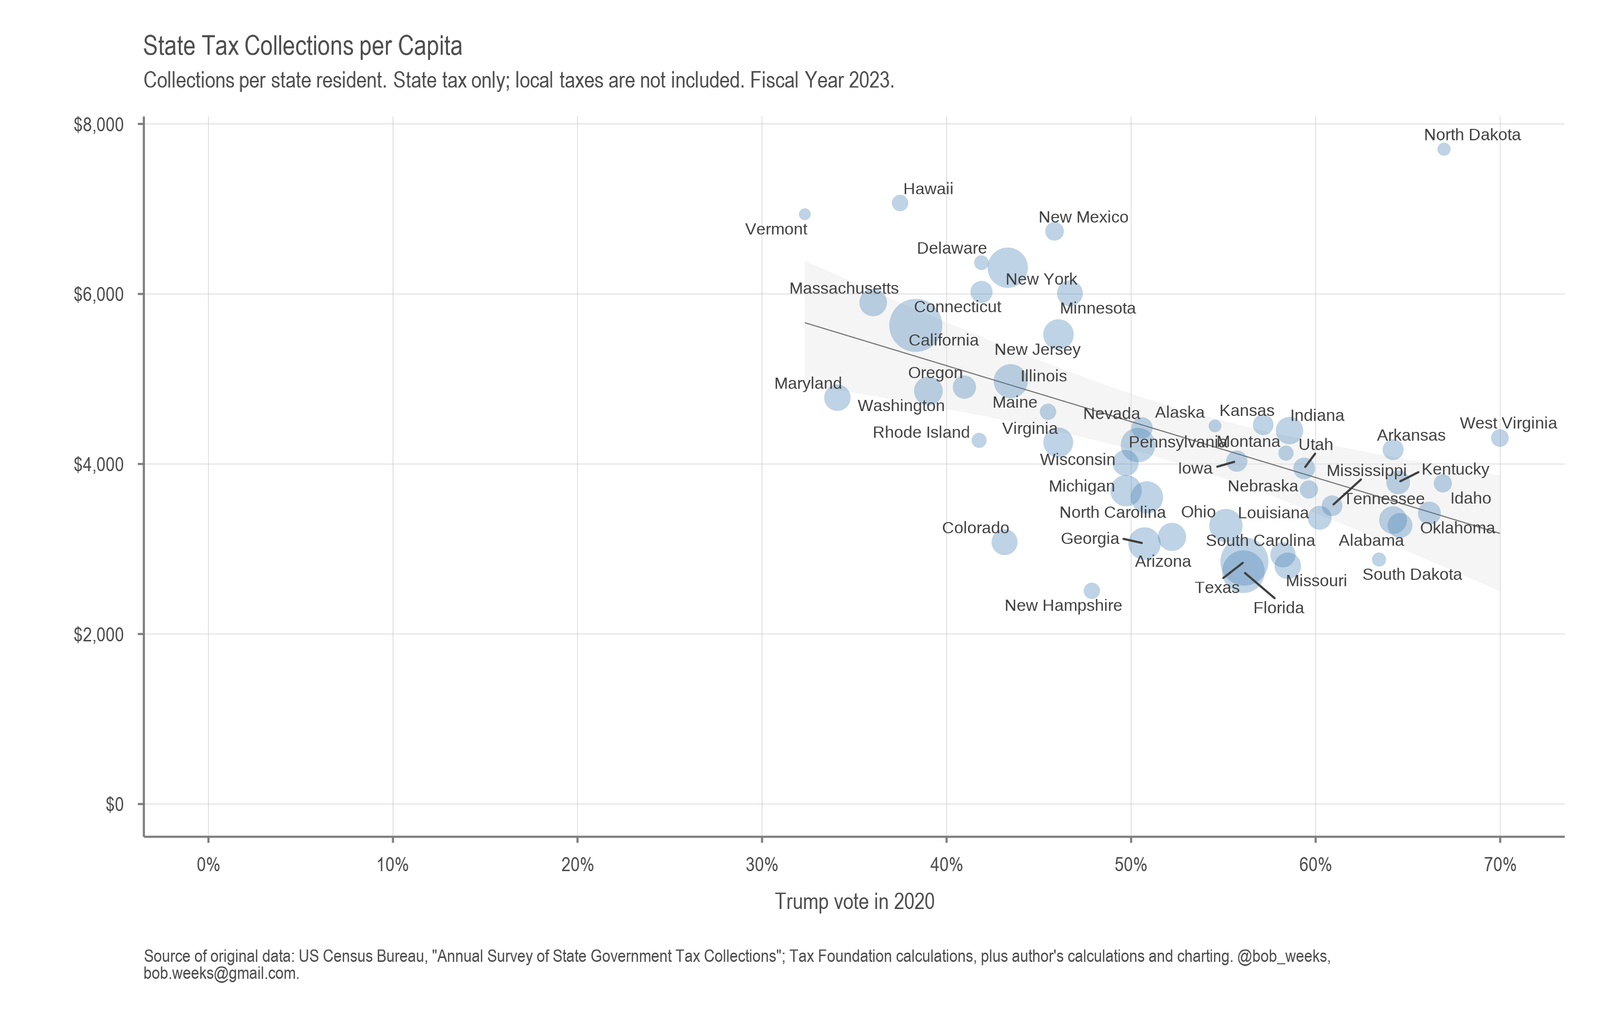
One way to measure the political sentiment of a state is the proportion voting for Donald J. Trump. The Tax Foundation provides data on the total value of state government tax collections, and also per capita (state residents). This data is for fiscal year 2023.
I plotted the data, using Trump vote as an independent variable shown on the horizontal axis, and tax collections per resident on the vertical axis. The size of the marks is proportional to the state population. (click for larger)

I asked ChatGPT to perform a regression analysis and explain the results. I also included the state population as an independent variable. Following is a short summary of findings:
This analysis looked at whether two factors — how strongly a state voted for Donald Trump in 2020 and the state’s total population — help explain differences in how much tax the state collects per person. We found that states with higher Trump vote shares tend to collect less in taxes per resident on average. The population of the state didn’t show a clear or consistent effect on tax collections per resident. Overall, these two factors together explain roughly one-quarter of the differences in how much states collect in taxes per person, meaning many other factors also matter.
In more detail:
Residuals:
     Min       1Q   Median       3Q      Max
-2681.42  -985.63    42.02  1016.91  2686.93

Coefficients:
               Estimate Std. Error t value Pr(>|t|)
(Intercept)     7857.18    924.98   8.49  1.06e-11 ***
x             -6139.42   1657.40  -3.70  0.00061 ***
size_values       -0.00      0.00  -1.65  0.10600
---
Signif. codes:  0 ‘***’ 0.001 ‘**’ 0.01 ‘*’ 0.05 ‘.’ 0.1 ‘ ’ 1

Residual standard error: 1398 on 47 degrees of freedom
Multiple R-squared: 0.236,  Adjusted R-squared: 0.203
F-statistic: 7.258 on 2 and 47 DF,  p-value: 0.00179
Key Points:
- Intercept (7857.18)
- Interpreted as the expected tax collections per resident when both the Trump vote share (
x) is 0 and the population (size_values) is 0. - Although literal interpretation of “population = 0 and Trump vote share = 0” doesn’t make practical sense for real states, the intercept is still the baseline from which changes in
xorsize_valuesstart.
- Interpreted as the expected tax collections per resident when both the Trump vote share (
- Coefficient for x (-6139.42)
- This is a strong negative relationship with the dependent variable (
y), statistically significant at well below the 1% level (p < 0.01). - Because
xranges between 0 and 1 (representing 0% to 100% of the Trump vote share in a state), a difference of 0.10 (i.e., 10 percentage points in Trump vote share) would, all else equal, correspond to a decrease of about 614 dollars of tax collections per resident (-6139.42 * 0.10). - In other words, states with higher Trump vote shares tend to have lower state tax collections per resident, all else being equal.
- This is a strong negative relationship with the dependent variable (
- Coefficient for size_values (-0.0000369)
- The effect of population is negative but not statistically significant at the 5% level (p ? 0.106).
- That means we do not have strong evidence that population size on its own (once we also include
xin the model) clearly predicts higher or lower per-resident tax collections. It might be mildly negative, but the data aren’t conclusive enough to confirm.
- Model Fit (R-squared = 0.236)
- About 23.6% of the variation in state tax collections per resident is explained by these two variables combined.
- This is a modest amount, indicating that while there is some relationship, other factors also play a significant role in determining state tax collections per resident.
- Overall Model Significance (p = 0.00179)
- Jointly, the two predictors (
xandsize_values) are statistically significant in explaining variation iny. - Within the model, the Trump vote share is strongly significant, while population is not as definitive.
- Jointly, the two predictors (