Tag: Sedgwick county government
-

Wichita jobs and employment, May 2020
For the Wichita metropolitan area in May 2020, the number of unemployed persons is up, the unemployment rate is up, and the number of people working is down, all by large amounts, when compared to the same month one year ago, but improving from April.
-

From Pachyderm: Kansas House candidates
From the Wichita Pachyderm Club: Republican Party Candidates for Kansas House of Representatives District 85. This audio presentation or podcast was recorded on June 26, 2020.
-

From Pachyderm: Sedgwick County Commission Candidates
From the Wichita Pachyderm Club: Republican Party Candidates for Sedgwick County Commissioner District 3. This audio presentation or podcast was recorded on June 19, 2020.
-
From Pachyderm: Sedgwick County Commission Candidates
From the Wichita Pachyderm Club: Republican Party Candidates for Sedgwick County Commissioner District 2. This audio presentation or podcast was recorded on June 12, 2020.
-

Wichita jobs and employment, April 2020
For the Wichita metropolitan area in April 2020, the number of unemployed persons is up, the unemployment rate is up, and the number of people working is down, all by large amounts, when compared to the same month one year ago. Seasonal data shows the same trend.
-
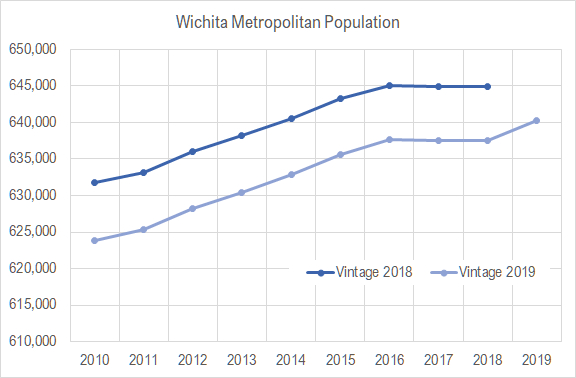
Wichita metro population for 2019
For 2019, the estimated population for the Wichita metropolitan area is up — and also down.
-

Wichita jobs and employment, March 2020
For the Wichita metropolitan area in March 2020, the labor force is up, the number of unemployed persons is up, the unemployment rate is down, and the number of people working is up when compared to the same month one year ago. Seasonal data shows increases in labor force and jobs from February, with the…
-
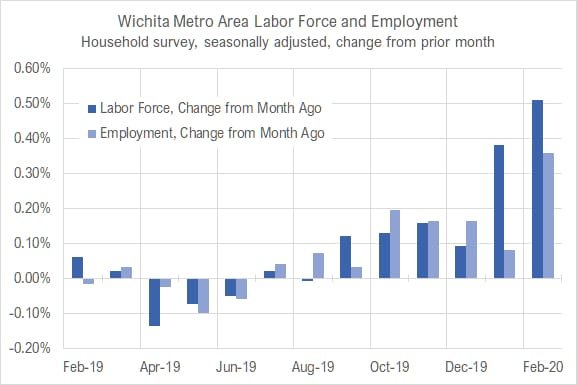
Wichita jobs and employment, February 2020
For the Wichita metropolitan area in February 2020, the labor force is up, the number of unemployed persons is up, the unemployment rate is up, and the number of people working is up when compared to the same month one year ago. Seasonal data shows increases in labor force and jobs from January.
-

Wichita jobs and employment, January 2020
For the Wichita metropolitan area in January 2020, the labor force is up, the number of unemployed persons is down, the unemployment rate is down, and the number of people working is up when compared to the same month one year ago. Seasonal data shows increases in labor force and jobs from December.
-

Intrust Bank Arena economic impact holds mistake
A report on the economic impact of the first ten years of operation of the Intrust Bank Arena in downtown Wichita incorrectly reported tax revenue.
-

From Pachyderm: Commissioner Pete Meitzner
From the Wichita Pachyderm Club: Sedgwick County Commissioner Pete Meitzner. He is the chair of the commission this year. This audio presentation or podcast was recorded on February 14, 2020.
-

Wichita to Ghana, again
News of a Sedgwick County Commissioner’s trip to Africa has raised some controversy, and something like this has been tried before.