Tag: Sedgwick county government

  • Wichita jobs and employment, March 2019

    Wichita jobs and employment, March 2019

    For the Wichita metropolitan area in March 2019, jobs are up, the labor force is up, and the unemployment rate is unchanged when compared to the same month one year ago. Seasonal data shows a small decline in jobs from February.

    Data released today by the Bureau of Labor Statistics, part of the United States Department of Labor, shows an improving, but also mixed, employment situation for the Wichita Metropolitan Statistical Area.

    Click charts and tables for larger versions.

    Total nonfarm employment rose from 296,000 last March to 300,700 this March. That’s an increase of 4,700 jobs, or 1.6 percent. (This data is not seasonally adjusted, so month-to-month comparisons are not valid.) For the same period, jobs in the nation grew by 1.7 percent.

    The unemployment rate in March 2019 was 3.9 percent, the same as one year ago.

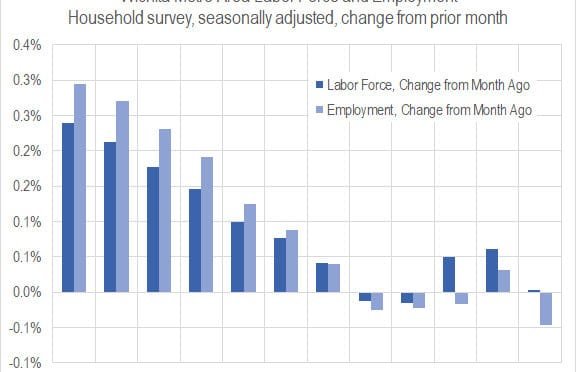
    Considering seasonally adjusted data from the household survey, the labor force rose by persons (0.0 percent) in March 2019 from February 2019, the number of unemployed persons rose by 149 (1.3 percent), and the unemployment rate rose from 3.7 percent to 3.8 percent. The number of employed persons not working on farms fell to 299,597 in March from 299,738 the prior month, a decline of 141 persons, or 0.0 percent.

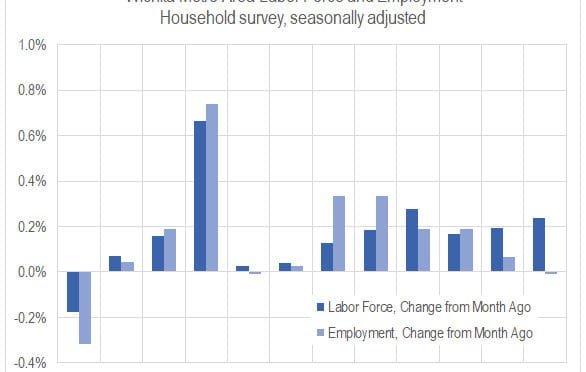
    The following chart of the monthly change in labor force and employment shows a general decline over the past year, with some recent months of losses for both measures.

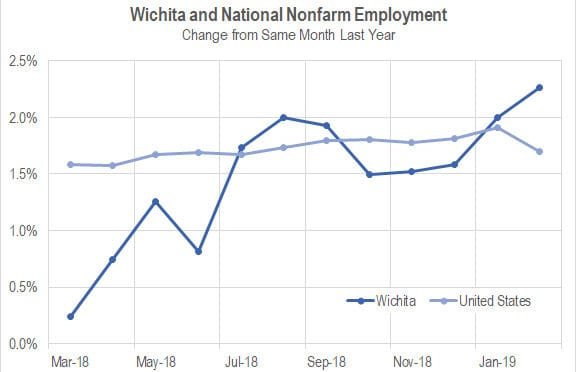
    The following chart of changes from the same month one year ago shows recent declines in the rate of growth.

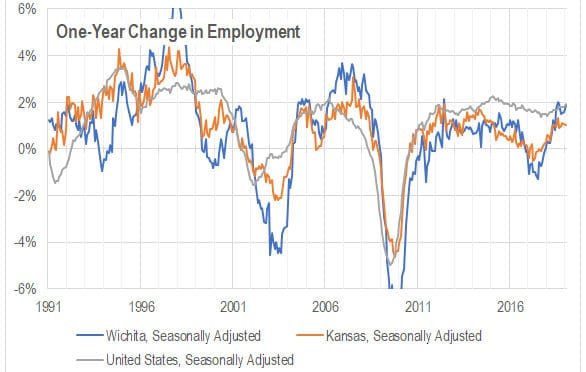
    Looking at the charts of changes in employment year-over-year, we see some months in the past year where Wichita outperformed the nation. That last happened in 2012.

  • State of the City, Wichita: The bright future

    State of the City, Wichita: The bright future

    Wichita Mayor Jeff Longwell’s State of the City video doesn’t seem to be based on reality.

    Recently Wichita Mayor Jeff Longwell delivered the State of the City video. It was posted to YouTube on March 28, 2019, and may be viewed here.

    Not long into the address, the mayor says, “… we must embrace the challenges we face and forge ahead into the bright future that is just around the corner.”

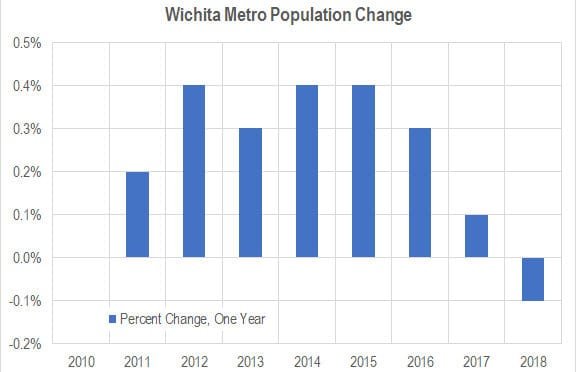
    Wichita MSA population, percent change from prior year. Click for larger.
    On that bright future: Since the mayor spoke, learned that the Wichita metropolitan area lost population during the year ending July 1, 2018. 1 So at the time of the address, Longwell didn’t know the area had lost population, but he should have known that the trend of population growth has been slowing, as can be seen in the nearby chart.

    What about the population of Wichita city proper, as that is the jurisdiction the mayor was elected to represent? (It’s better to look at the MSA, for a number of reasons. 2 For one, several major “Wichita” employers are not located within the Wichita city limits. Major portions of Spirit Aerosystems, for example, lie outside the city, and the city certainly takes credit for job creation there.)

    Wichita and top 100 city population, annual change. Click for larger.
    City populations are available through July 1, 2017. 3 From 2011 to 2017, the top 100 cities averaged annual growth of 1.03 percent. For the City of Wichita, the average was 0.29 percent, barely more than one-fourth the rate. (Wichita was the 50th largest city in 2017.) The trendline of growth for Wichita is down, as it is for the top 100 cities in general.

    We have to ask: With a population growing much slower than the nation — and declining in the most recent year — what is the future of Wichita?

    More importantly: Is Mayor Longwell aware of these statistics, and if so, why does he not recognize them? I hope this isn’t what he means by “embrace the challenges.”


    Notes

    1. Weeks, Bob. Wichita population falls; outmigration continues. Available at https://wichitaliberty.org/wichita-government/wichita-population-falls-outmigration-continues/.
    2. Weeks, Bob. Wichita metropolitan area population in context. Available at https://wichitaliberty.org/wichita-government/wichita-metropolitan-area-population-in-context/.
    3. Annual Estimates of the Resident Population for Incorporated Places of 50,000 or More, Ranked by July 1, 2017 Population: April 1, 2010 to July 1, 2017 U.S. Census Bureau, Population Division. Release Date: May 2018
  • Wichita aerospace manufacturing concentration

    Wichita aerospace manufacturing concentration

    Wichita leaders want to diversify the area economy. Has there been progress?

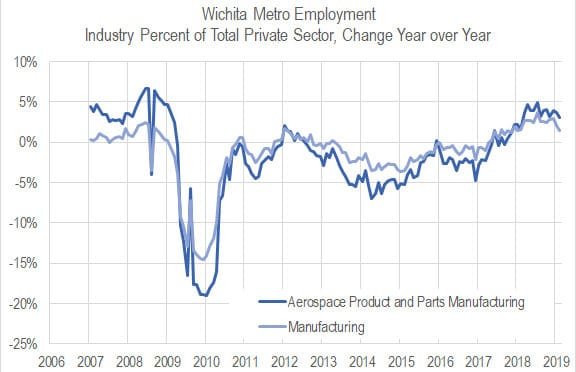
    One way to measure the concentration of an industry in a location is by the proportion of employment in that industry. The Bureau of Labor Statistics provides employment by industry for metropolitan areas. I’ve gathered the data for the Wichita MSA for two industries: Aerospace Product and Parts Manufacturing (NAICS code 3364) and all manufacturing. I’ve gathered this data for the Wichita Metropolitan Statistical Area and compare it to total private sector employment. This data is not adjusted for seasonality, as some is available only in that manner.

    As the charts illustrate, there was a large shift in the two industry’s share of employment around the time of the Great Recession. Since then, the ratios have been more stable, with a slow decline until a small reversal of that trend over the last year.

    The chart of employment ratio changes from the same month one year ago confirms: Manufacturing and aerospace employment has grown faster than total private employment in the recent year or so.

    Another way to measure the concentration of an industry is through location quotients. The Bureau of Labor Statistics provides these, most notably for counties as part of the Quarterly of Census and Wages. 1 As described by BLS, “Location quotients are useful for studying the composition of jobs in an area relative to the average, or for finding areas that have high concentrations of jobs in certain occupations. As measured here, a location quotient shows the occupation’s share of an area’s employment relative to the national average.” 2

    Further: “For example, a location quotient of 2.0 indicates that an occupation accounts for twice the share of employment in the area than it does nationally, and a location quotient of 0.5 indicates the area’s share of employment in the occupation is half the national share.”

    This data is available by industry. I’ve gathered data for Aerospace Product and Parts Manufacturing (NAICS code 3364) for Sedgwick County and present it in a nearby chart.

    First, note that the location quotient is large, 30 or more. This means the concentration of workers in this industry in Sedgwick county is over 30 times the concentration nationwide.

    Second, the location quotient fell from 2007 through 2014. Since then, it has been steady.

    Has the Wichita area diversified its economy? Based on these two measures, the answer is yes. That increased in diversity happened at the same time as a large decline in aviation-related employment, that decline being larger than the decline in all Wichita-area private-sector employment. That was not planned or desired. It was a result of worldwide trends. But since then, concentration in aviation-related employment has changed little and shows signs of increasing concentration.

    From General Aviation Manufacturers Association.


    Notes

    1. Bureau of Labor Statistics. Quarterly Census of Employment and Wages. Available at https://www.bls.gov/cew/datatoc.htm.
    2. Bureau of Labor Statistics. Using Location Quotients to Analyze Occupational Data. Available at https://www.bls.gov/oes/highlight_location_quotients.htm.
  • Wichita population falls; outmigration continues

    Wichita population falls; outmigration continues

    The population of the Wichita MSA fell from 2017 to 2018, and net domestic migration continues at a high level.

    New data from the United States Census Bureau shows the Wichita Metropolitan Statistical Area losing population from July 1, 2017, to July 1, 2018.

    The population estimate for 2017 was 645,628, and for 2018, 644,888. This is a decline of 740 persons, or -0.11 percent. Population changes in the seven years before 2018 averaged 0.30 percent each year.

    The Wichita MSA ranked 89th largest among 383 metro areas, falling from rank 82 as recently as 2011.

    Net domestic migration for the Wichita metro area showed a loss of 3,023 persons, or 0.47 percent of the population. This change, on a proportional basis, was 301st among the 383 metro areas. It is less than the loss of 3,235 persons the year before.

    Click charts for larger versions.

    Wichita MSA population and change from prior year.
    Wichita MSA population, percent change from prior year.
    Rank of Wichita MSA population.
    Rank of Wichita MSA population one-year change.
    Wichita MSA net domestic migration.
  • Wichita jobs and employment, February 2019

    Wichita jobs and employment, February 2019

    For the Wichita metropolitan area in February 2019, jobs are up, the labor force is up, and the unemployment rate is down when compared to the same month one year ago. Seasonal data shows a return to job growth.

    Data released today by the Bureau of Labor Statistics, part of the United States Department of Labor, shows an improving employment situation for the Wichita Metropolitan Statistical Area.

    Total nonfarm employment rose from 295,400 last February to 300,700 this February. That’s an increase of 5,300 jobs, or 1.8 percent. (This data is not seasonally adjusted, so month-to-month comparisons are not valid.) For the same period, jobs in the nation grew by 1.7 percent.

    The unemployment rate in February 2019 was 3.9 percent, down from 4.2 percent from one year ago.

    Considering seasonally adjusted data from the household survey, the labor force rose by 1,115 persons (0.4 percent) in February 2019 from January 2019, the number of unemployed persons fell by 64 (-0.5 percent), and the unemployment rate fell from 3.9 percent to 3.8 percent. The number of employed persons not working on farms rose to 300,080 in February from 298,01 the prior month, an increase of 1,179 persons, or 0.4 percent.

    Looking at the charts of changes in employment year-over-year, we see some months in the past year where Wichita outperformed the nation. That last happened in 2012.

    Click charts for larger versions.

  • Wichita and national jobs

    Wichita and national jobs

    Growth of employment in Wichita compared to the nation.

    Overall, since 2001 — roughly the end of the Great Recession — Wichita has been gaining jobs, evidence being its trend line above zero in the nearby chart which shows the change in jobs over the same month one year ago. But the line has not always been above zero, indicating months where the Wichita metropolitan area had fewer jobs than the year before.

    Since that time, Wichita’s growth rate has almost always been below the nation’s rate, and by no small amount. The state of Kansas has been lagging behind the nation, too.

    Click for larger.
  • Wichita jobs and employment, January 2019

    Wichita jobs and employment, January 2019

    For the Wichita metropolitan area in January 2019, jobs are up, the labor force is up, and the unemployment rate is unchanged when compared to the same month one year ago. Seasonal data shows a slowdown in the rate of job growth and a rising unemployment rate.

    Data released this week by the Bureau of Labor Statistics, part of the United States Department of Labor, shows a mostly improving employment situation for the Wichita Metropolitan Statistical Area, although some areas are not improving.
    Click for larger.
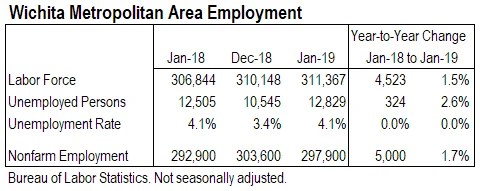
    Total nonfarm employment rose from 292,900 last January to 297,900 this January. That’s an increase of 5,000 jobs, or 1.7 percent. (This data is not seasonally adjusted, so month-to-month comparisons are not valid.) For the same period, jobs in the nation grew by 2.0 percent.

    The unemployment rate in January 2019 was 4.1 percent, unchanged from one year ago.

    Considering seasonally adjusted data from the household survey, the labor force rose by 739 persons (0.2 percent) in January 2019 from December 2018, the number of unemployed persons rose by 769 6.8 percent), and the unemployment rate rose from 3.6 percent to 3.9 percent. The number of employed persons not working on farms fell to 299,090 in January from 299,120 the prior month, a decrease of 30 persons, or 0.0 percent.

    BLS is revising some data and presented this monthly release in a slightly different format than usual.

    Click charts for larger versions.

  • Sedgwick County job growth exceeds national rate

    Sedgwick County job growth exceeds national rate

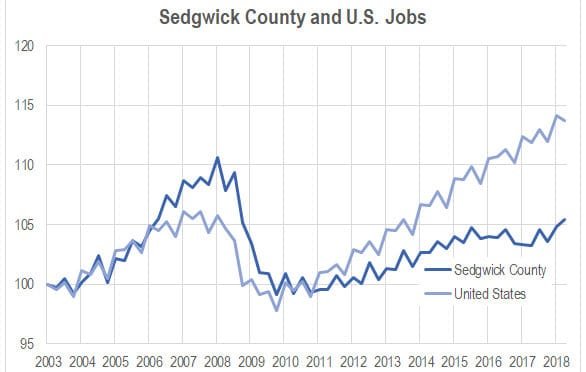
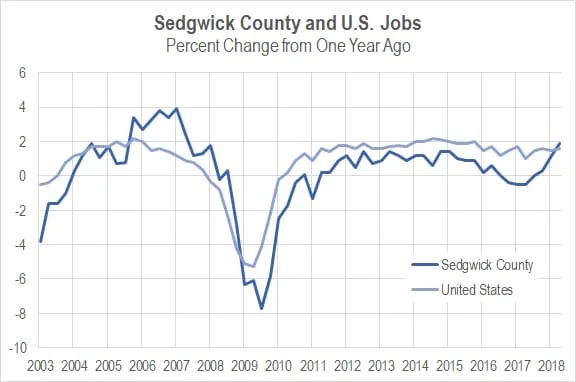
    In the third quarter of 2018, Sedgwick County quarterly job growth exceeded the national rate for the first time in nearly ten years.

    Data released today by the Bureau of Labor Statistics, part of the United States Department of Labor, show an improving jobs picture for Sedgwick County.

    Data from the Bureau’s Quarterly Census of Employment and Wages (QCEW) program show that from September 2017 to September 2018, Sedgwick County gained 5,200 jobs, which is a rate of 1.9 percent, as calculated by BLS. For the nation, growth was 1.6 percent.

    While the rate in Sedgwick County for the third quarter of 2018 exceeded the national rate, for the most recent four quarters the average rate for Sedgwick County was 0.85 percent, and 1.55 percent for the nation. This was the first quarter since 2009 in which Sedgwick County job growth outpaced the nation.

    Average weekly wages in Sedgwick County increased by 3.8 percent over the year to $880. For the nation, wages rose by 3.3 percent to $1,055.

    Click charts for larger versions.

  • Sedgwick County Commission needs to slow down, get things right

    Sedgwick County Commission needs to slow down, get things right

    Sedgwick County needs to make sure past issues are known and settled before proceeding with hiring a new county manager, writes former commissioner Richard Ranzau.

    While most members of the Sedgwick County Commission are eager to move on from events of the past two years, it’s important to know what really happened. Some important questions:

    • A majority of commissioners wanted to fire former manager Michael Scholes, with chair David Dennis presenting Scholes with an ultimatum on September 28, 2018. Later, in November, the same commissioners hired an outside law firm to investigate Scholes so that a politically correct reason could be given for his dismissal. We need to know more about the real reason why commissioners wanted to fire Scholes.

    • What is contained within the report (identified in county documents as “Management study – Stinson, Leonard & Street”) used as the cover for firing Scholes? The county will not supply the document, citing attorney-client privilege and personnel confidentiality. This allows commissioners to make all sorts of claims that we can’t verify. For example: The many high-level employees that purportedly quit because of Scholes — can’t we get even one name?

    • Some conclusions from the Stinson report has been leaked, and the bad conduct by Scholes was really quite minor.

    • The Wichita Eagle has reported: “Commission Chairman David Dennis said Wednesday [November 26, 2018] that he’s ready to move forward with a probe examining commissioners’ actions and whether they’ve contributed to low morale and an exodus of top county employees.” As Ranzau writes below, the commission is being asked to cancel this investigation.

    County Commission needs to slow down, get things right
    By Richard Ranzau

    Members of the Sedgwick County Commission have two very important decisions to make, and they need to get them both right.

    First, they need to decide if they are going to conduct the badly needed ethics investigation into commissioner misconduct that occurred in 2017 and 2018. Previously, the Commission voted to conduct this investigation but they have yet to follow through. Failed leadership and improper behavior by the some of the commissioners during those years has led to multiple FBI investigations and a soon to be completed KOMA investigation by the District Attorney’s office. The reputation of the Commission has been shattered.

    Public faith and confidence in this once highly respected organization can only be restored if the Commission hires an outside entity to investigate unethical and inappropriate commissioner behavior and to make recommendations for policy changes that could deter future misconduct. This must be an honest and sincere effort by the Commissioners to find out the truth, no matter how painful it may be.

    All staff members and employees should be allowed to fully participate in the investigation without fear of repercussion. Senior staff members with extensive knowledge of what happened, including the interim county manager, should be supportive of this investigation and provide honest and candid information about what they know.

    Citizens may wonder why we need another investigation, given that an expensive effort was recently completed and used to justify the dismissal of the previous county manager. But that investigation was a sham. A majority of commissioners had already decided to fire the manager. They needed an investigation to cover up their real reasons for firing him. This is the behavior that needs to be exposed.

    This investigation needs to be completed BEFORE the Commission makes its second important decision: hiring a new county manager.

    The current rush to appoint the interim county manager without a nationwide search is imprudent for multiple reasons. First, he has intimate knowledge of what happened over the last two years and the public needs to be assured that he will fully support and participate in the ethics investigation.

    Secondly, there is an ongoing effort by four commissioners to put forth a public vote to rescind the decision to proceed with an investigation. Commissioner Howell is being pressed to support this effort, not only by the Chairman, but also the interim county manager and county counselor. In fact, the interim county manager has asked Commissioner Howell to make the motion to end the investigation.

    The fact that the interim county manager would try to coordinate a vote to stop an ethics investigation that he would be a key witness in is as surprising as it is troubling. He knows what happened and he shared many of the same concerns as the previous county manager and county counselor. So why would he support and COORDINATE an effort to cancel this badly needed investigation? Is he under pressure by commissioners?

    The timing of this effort to stop the ethics investigation coupled with the rush to hire a potentially key witness as the new county manager, certainly raises the question as to whether or not there is a quid pro quo going on. I certainly hope this is not the case, but the optics are horrible. The commission does not need another scandal or coverup.

    The Sedgwick County Commission and interim county manager need to take a step back and reconsider what they are doing. Everyone involved needs to demonstrate the courage to do what is right for the community. It is imperative they demonstrate a commitment to open, transparent, and ethical government.

    The citizens need to have confidence that the shenanigans of the past, are in fact, in the past. We can’t afford to have the Commission get this wrong.