Here’s a map I created of the vote percentage Governor Sam Brownback received by precinct. To use an interactive version of this map, click here. On the interactive map you may zoom and scroll, and you may click on a precinct for more information about the votes for that precinct.
Tag: Paul Davis
Kansas school claims, numbers don’t match
Kansas school spending advocates make claims of exploding class sizes that aren’t reflected in enrollment and employment data.
On Facebook, an activist makes a claim that, if accurate, is alarming:
I walked with Paul Davis yesterday. I introduced him to Mrs. Scrutin. She teaches 4th grade at Mill Creek Elementary, here in Lenexa. She has seen class sizes explode from 16, to 23, now for the 2014-2015 school year 30.
I gathered data from the Kansas State Department of Education and created an interactive visualization. (I’m not making the visualization available just yet, as there are some data consistency issues I need to address, and I hope to receive data for additional years.)
Looking at data for Mill Creek Elementary in the Shawnee Mission School District, the number of certified employees and K-12 teachers at the school has been falling. In 2014 there were 21 K-12 teachers, down from 27 in 2009.
Enrollment, too, has been on the decline, from 443 students in 2009 to 368 in 2014. The pupil-teacher ratio in 2009 was 16.2. It reached 17.1 two years later, and in another two years it fell to 16.4, and rose to 17.9 for 2014.
Pupil-teacher ratio is not equivalent to class size. It is simply the number of pupils divided by the number of teachers. Class sizes could be larger or smaller, and may vary from room to room. Although the pupil-teacher ratio rose for Mill Creek Elementary, let’s place it in context. For a hypothetical school of 1,000 students, the change that Mill Creek experienced from 2009 to 2014 means going from 62 teachers to 56 teachers.
With Mill Creek’s pupil-teacher ratio remaining almost unchanged, how do class sizes “explode from 16, to 23, now for the 2014-2015 school year 30?”
I don’t have data for the 2014-2015 school year. But if class sizes are “exploding” at the same time the pupil-teacher ratio rose only slightly, what is the explanation?
Remember, K-12 teachers are not the only employees at this school. In 2009 there were also 31 certified employees in addition to K-12 teachers. That number is down to 24 for 2014. In terms of pupil-employee ratios, the change over this time has been from 14.3 pupils per certified employee to 15.3.
Kansas school spending, contrary to Paul Davis
Claims about school spending made by a Kansas Democratic Party leader don’t quite align with facts.
It is commonplace for liberal Kansas politicians and newspaper editorial pages to complain about severely cut spending on schools in Kansas. A recent example is Paul Davis in the Wichita Eagle.
Nearby is a chart of Kansas school spending (click it for a larger version). It’s adjusted for inflation. Spending is not as high as it was at its peak, but Davis’ claim of students who “have experienced severe budget cuts” don’t match the facts.
Now, it’s possible that Davis may want readers to consider only a portion of school spending, that being base state aid per pupil. It’s the starting point for the Kansas school finance formula, and therefore an important number.
Base state aid per pupil has fallen in recent years. Because of this, public school spending advocates claim that spending has been cut. But that’s not the case. As shown in the nearby chart, there has been a steady increase in measures of school spending when compared to base state aid.
In the last school year base state aid per pupil was $3,838. That’s the figure often used as the level of school spending. But in that year total Kansas state spending per pupil $6,984, or 1.82 times base state aid. Adding local and federal sources, spending was $12,781 per student, or 3.33 times base state aid.
Considering Kansas state spending only, the ratio of state spending to base state aid was 1.10 in 1998. By 2013 that ratio had risen to 1.82, an increase of 65 percent for the ratio. For total spending, the ratio rose from 1.86 to 3.33 over the same period, an increase of 79 percent.
What’s important to realize is that the nature of Kansas school funding has changed in a way that makes base state aid per pupil less important as an indicator of school spending.
The Kansas Supreme Court had something to say about this in its recent Gannon opinion that sent part of the case back to the lower court with instructions: All funding sources are to be considered: “In the panel’s assessment, funds from all available resources, including grants and federal assistance, should be considered.”
I wonder: Those who call for a return to the level of base state aid of 20 years ago (adjusted for inflation, of course): Would they also accept returning to the same ratios of total spending to base state aid?
After Gannon, will Kansas public school spending boosters still love courts and constitutions?
Will Kansas Progressives’ expressed love for courts and constitutions hold up in light of the school finance decision?
In January Paul Davis, a prominent Kansas Democrat and candidate for governor, tweeted “With the school ruling due any day now, will Brownback comply w/the court order or try & rewrite the KS constitution?” These words were followed by a link to Davis’ website that copies an article from the New York Times. (That article has its own host of problems, explained in New York Times on Kansas schools, again and More about the New York Times on Kansas school finance.)
This mantra — that the Kansas Constitution requires the legislature to spend more on public schools — has been the drumbeat of Kansas Progressives. Their reverence for and deference to the Kansas Constitution is curious in light of their opinion of the United States Constitution.
The Kansas Supreme Court’s decision in Gannon v. Kansas contains something that Kansas Progressives support: A ruling that Kansas schools are not funded equitably. It’s thought by many that $129 million in extra spending is needed to fix the discrepancy.
But the Supreme Court stopped there, sending the issue of adequate funding back to the lower court along with a few instructions. It’s these instructions that will test Kansas Progressives’ belief in the wisdom of courts and their reverence for the Kansas Constitution.
Kansas public school spending supporters — that right there gives away their main motivation — want more school spending. Whatever distortions of facts they make, well, it’s all for the kids, don’t you know?
So right away the public school spending supporters want to deflect attention away from the performance of Kansas schools. Spending is easier to talk about, and the facts about Kansas school performance is not nearly as pretty as the education establishment wants you to believe. Two things to know: When evaluated in the light of the demographic differences between Kansas and other states, the performance advantage of Kansas largely disappears (see Kansas school test scores must be evaluated considering demographics. Further, Kansas has weak standards for its schools, and further weakened them not long ago (see Why are Kansas school standards so low?).
The Court had something to say about this in its opinion: “Regardless of the source or amount of funding, total spending is not the touchstone for adequacy in education required by Article 6 of the Kansas Constitution.” So perhaps we will see a court consider the results of Kansas schools rather than just the inputs.
Then, when we consider spending, the public school spending establishment performs a slight of hand, directing attention to only a portion of spending on schools: base state aid per pupil. That measure of spending has declined. But it’s a narrow measure. In the last school year base state aid per pupil was $3,838. That’s the figure often used as the level of school spending. But in that year total Kansas state spending per pupil $6,984, or 1.82 times base state aid.
Adding local and federal sources, spending was $12,781 per student, or 3.33 times base state aid.
This is important, as the Court issued some instructions in its remanding of the case to the lower court. All funding sources are to be considered: “In the panel’s assessment, funds from all available resources, including grants and federal assistance, should be considered.”
Also, the public school spending establishment has argued that spending on teacher retirement shouldn’t be included in school spending. It doesn’t make it into the classroom, they say. (One wonders if teachers would continue to work if schools did not provide a retirement program.) But the Court has a different opinion: “Moreover, state monies invested in the Kansas Public Employees Retirement System (KPERS) may also be a valid consideration because a stable retirement system is a factor in attracting and retaining quality educators — a key to providing an adequate education.”
The Court gave the public school spending establishment a little hope for relief. Often that establishment says that a multitude of rules and regulations prevent funds from being spent in the way they want. The Court said these restrictions may be considered: “The panel may consider the restrictions on the use of these federal, pension, and other funds and determine that even with the influx of these additional monies the school districts are unable to use them in the manner necessary to provide adequacy under Article 6. But regardless of the source or amount of funding, total spending is not the touchstone for adequacy.”
There again the Court issued the instruction regarding spending as a measure of an adequate education.
WichitaLiberty.TV: For whose benefit are elections, school employment, wind power, unions, unemployment
In this episode of WichitaLiberty.TV: The controversy over the timing of city and school board elections provides an insight into government. Then: Can a candidate for governor’s claims about Kansas school employment be believed? Wind power is expensive electricity, very expensive. A Wichita auto dealer pushes back against union protests. Finally, what is the real rate of unemployment in America? Episode 36, broadcast March 23, 2014. View below, or click here to view at YouTube.
Kansas school employment: Mainstream media notices
When two liberal newspapers in Kansas notice and report the lies told by a Democratic candidate for governor, we know there’s a problem. (Okay, the Kansas City Star is really a Missouri newspaper, but covers Kansas too.)
Peter Hancock wrote in the Lawrence Journal World: “Rep. Paul Davis, D-Lawrence, the presumptive Democratic nominee for governor, reportedly claimed again last week that school funding cuts under Gov. Sam Brownback’s administration have led to ‘thousands’ of teacher layoffs, a claim that has already been shown to be greatly exaggerated.” (Davis still exaggerating teacher layoff claims, March 12, 2013)
On the same day Steve Kraske of the Star reported: “Kansas Democratic gubernatorial candidate Paul Davis appears to be exaggerating the number of teacher layoffs under Gov. Sam Brownback. In an Overland Park forum last week, Davis said said that the governor’s budget cuts to education had resulted in thousands of teacher layoffs. But an annual personnel report from the state Education Department showed that a total of only 201 teachers were the victims of a ‘reduction in force’ in the 2011 and 2012 school years.” (Davis exaggerates teacher layoff figures)
None of this is news, at least to those who have been paying attention and are willing to dig into the Kansas State Department of Education for statistics. Well, the part about Paul Davis telling lies is news, as it is ongoing and contrary to the facts that Rep. Davis must surely know. (If he doesn’t know, what does that tell us?)
Last July I obtained, analyzed, and reported on Kansas school employment trends. I found that the situation is not the same in every school district. But considering the entire state, two trends emerge. For the past two years, the number of teachers employed in Kansas public schools has risen. Correspondingly, the pupil-teacher ratio has fallen.
The trend for certified employees is a year behind that of teachers, but for the last year, the number of certified employees has risen, and the ratio of these employees to pupils has fallen.
There’s also a video explaining these statistics. View it below, or click here to view in high definition at Youtube.
Davis and others complain that class sizes in Kansas schools are rising. I understand that the ratio of teachers to pupils is not the same statistic as class size. They measure different things. But if Kansas schools, considered as a whole, have rising teacher and certified employment levels that leads to decreasing pupil to teacher ratio, and at the same time class sizes are increasing — we have to wonder about the management of schools.
I’ve created interactive visualizations that let you examine the employment levels and ratios in Kansas school districts. Click here for the visualization of employment levels. Click here for the visualization of ratios (pupil-teacher and pupil-certified employee).
Data is from Kansas State Department of Education. Visualization created by myself using Tableau Public.
Kansas school employment: The statistics and the claims
Claims made about Kansas schools don’t match the state’s statistics.
Responding to the State of the State Address delivered by Kansas Governor Sam Brownback, Kansas House of Representatives Minority Leader and gubernatorial candidate Paul Davis provided figures regarding Kansas public schools, telling Kansans: “On top of that, public school class sizes are growing, [and] teachers have been laid off by the thousands.”
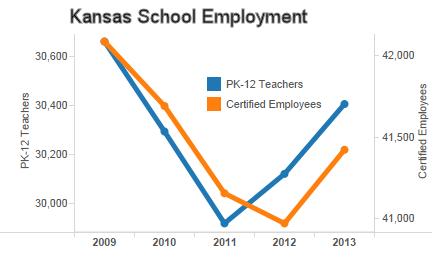
Statistics from Kansas State Department of Education, however, show that school employment has rebounded, both in terms of absolute numbers of teachers and certified employees, and the ratios of pupils to these employees.
The story is not the same in every district. But considering the entire state, two trends emerge. For the past two years, the number of teachers employed in Kansas public schools has risen. Correspondingly, the pupil-teacher ratio has fallen. (This ratio is not the same statistic as average class size, but it’s the data we have. Plus, if schools are hiring teachers at a rate higher than the increase in students, we should expect class sizes to fall.)
The trend for certified employees is a year behind that of teachers, but for the last year, the number of certified employees has risen, and the ratio to pupils has fallen.
I’ve created interactive visualizations that let you examine the employment levels and ratios in Kansas school districts. Click here for the visualization of employment levels. Click here for the visualization of ratios (pupil-teacher and pupil-certified employee). Data is from Kansas State Department of Education. Visualization created by myself using Tableau Public.
There’s also this to consider about class size. In 2011 the Center for American Progress released a report about class size reduction in schools and the false promise it holds for improving student achievement. (The False Promise of Class-Size Reduction)
It’s quite astonishing to see CAP cite evidence from Eric Hanushek of the Hoover Institution and Caroline Hoxby of Stanford and Hoover. These two researchers are usually condemned by the public education establishment and bureaucracy, including teachers unions. These are some of the key constituents CAP usually caters to.
In a nutshell, class size reduction produces very little benefit for students. It’s also very expensive, and there are other things we should be doing instead if we really want to increase student achievement.
The report summarizes the important studies in class size reduction. The upshot is that there is only one study showing positive results from class size reduction, and that effect was found only among the early grades. The effect decreased after a few years, even though small class sizes were still used.
The report also notes that class size reduction is very expensive to implement. Because it is, the report says we should look to other ways to increase student achievement, such as policies relating to teacher effectiveness: “The emerging consensus that teacher effectiveness is the single most important in-school determinant of student achievement suggests that teacher recruitment, retention, and compensation policies ought to rank high on the list.”
On teacher quality and teacher effectiveness: When Sandi Jacobs of National Council for Teacher Quality appeared in Kansas a few years ago, we learned that Kansas ranks below average on its policies that promote teacher quality.
In the example she illustrated, third graders who had teachers in the top 20 percent of effectiveness for the next three years went from the 50th percentile in performance to the 90th. For students with teachers in the lowest 20 percent for the same period, their performance dropped from the 50th percentile to the 37th percentile. More on this topic is at Kansas ranks low in policies on teacher quality.
Kansas school employment: The claims compared to statistics
Claims made about Kansas schools don’t match the state’s statistics.
Responding to the State of the State Address delivered by Kansas Governor Sam Brownback, Kansas House of Representatives Minority Leader and gubernatorial candidate Paul Davis provided figures regarding Kansas public schools, telling Kansans: “On top of that, public school class sizes are growing, [and] teachers have been laid off by the thousands.”
Statistics from Kansas State Department of Education, however, show that school employment has rebounded, both in terms of absolute numbers of teachers and certified employees, and the ratios of pupils to these employees.
The story is not the same in every district. But considering the entire state, two trends emerge. For the past two years, the number of teachers employed in Kansas public schools has risen. Correspondingly, the pupil-teacher ratio has fallen. (This ratio is not the same statistic as average class size, but it’s the data we have. Plus, if schools are hiring teachers at a rate higher than the increase in students, we should expect class sizes to fall.)
The trend for certified employees is a year behind that of teachers, but for the last year, the number of certified employees has risen, and the ratio to pupils has fallen.
I’ve created interactive visualizations that let you examine the employment levels and ratios in Kansas school districts. Click here for the visualization of employment levels. Click here for the visualization of ratios (pupil-teacher and pupil-certified employee). Data is from Kansas State Department of Education. Visualization created by myself using Tableau Public.
There’s also this to consider about class size. In 2011 the Center for American Progress released a report about class size reduction in schools and the false promise it holds for improving student achievement. (The False Promise of Class-Size Reduction)
It’s quite astonishing to see CAP cite evidence from Eric Hanushek of the Hoover Institution and Caroline Hoxby of Stanford and Hoover. These two researchers are usually condemned by the public education establishment and bureaucracy, including teachers unions. These are some of the key constituents CAP usually caters to.
In a nutshell, class size reduction produces very little benefit for students. It’s also very expensive, and there are other things we should be doing instead if we really want to increase student achievement.
The report summarizes the important studies in class size reduction. The upshot is that there is only one study showing positive results from class size reduction, and that effect was found only among the early grades. The effect decreased after a few years, even though small class sizes were still used.
The report also notes that class size reduction is very expensive to implement. Because it is, the report says we should look to other ways to increase student achievement, such as policies relating to teacher effectiveness: “The emerging consensus that teacher effectiveness is the single most important in-school determinant of student achievement suggests that teacher recruitment, retention, and compensation policies ought to rank high on the list.”
On teacher quality and teacher effectiveness: When Sandi Jacobs of National Council for Teacher Quality appeared in Kansas a few years ago, we learned that Kansas ranks below average on its policies that promote teacher quality.
In the example she illustrated, third graders who had teachers in the top 20 percent of effectiveness for the next three years went from the 50th percentile in performance to the 90th. For students with teachers in the lowest 20 percent for the same period, their performance dropped from the 50th percentile to the 37th percentile. More on this topic is at Kansas ranks low in policies on teacher quality.
Job claims in Kansas addresses
How can conflicting jobs claims made by two Kansas leaders and candidates for governor be reconciled?
Listening to the State of the State Address and the official response might cause Kansans to become confused, or worse. The claims made by Sam Brownback and Paul Davis appear to contain conflicting views of Kansas employment.
In the State of the State Address, Brownback said “Since December 2010, Kansas has added on average, more than a thousand private sector jobs every month.”
Davis, in the official response, said “According to the latest jobs report — released just a few weeks ago — there are 16,000 fewer Kansans working than when Governor Brownback took office.”
First, Davis made a mistake. He cited a number that measure the labor force and said it represented the number of Kansans working. But the labor force, according to the Bureau of Labor Statistics, is “the sum of employed and unemployed persons.” In other words, it is the number of people working plus the number of people looking for work.
Aside from this, who is correct? The answer is not easy to provide. That’s because there are two series of employment data provided by the Bureau of Labor Statistics. The two series don’t measure exactly the same thing, and each of these candidates for Kansas governor has chosen to use the series that benefits their campaign. Nearby is an example of just how different the two series can appear.
A document from BLS titled Employment from the BLS household and payroll surveys: summary of recent trends explains in brief: “The Bureau of Labor Statistics (BLS) has two monthly surveys that measure employment levels and trends: the Current Population Survey (CPS), also known as the household survey, and the Current Employment Statistics (CES) survey, also known as the payroll or establishment survey. … These estimates differ because the surveys have distinct definitions of employment and distinct survey and estimation methods.”
Another BLS document explains in detail the differences between the CPS and CES data. For example: CES: “Designed to measure employment, hours, and earnings with significant industrial and geographic detail” CPS: “Designed to measure employment and unemployment with significant demographic detail.”
Another difference: CES: “Self-employed persons are excluded.” CPS: “Self-employed persons are included.” (See Understanding the employment measures from the CPS and CES survey.)
I’ve prepared a table showing the claims made primarily by the Davis campaign in December (since it provided the most detail) and gathered data from both the CES and CPS series. I’ve also showed the seasonally adjusted data compared to the raw data when available. Sometimes the numbers match exactly with the claims made by the campaigns, and sometimes the numbers are a little different. Click here for the full table.
I’ve also created an interactive visualization of the CPS and CES data for Kansas. Click here to open it in a new window.Each campaign uses the data that best makes its case. Generally speaking, the CES data shows larger employment gains.
We still have this question: Who is correct? Here’s something to consider. On the national level, a widely-watched number each month is the count of new jobs created. This number, which is universally considered to be important, comes from the CES survey. That’s the number that shows quite a bit of job growth in Kansas.