Tag: Kansas state government

Articles about Kansas, its government, and public policy in Kansas.

  • McGinn, as committee chair, was not for performance measures

    McGinn, as committee chair, was not for performance measures

    A 2011 Kansas bill could have increased the accountability of state government, but committee chair Carolyn McGinn wasn’t in favor.

    In the 2011 session of the Kansas Legislature, several bills were proposed that would streamline government and investigate opportunities for privatization.

    Another proposed bill in 2011 was HB 2158, which would have created performance measures for state agencies and reported that information to the public. The supplemental note says that the bill “as amended, would institute a new process for modifying current performance measures and establishing new standardized performance measures to be used by all state agencies in support of the annual budget requests. State agencies would be required to consult with representatives of the Director of the Budget and the Legislative Research Department to modify each agency’s current performance measures, to standardize such performance measures, and to utilize best practices in all state agencies.” Results of the performance measures would be posted on a public website.

    This bill passed the House of Representatives by a nearly unanimous vote of 119 to 2. But in the Senate, this bill was victim of a “gut-and-go” maneuver in a committee chaired by Carolyn McGinn. In effect, the bill died and was not considered by the entire Senate.

    This bill proposed to spend modest amounts increasing the manageability of government, not the actual range and scope of government itself. It, along with the other two, would have started Kansas on a path towards spending responsibly.

    As it turns out, many in the legislature — this includes Senate Republicans who initiated or went along with the legislative maneuvers that killed these bills — are happy with the operations of state government remaining in the shadows.

  • Women for Kansas voting guide should be read with caution

    Women for Kansas voting guide should be read with caution

    If voters are relying on a voter guide from Women for Kansas, they should consider the actual history of Kansas taxation and spending before voting.

    A political advocacy group known as Women for Kansas has produced a voting guide, listing the candidates that it prefers for Kansas House of Representatives. But by reading its “Primer on the Issues,” we see that this group made its endorsements based on incorrect information.

    One claim the group makes is this regarding taxes in Kansas: “Income taxes were reduced for many Kansans in 2012 and 2013, and eliminated entirely for some, with a corresponding increased reliance on sales taxes and local property taxes. This shifted the tax burden to the less affluent and from the state to counties, cities and school districts.”

    This is a common theme heard in Kansas the past few years. But let’s unravel a few threads and look at what is actually happening. First, keep in mind that the lower tax rates took effect on January 1, 2013, just 1.5 years ago.

    Then, Women for Kansas may be relying on information like this: A university professor who is a critic of Sam Brownback recently wrote in a newspaper column that “Property taxes are on track to increase by more than $400 million statewide during Gov. Sam Brownback’s term in office.”

    Through correspondence with the author, Dave Trabert of Kansas Policy Institute found that this claim is based on increases of $300 million plus an estimated $100 million increase yet to come. Trabert noted that this amounts to an increase of 11 percent over four years. To place that in context, property taxes increased $767 million and 29 percent during the first term of Kathleen Sebelius. Inflation was about the same during these two periods. A more accurate claim would be that Kathleen Sebelius shifted taxes to counties, cities, and school districts, and that Sam Brownback’s administration has slowed the rate of local property tax increases compared to previous governors.

    Another claim made by Women for Kansas concerns school spending: “Reflecting decreased revenues due to tax cuts, per-pupil spending is down, and both K-12 and higher education are facing further reductions in the immediate future.”

    The allegations that per-pupil spending is down due to tax cuts is false. The nearby chart of Kansas school spending (per pupil, adjusted for inflation) shows that spending did fall, but under budgets prepared by the administrations of Kathleen Sebelius and Mark Parkinson. Since then, spending has been fairly level. (Remember, lower tax rates have been in effect for just 1.5 years.)

    Kansas school spending, per student, from state, local, and federal sources, adjusted for inflation.
    Kansas school spending, per student, from state, local, and federal sources, adjusted for inflation.

    If we look at other measures of school support, such as pupil teacher ratios, we find that after falling during the administrations of previous governors, these ratios have rebounded in recent years.

    When spending figures for the just-completed school year become available, it’s likely that they will show higher spending than the previous year. That’s been the trend.

    If you’ve received or read the voter guide from Women for Kansas, please consider the actual history of Kansas taxation and spending before voting.

  • The Kansas economy under guidance of moderates

    The Kansas economy under guidance of moderates

    Before wishing for a return to the “good old days,” let’s make sure we understand the record of the Kansas economy.

    Some in Kansas are calling for a return to the “moderate” and “reasonable” policies of past leadership, with a particular nostalgia for the tenures of governors Bill Graves and Kathleen Sebelius. But before getting what we wish for, let’s make sure we understand the history of the Kansas economy.

    In September 2005 the Center for Economic Development and Business Research at Wichita State University published a report titled “Measuring Economic Performance for the 50 States and the District of Columbia.” The data covers the ten years between 1994 and 2003. For context, Bill Graves became governor of Kansas in 1995 and served for eight years. Following is a sample from that document. It reads:

    It is clear that the Kansas economy has not performed well over the past 10 years. With the exception of job creation (middle third), Kansas has ranked among the bottom third of states across economic performance measures. Kansas has performed below the average for the Plains States Region in 5 out of the 6 measures examined as well. (Job growth in Kansas equaled the regional average at 1.4 percent annually.)

    Kansas Economic Performance, from Center for Economic Development and Business Research at Wichita State University, September 2005

    Let’s be careful what we wish for in Kansas.

  • Recommended: Kansas Meadowlark

    Recommended: Kansas Meadowlark

    It’s been around for a long time, and is the best site for aggregation of Kansas-centric news and opinion. It’s Kansas Meadowlark, run by Earl Glynn of Overland Park. I recommend you take a look.

    Kansas Meadowlark example

  • Job growth in the states and Kansas

    Job growth in the states and Kansas

    Let’s ask critics of current Kansas economic policy if they’re satisfied with the Kansas of recent decades.

    Critics of Kansas Governor Sam Brownback and his economic policies have pounced on slow job growth in Kansas as compared to other states.

    Private sector employment growth in the states, Kansas highlighted. Click for larger version.
    Private sector employment growth in the states, Kansas highlighted. Click for larger version.
    The nearby illustration shows private sector job growth in the states during the period of the Graves/Sebelius/Parkinson regimes. This trio occupied the governor’s office from 1994 to 2011. Kansas is the dark line.

    At the end of this period, Kansas is just about in the middle of the states. But notice that early in this period, the line for Kansas is noticeably nearer the top than the bottom. As time goes on, however, more states move above Kansas in private sector job creation.

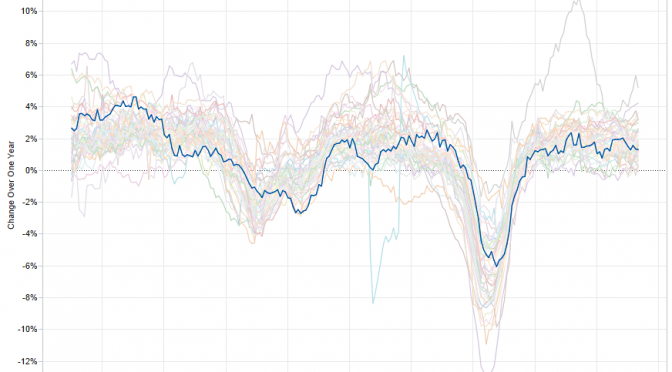
    Private sector employment growth in the states, year-over-year change, Kansas highlighted. Click for larger version.
    Private sector employment growth in the states, year-over-year change, Kansas highlighted. Click for larger version.
    The second illustration shows the one-year change in private sector job growth, Kansas again highlighted. Note there are some years during the first decade of this century where Kansas was very near the bottom of the states in this measure.

    Some Kansas newspaper editorialists and candidates for office advocate for a return to the policies of Graves/Sebelius/Parkinson. Let’s ask them these questions: First, are you aware of the poor record of Kansas? Second, do you want to return to job growth like this?

    How to use the visualization.
    How to use the visualization.
    I’ve gathered and prepared jobs data in an interactive visualization. You may click here to open the visualization in a new window and use it yourself. Data is from Bureau of Labor Statistics, U.S. Department of Labor. This data series is the Current Employment Statistics (CES), which is designed to measure employment, hours, and earnings with significant industrial and geographic detail. More information about his data series is at Understanding the employment measures from the CPS and CES survey.

  • Third annual Kansas Freedom Index released

    Third annual Kansas Freedom Index released

    From Kansas Policy Institute.

    3rd Annual Kansas Freedom Index Released

    Support of Freedom About More Than Politics, IDs Role of Government and Freedom of Citizens

    July 1, 2014 — Wichita — Kansas Policy Institute released a new scorecard tracking votes from the 2014 legislative session. The third annual Kansas Freedom Index takes a broad look at voting records and establishes how supportive state legislators are regarding economic freedom, student-focused education, limited government, and individual liberty. The Index is intended to provide educational information to the public about broad economic and education freedom issues that are important to the citizens of our State. It is the product of nonpartisan analysis, study, and research and is not intended to directly or indirectly endorse or oppose any candidate for public office.

    “An informed citizenry is an essential element of maintaining a free society. Having a deeper understanding of how legislation impacts education freedom, economic freedom and the constitutional principles of individual liberty and limited government allows citizens to better understand the known and often unknown consequences of legislative issues,” said KPI president Dave Trabert.”

    A Freedom Percentage is calculated for each legislator, representing the relative position of a legislator’s raw score on a number line of the minimum and maximum score, with the percentage indicating proximity to the maximum score.

    A positive cumulative score (or a Freedom Percentage above 50%) indicates that a legislator generally supported economic and education freedom, while a negative cumulative score (or Freedom Percentage below 50%) indicates that a legislator was generally opposed. A score of zero or a Freedom Percentage of 50% indicates that a legislator was generally neutral. The cumulative score only pertains to the specific votes included in the Kansas Freedom Index and should not be interpreted otherwise. A different set of issues and/or a different set of circumstances could result in different cumulative scores.

    Trabert continued, “Each year it has been clear that support of economic freedom isn’t an issue of political affiliation. Republicans represented at least 70 percent of all House members and all Senate members since 2012. Those counts would produce fairly strong results one way or the other if economic freedom was a partisan issue, but instead, the overall score of both chambers was very near neutral.”

    Trabert concluded, “Too often votes come down to parochial or personal issues and the idea of freedom is left on the legislature’s cutting room floor. Hopefully, the Kansas Freedom Index can start to recalibrate citizens and legislators towards supporting the freedoms of everyday Kansans and not be driven by politics.”

    2014 Freedom Index by the Numbers
  • Kansas expenditures, compared to others

    Kansas expenditures, compared to others

    Spending by Kansas state and local governments has grown faster than in most other states.

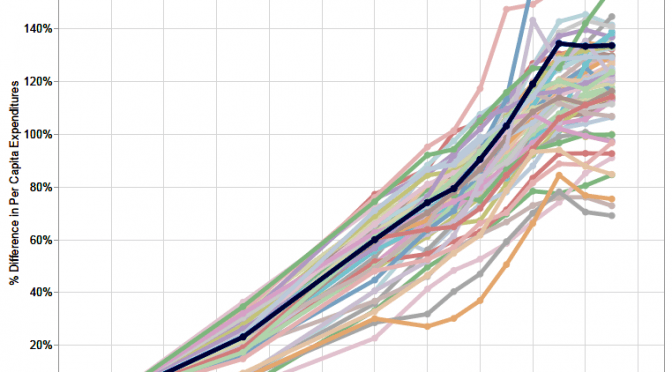
    State and local direct general expenditures, per capita, growth since 1991. Kansas is the dark line.
    State and local direct general expenditures, per capita, growth since 1991. Kansas is the dark line.
    Using data gathered by Tax Policy Center at Brookings Institution, I’ve prepared an interactive visualization of state spending trends over time. Click here to open the visualization in a new window. You may click on any number of states to highlight them. (Use Ctrl+click to add states after the first.) You may also choose “in or out” of the set of states near Kansas. Finally, you can select a range of years. This data is indexed, meaning that states start at the same level, so that relative changes in spending may be seen.

    Data is from State & Local Government Finance Data Query System. http://slfdqs.taxpolicycenter.org/pages.cfm. The Urban Institute-Brookings Institution Tax Policy Center. Data from U.S. Census Bureau, Annual Survey of State and Local Government Finances, Government Finances, Volume 4, and Census of Governments (1977-2011). Date of Access: (29-Jul-2013).

  • Kansas political signs are okay, despite covenants

    Kansas law overrides neighborhood covenants that prohibit political yard signs before elections.

    Some neighborhoods have restrictive covenants that prohibit homeowners from placing any signs in their yard except signs advertising homes for sale. But a 2008 Kansas law overrides these restrictive covenants to allow for the placement of small political yard signs starting 45 days before an election. Still, residents of covenant neighborhoods may want to observe their neighborhood’s restrictions.

    For the August 5, 2014 primary election, the 45 day period in which signs are allowed started on June 21. (Although I could be off by a day. Sometimes lawyers count days in strange ways.)

    The bill was the product of then-Senator Phil Journey of Haysville. The bill passed unanimously in both the Kansas House and Senate.

    According to the First Amendment Center, some 50 million people live in neighborhoods with homeowners associations. And laws like the 2008 Kansas law are not without controversy, despite the unanimous vote in the Kansas Legislature.

    While the U.S. Supreme Court has ruled that governmental entities like cities can’t stop homeowners from displaying political yard signs, a homeowners association is not a government. Instead, it is a group that people voluntarily enter. Generally, when prospective homeowners purchase a home in a neighborhood with restrictive covenants, they are asked to sign a document pledging to comply with the provisions in the covenants. If those covenants prohibit political yard signs, but a Kansas law says these covenants do not apply, what should a homeowner do? Should state law trump private contracts in cases like this?

    Practically: Should you display signs in your yard?

    While Kansas law makes it legal for those living in communities with covenants that prohibit political yard signs, residents may want to observe these convents. Here’s why: If neighbors are not aware of this new Kansas law and therefore wrongfully believe that the yard signs are not allowed in your neighborhood, they may think residents with signs in their yards are violating the covenants. By extension, this could reflect poorly on the candidates that are being promoted.

    Those who are not aware of the law allowing yard signs are uninformed. Or, they may be aware of the law but disagree with it and wish their neighbors would not display political yard signs. These people, of course, may vote and influence others how to vote. Whether to display yard signs in a covenant neighborhood is a judgment that each person will have to make for themselves.

    The Kansas statute

    K.S.A. 58-3820. Restrictive covenants; political yard signs; limitations. (a) On and after the effective date of this act, any provision of a restrictive covenant which prohibits the display of political yard signs, which are less than six square feet, during a period commencing 45 days before an election and ending two days after the election is hereby declared to be against public policy and such provision shall be void and unenforceable.

    (b) The provisions of this section shall apply to any restrictive covenant in existence on the effective date of this act.

    Or, as described in the 2008 Summary of Legislation: “The bill invalidates any provision of a restrictive covenant prohibiting the display of political yard signs, which are less than six square feet, 45 days before an election or two days after the election.”

  • Wichita: We have incentives. Lots of incentives.

    Wichita: We have incentives. Lots of incentives.

    In this excerpt from WichitaLiberty.TV: Wichita government leaders complain that Wichita can’t compete in economic development with other cities and states because the budget for incentives is too small. But when making this argument, these officials don’t include all incentives that are available. View below, or click here to view on YouTube. More information on this topic is at Contrary to officials, Wichita has many incentive programs.