Tag: Kansas State Department of Education
-
Kansas school standards remain high
Kansas school assessment standards remain at a high level, compared to other states. This is a welcome change from the past.
-

What is the real problem at Wichita Southeast?
There is likely a different explanation for problems at a Wichita high schools from what we’ve been told by the school district and our newspaper.
-
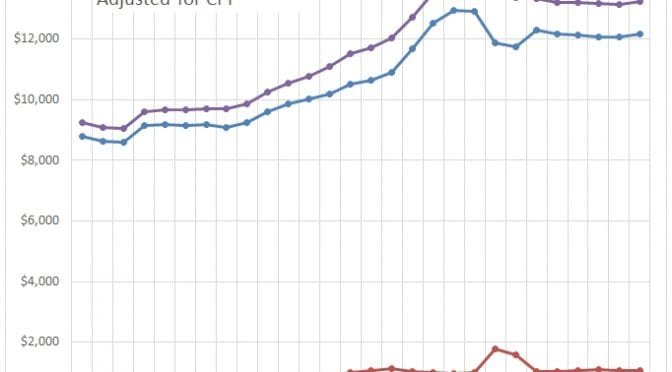
Kansas school spending
New data for spending in Kansas schools is available.
-

Kansas school fund balances
Kansas school fund balances rose this year, in both absolute dollars and dollars per pupil.
-

Deconstructing Don Hineman
Another Kansas legislator explains why raising taxes was necessary. So he says.
-
Shocking News about Kansas Education!
Listening too often to Topeka politicians and administrators can leave a normal person feeling rather jaded, even used. Or maybe it’s the reporting, sometimes I just don’t know, writes Paul Waggoner.
-

Fake government spawns fake news
Discussions of public policy need to start from a common base of facts and information. An episode shows that both our state government and news media are not helping
-

Wrong direction for Wichita public schools
A letter in the Wichita Eagle illustrates harmful attitudes and beliefs of the public school establishment.
-

Kansas state school assessments
An interactive presentation of Kansas state school assessment scores at the state, district, and building levels.
-

Public education factbook for 2017
The fifth edition of data on public schools in Kansas is available.
-

Accountability in Kansas public schools
Critics of school choice say there is no accountability outside the traditional public schools. Here are the standards Kansas used to hold its schools accountable.
-

Kansas school employment
Kansas school employment rose slightly for the current school year, and ratios of employees to pupils fell, also slightly.