Tag: Kansas Department of Transportation

  • Kansas highway pavement conditions

    Kansas highway pavement conditions

    What is the condition of Kansas highways?

    Each year the Kansas Department of Transportation surveys the condition of highway pavement and issues a report called the Network Optimization System (NOS) Survey. 1

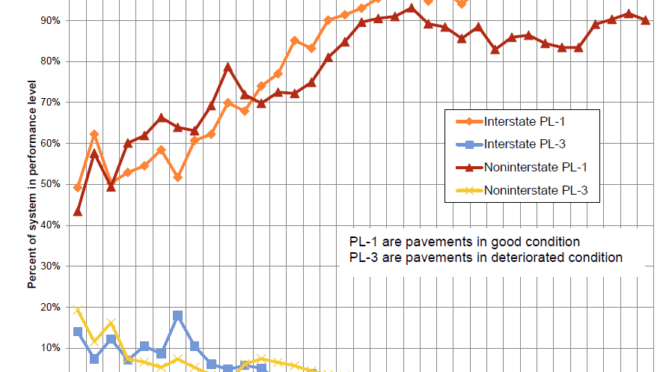
    Of the condition of highways, the report notes: “Since the data was first collected in 1983, the percentage of pavement surface in good condition has appreciably increased while the percentage of poor pavement has significantly decreased.”

    Kansas Highway Conditions, through 2017. Click for larger.
    Here’s a chart of the conditions of Kansas roads and highways. 2 It shows that, for interstate highways, the percent of the system in good condition has been pretty level since 2001, although there is a slight decline recently that is within the range of normal year-to-year variation. For non-interstate highways, the percent in good condition fell starting in 2004, but has rebounded, with a small decline in the most recent year.

    Based on these charts, there’s no factual basis to claim that Kansas roads and highways are deteriorating or crumbling.

    KDOT notes that the condition report “…also shows that while the last few years have been challenging due to very tight budgets, KDOT and its partners continue to find means to maintain the pavement surface condition.” The most recent financial report from KDOT shows that spending on preservation has fallen significantly the past three years, while spending on maintenance has been level. 3


    Notes

    1. Kansas Department of Transportation. Pavement Management Information System (PMIS). Available at https://www.ksdot.org/bureaus/matreslab/pmis/reports.asp.
    2. Kansas Department of Transportation. 2017 Kansas NOS Condition Survey Report. Available at https://www.ksdot.org/Assets/wwwksdotorg/bureaus/matResLab/pmis/2017/CSR2017_SW.pdf.
    3. Weeks, Bob. Kansas highway spending. Available at https://wichitaliberty.org/kansas-government/kansas-highway-spending-2018/.
  • Kansas highway spending

    Kansas highway spending

    A look at actual spending on Kansas highways, apart from transfers.

    KDOT spending, major road programs. Click for larger.
    KDOT spending, total road programs. Click for larger.
    KDOT transfers. Click for larger.
    KDOT funding sources, partial. Click for larger.
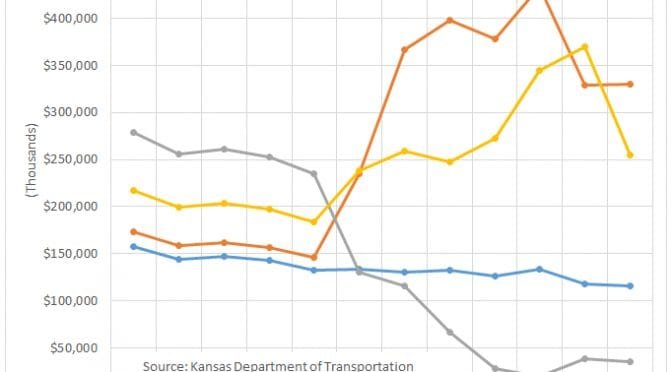
    When we look at actual spending on Kansas roads and highways, we see something different from what is commonly portrayed. Kansas Department of Transportation publishes a Comprehensive Annual Financial Report that details spending in four categories. These figures represent actual spending on roads and highways, independent of transfers to or from the highway fund.

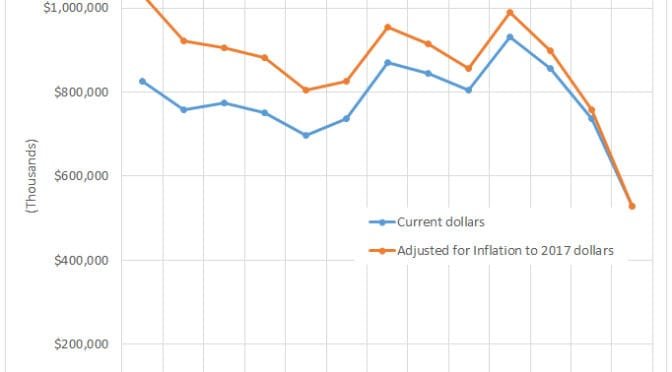
    For fiscal year 2018, which ended June 30, 2018, spending on two categories (Maintenance and Modernization) rose slightly from the year before, while spending on the categories Preservation and Expansion and Enhancement fell.

    For these four categories — which represent the major share of KDOT spending on roads — spending in fiscal 2018 totaled $528.234 million. That’s down 28 percent from $736.781 million the year before, and up from a low of $698.770 million in fiscal 2010.

    Again, these are dollars actually spent on highway programs. A common characterization of the way Kansas government is funded is called “robbing the bank of KDOT.” To the extent that characterization is accurate, there is a separate line item titled “Distributions to other state funds” that holds these values. It appears in the nearby table. A chart shows sales tax distributions from the general fund to KDOT, and transfers from KDOT. The two values tack closely over history, and in 2018 were nearly identical values.

    Many also criticize Kansas government for slashing highway spending, letting our roads crumble. While total spending on these four programs has been falling (after adjusting for inflation), the decline, until recent years, is minor compared to the hysterical claims of those with vested interests in more government, and especially highway, spending.

    Kansas law specifies how much sales tax revenue is transferred to the highway fund. Here are recent rates of transfer and dates they became effective: 1

    July 1, 2010: 11.427%
    July 1, 2011: 11.26%
    July 1, 2012: 11.233%
    July 1, 2013: 17.073%
    July 1, 2015: 16.226%
    July 1, 2016 and thereafter: 16.154%

    A nearby chart shows the dollar amounts transferred to the highway fund from sales tax revenue. In 2006 the transfer was $98.914 million, and by 2018 it had grown to $530.765 million.

    KDOT spending, major road programs. Click for larger.


    Notes

    1. Kansas Statutes Annotated 79-3620.
  • Kansas highways set to crumble, foresees former budget director

    Kansas highways set to crumble, foresees former budget director

    Duane Goossen, former high Kansas government official, says the state’s highways are in trouble. What is his evidence?

    In a recent op-ed, Duane Goossen laments the lack of spending on Kansas roads and highways. 1 His focus is his claimed lack spending on maintenance, which, he says, will lead to much larger repair bills in the future.

    “But now the Kansas road system is truly threatened.” He raises the common “Bank of KDOT” criticism, writing “The highway fund became a convenient source of cash.”

    KDOT transfers from sales tax . Click for larger.
    It’s true, as Goossen writes, that a lot of money has been transferred from the highway fund to the general fund. At the same time, the amount of sales tax dollars transferred from the general fund to the transportation fund has risen, and by a factor of five over one decade.

    But it isn’t true that Kansas highways are crumbling from lack of spending on maintenance.

    Kansas Highway Conditions, through 2017. Click for larger.
    Here’s a chart of the conditions of Kansas roads and highways. 2 It shows that, for interstate highways, the percent of the system in good condition has been pretty level since 2001. For non-interstate highways, the percent in good condition fell starting in 2004, but has rebounded.

    Based on these charts, there’s no factual basis to claim that Kansas roads and highways are deteriorating.

    KDOT spending, major road programs. Click for larger.
    KDOT spending, total road programs. Click for larger.
    KDOT transfers. Click for larger.
    KDOT funding sources, partial. Click for larger.
    But Goossen looks to the future, claiming that a lack of spending now will lead to big bills later. Now, it’s important to know that while money has been transferred from the highway fund, that alone doesn’t tell us about the level of spending on maintenance. Looking at actual spending instead of transfers to and from, we find that for fiscal year 2017, spending on three categories (Maintenance, Preservation, and Modernization) was nearly unchanged from the year before, while spending on the category Expansion and Enhancement fell by 31 percent.

    For these four categories — which represent the major share of KDOT spending on roads — spending in fiscal 2017 totaled $738.798 million. That’s down 14 percent from $857.133 million the year before, and up from a low of $698.770 million in fiscal 2010. 3

    And adjusted for inflation, spending on maintenance programs has declined somewhat, including in the years when Goossen held high office. These declines, however, are far short of setting up Goossen’s prediction of calamity.

    Then, there’s this, which is really incredible. Goossen criticizes some of the bonds issued by KDOT in recent years, and he is on the mark: “And a portion of that debt has ‘interest only’ payments in the first years, with the principal payments still to come.”

    However: The state also issued “interest only” bonds in 2004 and 2010. 4 Who was budget director during these years, as well as Secretary of the Kansas Department of Administration? Duane Goossen. 5 But now Goossen criticizes as irresponsible the same action the state took when he was in high office.

    Given the insufficient factual basis for Goossen’s claims — not to mention the blatant hypocrisy — we have to wonder if this article is politically motivated. Perhaps it is, as we see Goossen making the maximum allowed contribution to Kansas Democratic gubernatorial candidate Laura Kelly.

    Either that, or Goossen is auditioning for another government job.


    Notes

    1. Goossen, Duane. Trouble coming for Kansas highways. Garden City Telegram, March 30, 2018. Available at http://www.gctelegram.com/opinion/20180330/trouble-coming-for-kansas-highways.
    2. Kansas Department of Transportation. 2017 Kansas NOS Condition Survey Report. Available at https://www.ksdot.org/Assets/wwwksdotorg/bureaus/matResLab/pmis/2017/CSR2017_SW.pdf.
    3. Weeks, Bob. Kansas highway spending. Available at https://wichitaliberty.org/kansas-government/kansas-highway-spending-2017/.
    4. Weeks, Bob. Kansas transportation bonds economics worse than told. Available at https://wichitaliberty.org/kansas-government/kansas-transportation-bonds-economics-worse-than-told/.
    5. Goossen, Duane. Kansas Budget blog. Available at http://www.kansasbudget.com/.
  • Kansas highway spending

    Kansas highway spending

    A look at actual spending on Kansas highways, apart from transfers.

    KDOT spending, major road programs. Click for larger.
    KDOT spending, total road programs. Click for larger.
    KDOT transfers. Click for larger.
    KDOT funding sources, partial. Click for larger.
    When we look at actual spending on Kansas roads and highways, we see something different from what is commonly portrayed. Kansas Department of Transportation publishes a Comprehensive Annual Financial Report that details spending in four categories. These figures represent actual spending on roads and highways, independent of transfers to or from the highway fund.

    For fiscal year 2017, which ended June 30, 2017, spending on three categories (Maintenance, Preservation, and Modernization) was nearly unchanged from the year before, while spending on the category Expansion and Enhancement fell by 31 percent.

    For these four categories — which represent the major share of KDOT spending on roads — spending in fiscal 2017 totaled $738.798 million. That’s down 14 percent from $857.133 million the year before, and up from a low of $698.770 million in fiscal 2010.

    Again, these are dollars actually spent on highway programs. A common characterization of the way Kansas government is funded is called “robbing the bank of KDOT.” To the extent that characterization is accurate, there is a separate line item titled “Distributions to other state funds” that holds these values. It appears in the nearby table. A chart shows sales tax distributions from the general fund to KDOT, and transfers from KDOT.

    Many also criticize Kansas government for slashing highway spending, letting our roads crumble. While total spending on these four programs has been falling (after adjusting for inflation), the decline is minor compared to the hysterical claims of those with vested interests in more government, and especially highway, spending.

    Kansas law specifies how much sales tax revenue is transferred to the highway fund. Here are recent rates of transfer and dates they became effective: 1

    July 1, 2010: 11.427%
    July 1, 2011: 11.26%
    July 1, 2012: 11.233%
    July 1, 2013: 17.073%
    July 1, 2015: 16.226%
    July 1, 2016 and thereafter: 16.154%

    A nearby chart shows the dollar amounts transferred to the highway fund from sales tax revenue. In 2006 the transfer was $98.914 million, and by 2016 it had grown to $514.519 million.

    KDOT spending, major road programs. Click for larger.


    Notes

    1. Kansas Statutes Annotated 79-3620.
  • In Kansas, sweeps to continue

    In Kansas, sweeps to continue

    Even though the Kansas Legislature raised taxes, sweeps from the highway fund will continue.

    Spending on major road programs in Kansas. Click for larger.
    Why did the legislature and governor raise taxes in Kansas? One reason cited by many is the need to stop “robbing the highway fund.” This refers to transferring (“sweeping”) money from a fund in the Kansas Department of Transportation to the state’s general fund, where the money is then spent on things besides highways. There was bipartisan agreement that this practice should stop. Highways were falling apart, it was said, even though spending on major road maintenance programs continued at about the same level. 1

    The real danger in transferring money from the highway fund is that KDOT borrows money — a lot of money. And instead of that money being spent on long-lived assets like roads and bridges, that borrowed money is spent on current consumption.

    But: Guess what? Transfers from the highway fund to the general fund are scheduled to continue for another two years, based on the budget passed by wide margins in both chambers of the legislature. 2

    Language in the budget calls for quarterly sweeps totaling $288,297,663 in fiscal year 2018, with the first sweep on July 1, 2017. 3

    For fiscal year 2018, the total of the quarterly sweeps is $293,126,335. 4

    Transfers from sales tax to Kansas highway fund. Click for larger.
    There are several ways to look at these transfers. We might look at it as reclaiming from the highway fund some of the sales tax the state collects. That amount has grown. In 2006 the transfer of sales tax revenue to the highway fund was $98,914 million. In 2016 it was $517,698 million, an increase of $418,784 million or 423 percent. 5

    But if the legislature wanted to alter the transfer of sales tax, it could have done so by altering the law that specifies the rate of transfer. That promotes transparency.

    The budget authorizes the transportation department to borrow up to $400 million in each of the next two fiscal years. There will be pressure to issue those bonds.


    Notes

    1. Weeks, Bob. Highway budget cuts and sweeps in Kansas. Available at https://wichitaliberty.org/kansas-government/highway-budget-cuts-sweeps-kansas/.
    2. Conference Committee Report for HB 2002. Available at http://www.kslegislature.org/li/b2017_18/measures/hb2002/.
    3. Sec. 163 (i). On July 1, 2017, October 1, 2017, January 1, 2018, and April 1, 2018, or as soon thereafter each such date as moneys are available, the director of accounts and reports shall transfer $72,074,415.75 from the state highway fund (276-00-4100-4100) of the department of transportation to the state general fund: Provided, That the transfer of each such amount shall be in addition to any other transfer from the state highway fund of the department of transportation to the state general fund as prescribed by law: Provided further, That, in addition to other purposes for which transfers and expenditures may be made from the state highway fund during fiscal year 2018 and notwithstanding the provisions of K.S.A. 68-416, and amendments thereto, or any other statute, transfers may be made from the state highway fund to the state general fund under this subsection during fiscal year 2018.
    4. Sec. 164 (i). On July 1, 2018, October 1, 2018, January 1, 2019, and April 1, 2019, or as soon thereafter each such date as moneys are available, the director of accounts and reports shall transfer $73,281,583.75 from the state highway fund (276-00-4100-4100) of the department of transportation to the state general fund: Provided, That the transfer of each such amount shall be in addition to any other transfer from the state highway fund of the department of transportation to the state general fund as prescribed by law: Provided further, That, in addition to other purposes for which transfers and expenditures may be made from the state highway fund during fiscal year 2019 and notwithstanding the provisions of K.S.A. 68-416, and amendments thereto, or any other statute, transfers may be made from the state highway fund to the state general fund under this subsection during fiscal year 2019.
    5. Weeks, Bob. Highway budget cuts and sweeps in Kansas. Available at https://wichitaliberty.org/kansas-government/highway-budget-cuts-sweeps-kansas/.
  • Explaining the Kansas budget, in a way

    Explaining the Kansas budget, in a way

    A video explaining the Kansas budget is accurate in many aspects, but portrays a false and harmful myth regarding school spending.

    A popular video explaining the Kansas budget deserves scrutiny for some of the data presented. The video is available at the Facebook page of Loud Light.

    The presentation makes a few good points. For example, the video is correct in that the sales tax is a regressive tax, affecting low-income households in greater proportion. During the capaign for a Wichita city sales tax in 2014 I analyzed Census Bureau data and found that the lowest income class of families experience an increase nearly four times the magnitude as do the highest income families, as a percentage of after-tax income.1 2

    The video also rightly notes that Kansas is now, and it has in the past under other legislatures and governors, inadequately funding KPERS, the state employee pension plan.

    Interestingly, the video praises Kansas for its early adoption of “progressive economics.” I think the narrator meant “progressive taxation,” as the video shows Kansas adopting an income tax in 1933. How has that worked for Kansas? There are a variety of ways to look at the progress of Kansas compared to the nation, but here’s a startling fact: For the 73rd Congress (1933 to 1935) Kansas had seven members in the U.S. House of Representatives. (It had eight in the previous session.) Today Kansas has four members, and may be on the verge of losing one after the next census. This is an indication of the growth of Kansas in comparison to the nation.

    Kansas Department of Transportation Funding, partial. Click for larger.
    The narrator states, “Kansas Department of Transportation is mostly funded by restricted revenue like fuel tax.” This was true at one time. But starting in 2011 KDOT has received more funding from sales tax than motor fuel tax.3 The gap is getting wider, as can be seen in the nearby chart. (By the way, there are proposals to increase the motor fuel tax. This tax is just like the sales tax, affecting low-income households greatest.)

    School spending

    The greatest problem in this video is its explanation of state spending on K through 12 schools. This is important, as the video correctly notes that this spending is half of the general fund budget. In introducing this section, the narrator notes “budget report gamesmanship that’s created a rhetorical paradox,” conceding it is “technically” true that education spending is at record levels.

    The video then shows a chart titled “State Aid Per Pupil.” The chart starts with a value a little over $6,000 in 1993, declining to about $4,000 in 2013, then staying at that level. The citation is “Governor’s Budget Report” from the Kansas Division of Budget, and at the end of the video there is the explanation, “All financial data in this video is inflation adjusted to January 2017.”

    A more accurate title for the chart is “Base State Aid Per Pupil.” That’s the actual name for the component of school spending that the video displays. This is important because base state aid is only the starting point for determining spending. Actual state aid to schools is much higher.

    Kansas school spending, showing base state aid and total state aid. See article for notes about 2015. Click for larger.
    Base state aid per pupil — the statistic the video presents — is an important number.4 It’s the starting point for the Kansas school finance formula used before the 2015-2016 (fiscal 2016) school year, and something like it may be used in a new formula. 5

    Base state aid, however, is not the only important number. To calculate the funding a school district receives, weightings are added. If students fall into certain categories, weightings for that category are added to determine a weighted enrollment. That is multiplied by base state aid to determine total state aid to the district. 6

    While this may seem like a technical discussion that doesn’t make a difference, it’s very important. Some of the weightings are large and have increased by large amounts. The at-risk weighting, intended to cover the additional costs of teaching students from low-income families, started at five percent in 1993. In other words, for every student in this category, a school district received an extra five percent of base state aid. The value of this weighting has risen by a factor of nine, reaching 45.6 percent starting with the 2008-2009 school year.7

    So in the nearby chart that I prepared using data adjusted for inflation in 2016, we see base state aid per pupil on a downward trend, just as the video shows. But I also plotted total state aid per pupil, which includes weightings. This number is on a mostly upward trend.

    Kansas school spending, showing ratio of total state aid to base state aid. See article for notes about 2015. Click for larger.
    Kansas school spending. See article for notes about 2015. Click for larger.
    The weightings have a large effect on school funding. For example: During the 2004-2005 school year, base state aid was $3,863 and the at-risk weighting was ten percent. An at-risk student, therefore, generated $4,249 in state funding. (Other weightings might also apply.)

    Ten years later base state aid was $3,852 — almost exactly the same — and the at-risk weighting was up to 45.6 percent. This generates funding of $5,609. For a district that qualified for the maximum high-density at-risk weighting, an additional $404 in funding was generated. (These numbers are not adjusted for inflation.)

    So even though base state aid remained (almost) unchanged, funding targeted at certain students rose, and by a large amount.

    Over time, values for the various weightings grew until by 2014 they added 85 percent to base state aid. A nearby chart shows the growth of total state aid as compared to base state aid. (Starting in fiscal 2015 the state changed the way local tax dollars are counted. That accounts for the large rise for the last year of data in the chart. For school years 2016 and 2017, block grants have replaced the funding formula, so base aid and weightings do not apply in the same way.)

    All this determines state aid to schools only. There is also local aid and federal aid.

    The questions Kansans should ask are these: Why doesn’t this video explain that “base state aid per pupil” is not the same as “state aid per pupil?” And why not explain that total state aid per pupil is much higher than base state aid, and has been rising over the long term?


    Notes

    1. Weeks, Bob. Wichita sales tax hike would hit low income families hardest. Analysis of household expenditure data shows that a proposed sales tax in Wichita affects low income families in greatest proportion, confirming the regressive nature of sales taxes. Available at https://wichitaliberty.org/wichita-government/wichita-sales-tax-hike-hit-low-income-families-hardest/.
    2. Weeks, Bob. Kansas sales tax has disproportionate harmful effects. Kansas legislative and executive leaders must realize that a shift to consumption taxes must be accompanied by relief from its disproportionate harm to low-income households. https://wichitaliberty.org/taxation/kansas-sales-tax-has-disproportionate-harmful-effects/.
    3. Kansas Department of Transportation. Comprehensive Annual Financial Report for 2016.
    4. Weeks, Bob. Kansas school weightings and effects on state aid. In making the case for more Kansas school spending, the focus on base state aid per pupil leaves out important considerations. https://wichitaliberty.org/wichita-kansas-schools/kansas-school-weightings-and-effects-on-state-aid/.
    5. For the fiscal 2016 and 2017 school years, the formula was replaced by block grants.
    6. Amendments to the 1992 School District Finance And Quality Performance Act and the 1992 School District Capital Improvements State Aid Program (Finance Formula Components), Kansas Legislative Research Department, May 20, 2014
      http://ksde.org/Portals/0/School%20Finance/amends_to_sdfandqpa_2015.pdf
    7. There’s also the high-density at-risk weighting. Starting with the 2006-2007 school year districts with a high concentration of at-risk students could receive an extra weighting of four percent or eight percent. Two years later the weightings were raised to six percent and ten percent. (This formula was revised again in 2012 in a way that may have slightly increased the weightings.)
  • Highway budget cuts and sweeps in Kansas

    Highway budget cuts and sweeps in Kansas

    A public interest group makes claims about Kansas roads and highways that are not supported by data. It’s not even close.

    Excerpt from fundraising email. Click for larger.
    A fundraising email sent by Save Kansas Coalition makes claims about Kansas roads and highways that readers will recognize as a few of the standard complaints common among Kansas spending and taxation advocates. It’s charitable, though, to call them complaints, because they are actually outright lies.

    “Budget cuts and sweeps from the Bank of KDOT have decimated our state’s transportation infrastructure investments.” Decimate means “to reduce drastically” or “to cause great destruction or harm to.”1

    Total spending on major road programs in Kansas. Click for larger.
    Spending on major road programs in Kansas. Click for larger.
    Reading that, you might think that spending has been cut by — how much? 10 percent? That doesn’t sound like decimating. 50 percent? 75 percent? That’s more like what decimating means.

    So what is the story on Kansas Department of Transportation spending? Nearby is a chart. It shows amounts of money actually spent on road and highway programs, according to KDOT’s annual financial reports. SKC is correct, partially. There have been sweeps from KDOT to the general fund. Those are not a good idea, even though they’ve been practiced for many years. But as shown nearby and in more detail at Spending on roads in Kansas spending has not declined. It been up and down a little, but is higher than it was in 2007 and 2008, before the recession.

    In particular, spending on maintenance has been fairly level until dipping a bit in 2016. Spending on preservation rose rapidly until dipping, also in 2016. It’s still twice as high as in the pre-recession years of 2007 and 2008.

    Does this sound like spending has been decimated?

    Transfers from sales tax to Kansas highway fund. Click for larger.
    By the way, there are sweeps from sales tax to the highway fund. Nearby is another chart showing how much sales tax was transferred to the highway fund. In 2006 the transfer was $98,914 million. In 2016 it was $517,698 million, an increase of $418,784 million or 423 percent.

    SKC also writes: “Whereas we formerly maintained 1200 miles of roadway each year, the state now can only afford 200 miles of upkeep. That means road repair once every 50 years!”

    Each year KDOT publishes a list of the road projects underway. I’ve obtained this data in machine-readable form for five years, and I present the relevant data in a nearby table.

    (A few definitions: According to KDOT, “The Preservation program protects the public’s investment in its highway system by maintaining the ‘as built’ condition of roads and bridges. Projects in this group range from roadway surfacing rehabilitation and bridge repairs to pavement and bridge replacement.”2 For Modernization, KDOT says “Projects under this program are designed to enhance safety and/or improve roadways by adding shoulders, flattening hills, straightening curves and upgrading intersections on already existing roadways.”3)

    While SKC isn’t specific in what it means by “maintained” or “upkeep,” it’s possible it is referring to the category “Non-Interstate Resurfacing (PMS 1R).” As you can see in the table, the number of miles in the program has risen for the past three years, and is far above the 200 miles SKC claims we can afford.

    The claims made by Save Kansas Coalition don’t add up. Ironically, SKC’s website promises “A willingness to engage in meaningful discussion, in-depth research and critical analysis is vital to the health of the Kansas economy.” But nothing in the record of relevant data supports these claims — unless SKC has secret data it isn’t willing to share.

    Sum of KDOT projects, selected categories, measured in miles. Click for larger.


    Notes

    1. Merriam-Webster. https://www.merriam-webster.com/dictionary/decimate.
    2. Appendix to the Kansas Department of Transportation’s 2016 Annual Report.
    3. ibid
  • Spending on roads in Kansas

    Spending on roads in Kansas

    A look at actual spending on Kansas highways, apart from transfers.

    Spending on major road programs in Kansas. Click for larger.
    When we look at actual spending on Kansas roads and highways, we see something different from what is commonly portrayed. Kansas Department of Transportation publishes a Comprehensive Annual Financial Report that details spending in four categories. These figures represent actual spending on roads and highways, independent of transfers to or from the highway fund.

    • Spending on “Preservation” has been rising, but fell last year.
    • Spending on “Expansion and Enhancement” has been rising.
    • Spending on “Maintenance” has been level, with a small decline.
    • Spending on “Modernization” has declined, then rose.

    Total spending on major road programs in Kansas. Click for larger.
    For these four categories — which represent the major share of KDOT spending on roads — spending in fiscal 2016 totaled $857.133 million. That’s down from $932.666 million the year before, and up from a low of $698.770 million in fiscal 2010.

    Again, these are dollars actually spent on highway programs. A common characterization of the way Kansas government is funded is called “robbing the bank of KDOT.” To the extent that characterization is accurate, there is a separate line item titled “Distributions to other state funds” that holds these values. It appears in the nearby table.

    Sales tax revenue to the highway fund

    Transfers from sales tax to Kansas highway fund. Click for larger.
    Kansas law specifies how much sales tax revenue is transferred to the highway fund. Here are recent rates of transfer and dates they became effective:1

    July 1, 2010: 11.427%
    July 1, 2011: 11.26%
    July 1, 2012: 11.233%
    July 1, 2013: 17.073%
    July 1, 2015: 16.226%
    July 1, 2016 and thereafter: 16.154%

    A nearby chart shows the dollar amounts transferred to the highway fund from sales tax revenue. In 2006 the transfer was $98.914 million, and by 2016 it had grown to $517.698 million.

    Kansas Department of Transportation Spending. Click for larger.


    Notes

    1. Kansas Statutes Annotated 79-3620.