Tag: James Chung

  • Wichita and Midwest income

    Wichita and Midwest income

    A look at income in Wichita compared to other Midwest cities.

    How much do Wichitans earn at their jobs, compared to other cities?

    Click for larger.
    This data is of interest as recently James Chung told an audience that “average income” is $10,000 higher in Midwest comparable cities than in Wichita. He didn’t define the term “income,” he didn’t define the comparable cities, and he didn’t provide any sources of data. But mention of this is a good time to look at income in Wichita and other cities.

    Occupational salaries

    The Bureau of Labor Statistics, part of the United States Department of Labor, collects data regarding salaries of occupations in different cities in a program called Occupational Employment Statistics. More information about this program may be found here.

    One way to examine income in different cities is to compare the salaries for different jobs using the OES data collected by BLS. I selected some cities to compare with Wichita: Cedar Rapids, IA; Colorado Springs, CO; Des Moines-West Des Moines, IA; Fayetteville-Springdale-Rogers, AR-MO; Kansas City, MO-KS; Oklahoma City, OK; Omaha-Council Bluffs, NE-IA; and Tulsa, OK. (The data is collected for Metropolitan Statistical Areas (MSAs), not cities. But it seems more natural to use the term city.)

    The OES dataset is large, holding data on over 800 occupations, and it’s unwieldy to make apt comparisons. Besides what I report below, I’ve also created an interactive visualization of the OES data. In the interactive visualization, you may select any cities and occupations for comparison. Click here to learn more and use it.

    Occupational salary example. Click for larger.
    Considering all occupations for this sampling of cities, the annual salary in Wichita is $43,880, while it is $50,600 in Des Moines. That’s $6,720 lower in Wichita, or 13 percent.

    Considering a few semi-random occupations: For buyers and purchasing agents, the highest salary is in Cedar Rapids at $75,830. The Wichita salary is $9,640 less, while the Des Moines salary is $15,070 less.

    For food service managers, the highest salary is in Colorado Springs at $66,300. The Wichita salary is $1,520 less, while the Des Moines salary is $21,270 less.

    For police officers, the highest salary is in Colorado Springs at $68,980. The Wichita salary is $21,670 less, while the Des Moines salary is $4,310 less.

    For telemarketers, the highest salary is in Fayetteville at $27,760. The Wichita salary is $1,860 less, while the Des Moines salary is $2,100 less.

    For the broad category of architecture and engineering occupations, Wichita is the leader in the sample at $82,710. Des Moines is at $71.930, which is $10,780 lower.

    For the broad category of production workers, Wichita again leads the sample at $44,950, while Des Moines is at $35,190, which is $9,760 lower.

    Personal income

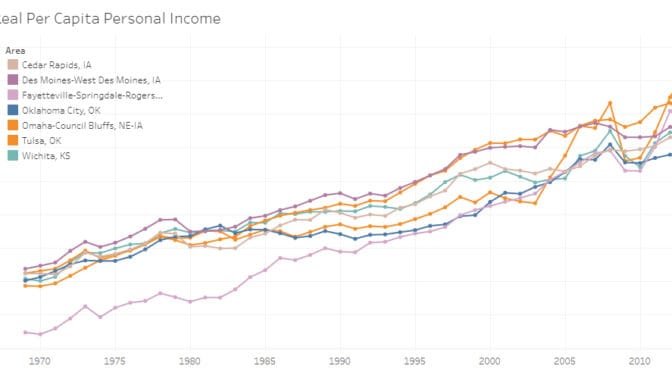
    Another set of data that can help is personal income. For Des Moines, personal income per person is $50,677 (complete year 2016). For Wichita, the value is $47,395, which is $3,282 less. (For an interactive visualization of personal income, see Visualization: Personal income by metropolitan area.)

    Click for larger.

    Difficulties

    Comparing average salaries for groups of occupations in different cities has problems. One is the number of workers in occupations. Considering management occupations, there are few chief executive officers but many other managers. The weight of the number of workers needs to be considered.

    Also, the magnitude of salaries is an issue. Chief executive officer salaries vary widely, by tens of thousands of dollars. The data tells us that a CEO in Wichita earns $65,400 less than in Des Moines. That variation is greater than the average salary across all occupations, and provides little insight into the salaries of the majority of workers.

    The per capita personal income figures overcome these obstacles.

    $10,000

    Do Wichitans earn $10,000 less than in comparable Midwest cities, as James Chung recently presented? Based on per capita personal income, the answer is no. Not even close to that, although Wichita’s per capita income is not encouraging.

    Based on occupational salaries, Wichitans earn less than many comparable Midwest cities, but nothing near $10,000 less when all occupations are considered. In specific occupations, Wichita salaries are much less, but in some cases Wichita salaries are highest.

  • Greater Wichita Partnership

    Greater Wichita Partnership

    Greater Wichita Partnership features untruthful information on its website, which casts doubt on the reliability of the organization and the City of Wichita.

    Greater Wichita Partnership uses the url of its predecessor, the Greater Wichita Economic Development Coalition, or GWEDC. GWP is in charge of efforts to develop the economy in the greater Wichita area. It describes itself as “a driving force in building a remarkable city and region.”1

    Greater Wichita Partnership website, featuring unreliable information. Click for larger.
    But there is a problem. Based on the information GWP makes available on the front page of its website, I don’t have much confidence in the organization’s efforts. And that’s too bad.

    In the past I’ve observed how GWEDC — that’s the predecessor to GWP — was derelict in keeping its information current. In 2014, I noticed that GWEDC credited itself with recruiting a company named InfoNXX to Wichita.2 But GWEDC did not update its website to reflect current conditions. When I looked at GWEDC’s website in October 2013, I found this on a page titled Office Operations:

    Wichita hosts over a dozen customer service and processing centers — including a USPS Remote Encoding Center (985 employees), InfoNXX (950), T-Mobile (900), Royal Caribbean (700), Convergys (600), Protection One (540), Bank of America (315) and Cox Communications (230.)

    The problem was this: At the time I looked at the GWEDC website in October 2013, InfoNXX had closed its Wichita operations in 2012.3 Still, the official Wichita-area economic development agency touted the existence of a company that no longer existed in Wichita, and claimed a job count that the company never achieved. (Also, at that time the USPS facility was in the process of closing and eliminating all Wichita jobs.)

    Now, the Greater Wichita Partnership website trumpets — on its front page — the expansion of a company that has actually contracted its operations in Wichita.

    The company is NetApp, a maker of computer server storage systems. It’s the type of high tech company all cities are recruiting, and for which cities and states will open the economic development incentives pocketbook. Locally, Wichita and the State of Kansas announced expansion plans for NetApp operations in Wichita in 2012. But by the end of 2015, NetApp was not meeting its job goals in Wichita, according to information from Sedgwick County. Since then, NetApp announced two rounds of job cuts, with the cuts in Wichita unspecified.4 5

    NetApp has not met the lofty expectations Wichita and Kansas officials promoted. That’s unfortunate, and perhaps the situation will improve and NetApp will grow.

    Relevant to public policy is that NetApp was slated to receive a lot of incentives from many levels of government, up to $35 million.6 It is likely impossible to determine how much of these incentives were actually paid to NetApp. We do know that both the City of Wichita and Sedgwick County stopped paying incentives to NetApp, as these incentives were predicated on achieving certain levels of job counts, and NetApp has not met them.

    But the lesson to learn today is that the Greater Wichita Partnership, the agency in charge of economic development in the area, still advertises NetApp as a success.

    The problem is not only the blatant lie that GWP promotes prominently: “NetApp doubles its Wichita footprint.” It’s a serious problem that GWP has not updated its website to reflect reality. What if a company considering Wichita for expansion or location checks the NetApp story? How would such a company reconcile reality with what GWP promotes? What does this say about the reputation and reliability of GWP?

    I don’t expect GWP to highlight its failures. But we ought to expect GWP to care enough about the truth to remove false information from such a prominent presentation.

    Wichita’s history

    Presentation by James Chung. Click for larger.
    Presentation by James Chung. Click for larger.
    Presentation by James Chung. Click for larger. See text for problems with this presentation.
    In September 2015 James Chung delivered several lectures on the Wichita-area economy and its outlook.7 In the event I attended, Chung showed examples of web pages from the Des Moines and Omaha chambers, and contrasted them to a similar page from the Wichita chamber. Chung got it wrong, as the page he showed to illustrate the Wichita chamber was a print version of the page, which — intentionally — is a simplified version of the page designed for viewing in a web browser.8 The print version of the page, however, is what appears in Google, and most people will not investigate beyond that.

    Still, the Wichita chamber page was stale compared to the others. And Chung’s point was, and is, relevant: First impressions matter.

    The Wichita chamber’s site is better now. But someone at the Greater Wichita Partnership didn’t get the message. Content — reliable content — counts.

    __
    Notes

    1. Greater Wichita Partnership. About us. http://www.gwedc.org/about_us/about_us.
    2. Weeks, Bob. Wichita economic development not being managed. https://wichitaliberty.org/wichita-government/wichita-economic-development-managed/.
    3. Siebenmark, Jerry. KGB to close Wichita call center by end of January. Wichita Eagle. Decenber 7, 2011. http://www.kansas.com/news/business/article1081923.html.
    4. Horwath, Bryan. NetApp cuts employees in Wichita. Wichita Eagle. March 2, 2016. http://www.kansas.com/news/business/article63559417.html.
    5. Rengers, Carrie. NetApp restructures, announces layoffs. Wichita Eagle. November 3, 2016. http://www.kansas.com/news/business/biz-columns-blogs/carrie-rengers/article112339362.html.
    6. Weeks, Bob. NetApp economic development incentives: all of them. https://wichitaliberty.org/wichita-government/netapp-economic-development-incentives-all-of-them/.
    7. Wenzl, Roy. Analyst presents sobering view of Wichita economy, community. Wichita Eagle, September 22, 2015. http://www.kansas.com/news/business/article36236142.html.
    8. For a view of the page as it looked on April 5, 2015, see http://web.archive.org/web/20150405131957/http://wichitachamber.org/news_room-wichita_accolades.php.
  • Wichita’s growth in gross domestic product

    Wichita’s growth in gross domestic product

    An interactive visualization of gross domestic product for metropolitan areas.

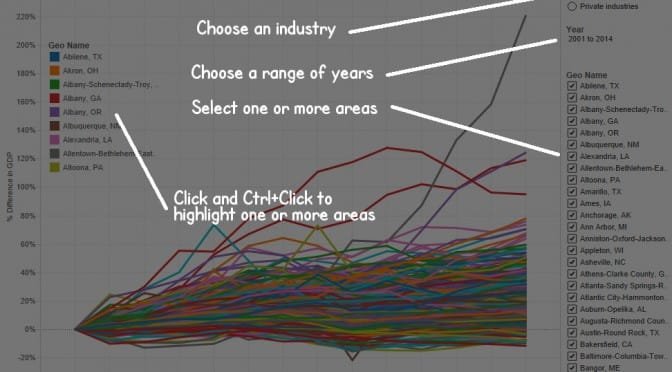
    Gross domestic product is the sum of the value of all goods and services produced for a period of time. The Bureau of Economic Analysis makes this statistic available for metropolitan areas. GDP is not the only way to measure the economic health of a region, but it is one way. I’ve gathered the data and made it available in an interactive visualization.

    Growth of GDP for Wichita and selected cities. Click for larger version.
    Growth of GDP for Wichita and selected cities. Click for larger version.
    When using the visualization you may select total GDP, or GDP for private industry or government alone. You may select any number of metropolitan areas to appear on the chart. By clicking metro names in the legend, you can highlight or emphasize the series for one metro area. Use Ctrl+click to select more than one at a time.

    Of note, recently James Chung delivered a lecture in Wichita. As part of the presentation, he mentioned three areas that he thought were doing things well: Cedar Rapids, Des Moines, and Omaha. A nearby illustration shows the visualization of the growth of GDP for these metro areas and Wichita. You can see that GDP for these areas have grown faster than has GDP for Wichita. (This visualization shows GDP change since the start of the chart, so that the growth of metro areas of different sizes can be compared.)

    Growth of GDP for Wichita and selected cities. Click for larger version.
    Growth of GDP for Wichita and selected cities. Click for larger version.
    Another illustration compares Wichita to several cities that were part of the Wichita Metro Chamber of Commerce’s city-to-city visits. While in some years the visit has been to cities like Austin that have grown rapidly, that is not always the case.

    Click here to open the visualization in a new window.

    Data is from Bureau of Economic Analysis, an agency of the United States Department of Commerce. Visualization created using Tableau.

    Using the visualization.
    Using the visualization.