As we approach another birthday of Milton Friedman, here’s his column from Newsweek in 1982 that explains that despite good intentions, the result of government intervention often harms those it is intended to help.
There is a sure-fire way to predict the consequences of a government social program adopted to achieve worthy ends. Find out what the well-meaning, public-interested persons who advocated its adoption expected it to accomplish. Then reverse those expectations. You will have an accurate prediction of actual results.
To illustrate on the broadest level, idealists from Marx to Lenin and the subsequent fellow travelers claimed that communism would enhance both freedom and prosperity and lead to the “withering away of the state.” We all know the results in the Soviet Union and the People’s Republic of China: misery, slavery and a more powerful and all-encompassing government than the world had ever seen.
As we approach another birthday of Milton Friedman, here’s an insightful passage from the book he wrote with his wife Rose: Free to Choose: A Personal Statement. It explains why government spending is wasteful, how it leads to corruption, how it often does not benefit the people it was intended, and how the pressure for more spending is always present.
A simple classification of spending shows why that process leads to undesirable results. When you spend, you may spend your own money or someone else’s; and you may spend for the benefit of yourself or someone else. Combining these two pairs of alternatives gives four possibilities summarized in the following simple table:
Category I in the table refers to your spending your own money on yourself. You shop in a supermarket, for example. You clearly have a strong incentive both to economize and to get as much value as you can for each dollar you do spend.
Category II refers to your spending your own money on someone else. You shop for Christmas or birthday presents. You have the same incentive to economize as in Category I but not the same incentive to get full value for your money, at least as judged by the tastes of the recipient. You will, of course, want to get something the recipient will like — provided that it also makes the right impression and does not take too much time and effort. (If, indeed, your main objective were to enable the recipient to get as much value as possible per dollar, you would give him cash, converting your Category II spending to Category I spending by him.)
Category III refers to your spending someone else’s money on yourself — lunching on an expense account, for instance. You have no strong incentive to keep down the cost of the lunch, but you do have a strong incentive to get your money’s worth.
Category IV refers to your spending someone else’s money on still another person. You are paying for someone else’s lunch out of an expense account. You have little incentive either to economize or to try to get your guest the lunch that he will value most highly. However, if you are having lunch with him, so that the lunch is a mixture of Category III and Category IV, you do have a strong incentive to satisfy your own tastes at the sacrifice of his, if necessary.
All welfare programs fall into either Category III — for example, Social Security which involves cash payments that the recipient is free to spend as he may wish; or Category IV — for example, public housing; except that even Category IV programs share one feature of Category III, namely, that the bureaucrats administering the program partake of the lunch; and all Category III programs have bureaucrats among their recipients.
In our opinion these characteristics of welfare spending are the main source of their defects.
A series of short videos from the Independent Institute entertains and teaches lessons at the same time.
The Independent Institute has produced a series of humorous and satirical videos to present lessons about the nature of government. The Institute describes the series here:
Love Gov depicts an overbearing boyfriend — Scott “Gov” Govinsky — who foists his good intentions on a hapless, idealistic college student, Alexis. Each episode follows Alexis’s relationship with Gov as his intrusions wreak (comic) havoc on her life, professionally, financially, and socially. Alexis’s loyal friend Libby tries to help her see Gov for what he really is — a menace. But will Alexis come to her senses in time?
There are five episode (plus a trailer). Each episode is around five minutes long and presents a lesson on a topic like jobs, healthcare, and privacy. The episodes are satirical and funny. They’d be really funny if the topic wasn’t so serious. I recommend you spend a half-hour or so to view the series.
The arguments presented in the following essay by Frederic Bastiat, written in 1845, are still in use in city halls, county courthouses, school district boardrooms, state capitals, and probably most prominently and with the greatest harm, Washington.
A PETITION
From the Manufacturers of Candles, Tapers, Lanterns, Sticks, Street Lamps, Snuffers, and Extinguishers, and from Producers of Tallow, Oil, Resin, Alcohol, and Generally of Everything Connected with Lighting.
To the Honourable Members of the Chamber of Deputies.
Open letter to the French Parliament, originally published in 1845
Gentlemen:
You are on the right track. You reject abstract theories and have little regard for abundance and low prices. You concern yourselves mainly with the fate of the producer. You wish to free him from foreign competition, that is to reserve the domestic market for domestic industry.
We come to offer you a wonderful opportunity for your — what shall we call it? Your theory? No, nothing is more deceptive than theory. Your doctrine? Your system? Your principle? But you dislike doctrines, you have a horror of systems, as for principles, you deny that there are any in political economy; therefore we shall call it your practice — your practice without theory and without principle.
We are suffering from the ruinous competition of a rival who apparently works under conditions so far superior to our own for the production of light that he is flooding the domestic market with it at an incredibly low price; for the moment he appears, our sales cease, all the consumers turn to him, and a branch of French industry whose ramifications are innumerable is all at once reduced to complete stagnation.
This rival, which is none other than the sun, is waging war on us so mercilessly we suspect he is being stirred up against us by perfidious Albion (excellent diplomacy nowadays!), particularly because he has for that haughty island a respect that he does not show for us
We ask you to be so good as to pass a law requiring the closing of all windows, dormers, skylights, inside and outside shutters, curtains, casements, bull’s-eyes, deadlights, and blinds — in short, all openings, holes, chinks, and fissures through which the light of the sun is wont to enter houses, to the detriment of the fair industries with which, we are proud to say, we have endowed the country, a country that cannot, without betraying ingratitude, abandon us today to so unequal a combat.
Be good enough, honourable deputies, to take our request seriously, and do not reject it without at least hearing the reasons that we have to advance in its support.
First, if you shut off as much as possible all access to natural light, and thereby create a need for artificial light, what industry in France will not ultimately be encouraged?
If France consumes more tallow, there will have to be more cattle and sheep, and, consequently, we shall see an increase in cleared fields, meat, wool, leather, and especially manure, the basis of all agricultural wealth.
If France consumes more oil, we shall see an expansion in the cultivation of the poppy, the olive, and rapeseed. These rich yet soil-exhausting plants will come at just the right time to enable us to put to profitable use the increased fertility that the breeding of cattle will impart to the land.
Our moors will be covered with resinous trees. Numerous swarms of bees will gather from our mountains the perfumed treasures that today waste their fragrance, like the flowers from which they emanate. Thus, there is not one branch of agriculture that would not undergo a great expansion.
The same holds true of shipping. Thousands of vessels will engage in whaling, and in a short time we shall have a fleet capable of upholding the honour of France and of gratifying the patriotic aspirations of the undersigned petitioners, chandlers, etc.
But what shall we say of the specialities of Parisian manufacture?Henceforth you will behold gilding, bronze, and crystal in candlesticks, in lamps, in chandeliers, in candelabra sparkling in spacious emporia compared with which those of today are but stalls.
There is no needy resin-collector on the heights of his sand dunes, no poor miner in the depths of his black pit, who will not receive higher wages and enjoy increased prosperity.
It needs but a little reflection, gentlemen, to be convinced that there is perhaps not one Frenchman, from the wealthy stockholder of the Anzin Company to the humblest vendor of matches, whose condition would not be improved by the success of our petition.
We anticipate your objections, gentlemen; but there is not a single one of them that you have not picked up from the musty old books of the advocates of free trade. We defy you to utter a word against us that will not instantly rebound against yourselves and the principle behind all your policy.
Will you tell us that, though we may gain by this protection, France will not gain at all, because the consumer will bear the expense?
We have our answer ready:
You no longer have the right to invoke the interests of the consumer. You have sacrificed him whenever you have found his interests opposed to those of the producer. You have done so in order to encourage industry and to increase employment. For the same reason you ought to do so this time too.
Indeed, you yourselves have anticipated this objection. When told that the consumer has a stake in the free entry of iron, coal, sesame, wheat, and textiles, “Yes,” you reply, “but the producer has a stake in their exclusion.” Very well, surely if consumers have a stake in the admission of natural light, producers have a stake in its interdiction.
“But,” you may still say, “the producer and the consumer are one and the same person. If the manufacturer profits by protection, he will make the farmer prosperous. Contrariwise, if agriculture is prosperous, it will open markets for manufactured goods.” Very well, If you grant us a monopoly over the production of lighting during the day, first of all we shall buy large amounts of tallow, charcoal, oil, resin, wax, alcohol, silver, iron, bronze, and crystal, to supply our industry; and, moreover, we and our numerous suppliers, having become rich, will consume a great deal and spread prosperity into all areas of domestic industry.
Will you say that the light of the sun is a gratuitous gift of Nature, and that to reject such gifts would be to reject wealth itself under the pretext of encouraging the means of acquiring it?
But if you take this position, you strike a mortal blow at your own policy; remember that up to now you have always excluded foreign goods because and in proportion as they approximate gratuitous gifts. You have only half as good a reason for complying with the demands of other monopolists as you have for granting our petition, which is in complete accord with your established policy; and to reject our demands precisely because they are better founded than anyone else’s would be tantamount to accepting the equation: + x + = -; in other words, it would be to heap absurdity upon absurdity.
Labour and Nature collaborate in varying proportions, depending upon the country and the climate, in the production of a commodity. The part that Nature contributes is always free of charge; it is the part contributed by human labour that constitutes value and is paid for.
If an orange from Lisbon sells for half the price of an orange from Paris, it is because the natural heat of the sun, which is, of course, free of charge, does for the former what the latter owes to artificial heating, which necessarily has to be paid for in the market.
Thus, when an orange reaches us from Portugal, one can say that it is given to us half free of charge, or, in other words, at half price as compared with those from Paris.
Now, it is precisely on the basis of its being semigratuitous (pardon the word) that you maintain it should be barred. You ask: “How can French labour withstand the competition of foreign labour when the former has to do all the work, whereas the latter has to do only half, the sun taking care of the rest?” But if the fact that a product is half free of charge leads you to exclude it from competition, how can its being totally free of charge induce you to admit it into competition? Either you are not consistent, or you should, after excluding what is half free of charge as harmful to our domestic industry, exclude what is totally gratuitous with all the more reason and with twice the zeal.
To take another example: When a product — coal, iron, wheat, or textiles — comes to us from abroad, and when we can acquire it for less labour than if we produced it ourselves, the difference is a gratuitous gift that is conferred up on us. The size of this gift is proportionate to the extent of this difference. It is a quarter, a half, or three-quarters of the value of the product if the foreigner asks of us only three-quarters, one-half, or one-quarter as high a price. It is as complete as it can be when the donor, like the sun in providing us with light, asks nothing from us. The question, and we pose it formally, is whether what you desire for France is the benefit of consumption free of charge or the alleged advantages of onerous production. Make your choice, but be logical; for as long as you ban, as you do, foreign coal, iron, wheat, and textiles, in proportion as their price approaches zero, how inconsistent it would be to admit the light of the sun, whose price is zero all day long!
As the City of Wichita prepares to grant special tax status to another new industrial building, existing landlords must be wondering why they struggle to stay in business when city hall sets up subsidized competitors with new buildings and a large cost advantage. From June 2014.
Tomorrow the Wichita City Council considers whether to grant property and sales tax exemptions to a proposed speculative industrial building in north central Wichita. If approved, this will be the second project undertaken under new economic development policies that allow for this type of tax exemption.
City documents estimate that the property tax savings for the first year will be $312,055. This exemption will be granted for five years, with a second five year period possible if performance goals are met.
The city documents also state that the project will also apply for a sales tax exemption, but no estimate of these tax savings are given. It’s common for a project of this type to have about half its cost in purchases subject to sales tax. With “site work and building” at $10,350,000, sales tax in Wichita on half that amount is $370,012. Undoubtedly a rough estimate, it nonetheless gives an idea of how much sales tax the developers will avoid paying.
(If city hall has its way, the sales tax in Wichita will soon increase by one cent per dollar, meaning the developers of this project would save $421,762 in sales tax. While others will hurry to make purchases before the higher sales tax rate takes effect — if it does — these developers will be in no hurry. Their sales tax is locked in at zero percent. In fact, once having a sales tax or property tax exemption, these developers are now in a position to root for higher sales and property tax rates, as that increases costs for their competitors, thereby giving these tax-exempt developers a competitive advantage.)
City documents give the benefit-cost ratios for the city and overlapping jurisdictions:
City of Wichita General Fund 1.30 to one
Sedgwick County 1.18 to one
USD 259 1.00 to one
State of Kansas 12.11 to one
It’s not known whether these ratios include the sales tax forgiveness.
While the City of Wichita insists that projects show a benefit-cost ratio of 1.3 to one or better (although there are many exceptions), it doesn’t apply that standard for overlapping jurisdictions. Here, Sedgwick County experiences a benefit-cost ratio of 1.18 to one, and the Wichita school district (USD 259) 1.00 to one. These two governmental bodies have no input on the decision the city is making on their behalf. The school district’s share of the forgiven taxes is 47.4 percent.
When the city granted a similar tax exemption to a speculative warehouse in southwest Wichita, my estimates were that its landlord has a cost advantage of about 20 percent over other property owners. Existing industrial landlords in Wichita — especially those with available space to rent and those who may lose tenants to this new building — must be wondering why they struggle to stay in business when city hall sets up subsidized competitors with new buildings and a large cost advantage.
Wichita property taxes
Property taxes in Wichita are high for industrial buildings, and even higher for commercial buildings. See Wichita property taxes compared. So it’s difficult to blame developers for seeking relief. But instead of offering tax relief to those who ask and to those city hall approves of, it would be better to have lower taxes for everyone.
Targeted economic development incentives
The targeted economic development efforts of governments like Wichita fail for several reasons. First is the knowledge problem, in that government simply does not know which companies are worthy of public investment. In the case of the Wichita, do we really know which industries should be targeted? Is 1.3 to one really the benchmark we should seek, or would we be better off by insisting on 1.4 to one? Or should we relax the requirement to 1.2 to one so that more projects might qualify?
This assumes that these benefit-costs ratios have validity. This is far from certain, as follows:
The benefits that government claims are not really benefits. Instead, they’re in the form of higher tax revenue. This is very different from the profits companies earn in voluntary market transactions.
Government claims that in order to get these “benefits,” the incentives must be paid. But often the new economic activity (expansion, etc.) would have happened anyway without the incentives.
Why is it that most companies are able to grow without incentives, but only a few companies require incentives? What is special about these companies?
If the relatively small investment the city makes in incentives is solely responsible for such wonderful outcomes in terms of jobs, why doesn’t the city do this more often? If the city has such power to create economic growth, why is anyone unemployed?
Do incentives work?
The uncontroverted peer-reviewed research tells us that targeted economic development incentives don’t work, if we consider the entire economy. See: Research on economic development incentives. Some of the conclusions of the studies listed there include:
“No evidence of incentive impact on manufacturing value-added or unemployment”
“Small reduction in employment by businesses which received Ohio’s tax incentives”
“No evidence of large firm impacts on local economy”
“No permanent employment increase across a quasi-experimental panel of all Cabela’s stores”
“Employment impact of large firms is less than gross job creation (by about 70%)”
These research programs illustrate the fallacy of the seen and the unseen. It is easy to see the jobs being created by economic development incentives. It’s undeniable that jobs are created at firms that receive incentives, at least most of the time. But these jobs are easy to see. It’s easy for news reporters to find the newly-hired and grateful workers, or to show video footage of a new manufacturing plant.
But it’s very difficult to find specific instances of the harm that government intervention produces. It is, generally, dispersed. People who lose their jobs usually don’t know the root cause of why they are now unemployed. Businesses whose sales decline often can’t figure out why.
But evidence tells us this is true: These incentives, along with other forms of government interventionism, do more harm than good.
In Rich States, Poor States, Kansas continues with middle-of-the-pack performance, and fell in the forward-looking forecast for the second year in a row.
In the 2015 edition of Rich States, Poor States, Utah continues its streak at the top of Economic Outlook Ranking, meaning that the state is poised for growth and prosperity. Kansas continues with middle-of-the-pack performance rankings, and fell in the forward-looking forecast.
Rich States, Poor States is produced by American Legislative Exchange Council. The authors are economist Dr. Arthur B. Laffer, Stephen Moore, who is Distinguished Visiting Fellow, Project for Economic Growth at The Heritage Foundation, and Jonathan Williams, who is vice president for the Center for State Fiscal Reform at ALEC.
Rich States, Poor States computes two measures for each state. The first is the Economic Performance Ranking, described as “a backward-looking measure based on a state’s performance on three important variables: State Gross Domestic Product, Absolute Domestic Migration, and Non-Farm Payroll Employment — all of which are highly influenced by state policy.” The process looks at the past ten years.
Looking forward, there is the Economic Outlook Ranking, “a forecast based on a state’s current standing in 15 state policy variables. Each of these factors is influenced directly by state lawmakers through the legislative process. Generally speaking, states that spend less — especially on income transfer programs, and states that tax less — particularly on productive activities such as working or investing — experience higher growth rates than states that tax and spend more.”
For economic performance this year, Kansas is twenty-eighth. That’s up from thirty-second last year.
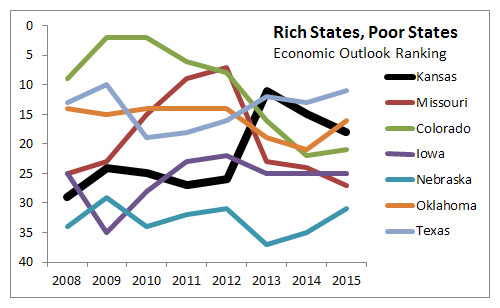
In this year’s compilation for economic outlook, Kansas ranks eighteenth, down from fifteenth last year and eleventh the year before. In 2008, the first year for this measure, Kansas was twenty-ninth.
Kansas compared to other states
A nearby chart shows the Economic Outlook Ranking for Kansas and some nearby states, shown as a trend over time since 2008. The peak of Kansas in 2013 is evident, as is the decline since then.
Why Kansas fell
Kansas fell in the Economic Outlook Ranking from 2013 to 2015. To investigate why, I gathered data for Kansas from 2008 to 2015. The nearby table shows the results for 2015 and the rank among the states, with the trend since 2008 shown. A rank of one is the best ranking, so for the trend lines, an upward slope means a decline in ranking.
There are several areas that may account for the difference. One value, “Top Marginal Corporate Income Tax Rate,” did not change from 2013 to 2015, remaining at 7.00%. But the ranking for Kansas fell from 24 to 27, meaning that other states improved in this measure relative to Kansas.
For “Personal Income Tax Progressivity (change in tax liability per $1,000 of Income)” Kansas fell two positions in rank.
In “Property Tax Burden (per $1,000 of personal income)” Kansas fell three spots since 2013.
In “Sales Tax Burden (per $1,000 of personal income)” Kansas fell three spots in rank. The burden is calculated proportional to personal income.
In “Recently Legislated Tax Changes (per $1,000 of personal income)” Kansas fell one position in rank.
Kansas improved six rank positions for “Debt Service as a Share of Tax Revenue.”
Kansas remains one of the states with the most public employees, with 695.4 full-time equivalent employees per 10,000 population. This ranks forty-eighth among the states.
“Average Workers’ Compensation Costs (per $100 of payroll)” rose by one cent, and Kansas fell two spots in ranking.
Kansas has no tax and expenditure limitations, which is a disadvantage compared to other states.
How valuable is the ranking?
After the 2012 rankings were computed, ALEC looked retrospectively at rankings compared to actual performance. The nearby chart shows the correlation of ALEC-Laffer state policy ranks and state economic performance. In its discussion, ALEC concluded:
There is a distinctly positive relationship between the Rich States, Poor States’ economic outlook rankings and current and subsequent state economic health.
The formal correlation is not perfect (i.e., it is not equal to 100 percent) because there are other factors that affect a state’s economic prospects. All economists would concede this obvious point. However, the ALEC-Laffer rankings alone have a 25 to 40 percent correlation with state performance rankings. This is a very high percentage for a single variable considering the multiplicity of idiosyncratic factors that affect growth in each state — resource endowments, access to transportation, ports and other marketplaces, etc.
A Kansas economic development incentive program is pitched as being self-funded, but is probably a drain on the state treasure nonetheless.
An economic development incentive program in Kansas is PEAK, or Promoting Employment Across Kansas. This program allows companies to retain 95 percent of the payroll withholding tax of employees.
PEAK incentive payments can be a substantial sum. Tables available at the Kansas Department of Revenue indicate that for a single person with no exemptions who earns $40,000 annually, the withholding would be $27 per week (for weekly payroll), or $1,404 annually. For a married person with two children earning the same salary, withholding would be $676 annually. Under PEAK, the company retains 95 percent of these values.
Legislators and public officials like programs like PEAK partly because they can promote these programs as self-financing. That is, the state isn’t subsidizing a company. Instead, the company is paying its own way with its own taxes. The state is not sending money to the company, it’s just holding on to 95 percent of its employees’ withholding taxes instead of sending the funds to the state. Something like that.
But here’s a consideration. The amount of money withheld from a worker’s paycheck is not the same as the amount of tax the worker actually owes the state. Withholding is only an approximation, and one that is biased in favor of the state. Many Kansas workers receive an income tax refund from the state. This is in recognition that the sum of the withholding taxes paid by a worker is larger than the actual tax liability. Therefore, the state is returning money that the state was not entitled to.
Now, what about workers who are employed at a company that is in the PEAK program and who receive a state income tax refund? Their withholding taxes — 95 percent, anyway — have already been given back to their employer.
So: What is the source of the money used to pay these refunds? How much money is paid in refunds to employees working at PEAK-participating companies?
We should note that the funds don’t come from the PEAK company’s employees, as the employees receive credit for all their withholding taxes, even though 95 percent never contributed to the state treasury.
Inquiry to the Department of Revenue revealed that there are no statistics on actual income tax liability of PEAK employees vs. the amount of withholding tax credited to that employee that was retained or refunded to the PEAK employer. The Department of Commerce referred inquiries to the Department of Revenue.
If we wanted to know how much money was paid in refunds to PEAK-company employees, I believe we would need to examine the account of each affected employee. I’m sure it’s not possible to come up with an answer by making assumptions, because the circumstances of each taxpayer vary widely.
Whatever the amount, it represents state tax revenue being used to fund an economic development incentive program that is pitched as being self-funded.
A Kansas economic development incentive program has the potential to alter hiring practices for reasons not related to applicants’ job qualifications.
An economic development incentive program used in Kansas is PEAK, or Promoting Employment Across Kansas. This program allows companies to retain 95 percent of the payroll withholding tax of employees. According to the Kansas Depart of Commerce, “PEAK is intended to encourage economic development in Kansas by incenting companies to relocate, locate or expand business operations and jobs in Kansas. The Secretary of Commerce has discretion to approve applications of qualified companies and determine the benefit period.” Many states have similar programs.
PEAK incentive payments can be a substantial sum. Tables available at the Kansas Department of Revenue indicate that for a single person with no exemptions who earns $40,000 annually, the withholding would be $27 per week (for weekly payroll), or $1,404 annually. For a married person with two children earning the same salary, withholding would be $676 annually. Under PEAK, the company retains 95 percent of these values.
There’s the catch. The more tax exemptions a person claims, the lower their taxes, and the lower their payroll withholding. Since PEAK is based directly on the amount of withholding taxes, if less is withheld from employee paychecks, the company receives fewer incentive dollars. In the example above, the single worker generates incentives payments 108 percent greater than does the married worker with two children.
The question is: Does this provide incentives for companies in the PEAK program to adjust their hiring preferences? Is there an incentive for companies in the PEAK program to hire single workers with no dependents, rather than married workers with children?
In theory, yes, the incentive exists. Whether it produces an effect in practice is probably impossible to tell. It does illustrate some of the perverse incentives that can arise from government intervention in the economy.
If government simply paid cash to companies in a fixed amount per worker, the bias in favor of single workers would not exist. But if government paid cash directly to companies, many people would object. When accomplished through the tax system, however, the transactions are less obvious, but the benefits and costs are just as real.
Either way, cronyism exists, especially because the Secretary of Commerce has discretion in the approval of applications to participate in PEAK.
Tax increment financing disrupts the usual flow of tax dollars, routing funds away from cash-strapped cities, counties, and schools back to the TIF-financed development. TIF creates distortions in the way cities develop, and researchers find that the use of TIF means lower economic growth.
The consideration this week by the Wichita City Council of two project plans in tax increment financing districts offers an opportunity to examine the issues surrounding TIF.
How TIF works
A TIF district is a geographically-defined area.
In Kansas, TIF takes two or more steps. The first step is that cities or counties establish the boundaries of the TIF district. After the TIF district is defined, cities then must approve one or more project plans that authorize the spending of TIF funds in specific ways. (The project plan is also called a redevelopment plan.) In Kansas, overlapping counties and school districts have an opportunity to veto the formation of the TIF district, but this rarely happens. Once the district is formed, cities and counties have no ability to object to TIF project plans.
Before the formation of the TIF district, the property pays taxes to the city, county, school district, and state as can be seen in figure 1. Because property considered for TIF is purportedly blighted, the amount of tax paid is usually small. Whatever it is, that level is called the “base.”
After approval of one or more TIF project plans the city borrows money and gives it to the project or development. The city now has additional debt in the form of TIF bonds that require annual payments. Figure 2 illustrates. (There is now another form of TIF known as “pay-as-you-go” that works differently, but produces much the same economic effect.)
Figure 3 shows the flow of tax revenue after the formation of the TIF district and after the completion of a project. Because buildings were built or renovated, the property is worth more, and the property tax is now higher. The development now has two streams of property tax payments that are handled in different ways. The original tax — the “base” — is handled just like before, distributed to city, state, school district, and the state, according to their mill levy rates. The difference between the new tax and the base tax — the “increment” — is handled differently. It goes to only two destinations (mostly): The State of Kansas, and repayment of the TIF bonds.
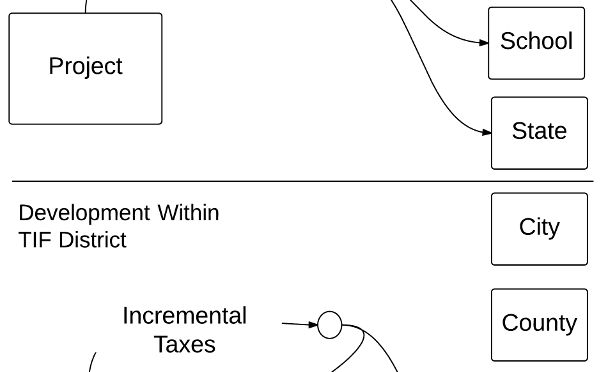
Figure 4 highlights the difference in the flow of tax revenues. The top portion of the illustration shows development outside of TIF. We see the flows of tax payments to city, county, school district, and the state. In the bottom portion, which shows development under TIF, the tax flows to city, county, and school district are missing. No longer does a property contribute to the support of these three units of government, although the property undoubtedly requires the services of them. This is especially true for a property in Old Town, which consumes large amounts of policing.
(Cities, counties, and school districts still receive the base tax payments, but these are usually small, much smaller than the incremental taxes. In non-TIF development, these agencies still receive the base taxes too, plus whatever taxes result from improvement of the property — the “increment,” so to speak. Or simply, all taxes.)
The Kansas law governing TIF, or redevelopment districts as they are also called, starts at K.S.A. 12-1770.
TIF and public policy
Originally most states included a “but for” test that TIF districts must meet. That is, the proposed development could not happen but for the benefits of TIF. Many states have dropped this requirement. At any rate, developers can always present proposals that show financial necessity for subsidy, and gullible government officials will believe.
Similarly, TIF was originally promoted as a way to cure blight. But cities are so creative and expansive in their interpretation of blight that this requirement, if it still exists, has little meaning.
The rerouting of property taxes under TIF goes against the grain of the way taxes are usually rationalized. We use taxation as a way to pay for services that everyone benefits from, and from which we can’t exclude people. An example would be police protection. Everyone benefits from being safe, and we can’t exclude people from benefiting from police protection.
So when we pay property tax — or any tax, for that matter — people may be comforted knowing that it goes towards police and fire protection, street lights, schools, and the like. (Of course, some is wasted, and government is not the only way these services, especially education, could be provided.)
But TIF is contrary to this justification of taxes. TIF allows property taxes to be used for one person’s (or group of persons) exclusive benefit. This violates the principle of broad-based taxation to pay for an array of services for everyone. Remember: What was the purpose of the TIF bonds? To pay for things that benefited the development. Now, the development’s property taxes are being used to repay those bonds instead of funding government.
One more thing: Defenders of TIF will say that the developers will pay all their property taxes. This is true, but only on a superficial level. We now see that the lion’s share of the property taxes paid by TIF developers are routed back to them for their own benefit.
It’s only infrastructure
In their justification of TIF in general, or specific projects, proponents may say that TIF dollars are spent only on allowable purposes. Usually a prominent portion of TIF dollars are spent on infrastructure. This allows TIF proponents to say the money isn’t really being spent for the benefit of a specific project. It’s spent on infrastructure, they say, which they contend is something that benefits everyone, not one project specifically. Therefore, everyone ought to pay.
This attitude is represented by a comment left at Voice for Liberty, which contended: “The thing is that real estate developers do not invest in public streets, sidewalks and lamp posts, because there would be no incentive to do so. Why spend millions of dollars redoing or constructing public streets when you can not get a return on investment for that”
This perception is common: that when we see developers building something, the City of Wichita builds the supporting infrastructure at no cost to the developers. But it isn’t quite so. About a decade ago a project was being developed on the east side of Wichita, the Waterfront. This project was built on vacant land. Here’s what I found when I searched for City of Wichita resolutions concerning this project:
Note specifically one item: $1,672,000 for the construction of Waterfront Parkway. To anyone driving or walking in this area, they would think this is just another city street — although a very nicely designed and landscaped street. But the city did not pay for this street. Private developers paid for this infrastructure. Other resolutions resulted in the same developers paying for street lights, traffic signals, sewers, water pipes, and turning lanes on major city streets. All this is infrastructure that we’re told real estate developers will not pay for. But in order to build the Waterfront development, private developers did, with a total cost of these projects being $3,334,500. (It’s likely I did not find all the resolutions and costs pertaining to this project, and more development has happened since this research.)
In a TIF district, these things are called “infrastructure” and will be paid for by the development’s own property taxes — taxes that must be paid in any case. Outside of TIF districts, developers pay for these things themselves.
If not for TIF, nothing will happen here
Generally, TIF is justified using the “but-for” argument. That is, nothing will happen within a district unless the subsidy of TIF is used. Paul F. Byrne explains:
“The but-for provision refers to the statutory requirement that an incentive cannot be awarded unless the supported economic activity would not occur but for the incentive being offered. This provision has economic importance because if a firm would locate in a particular jurisdiction with or without receiving the economic incentive, then the economic impact of offering the incentive is non-existent. … The but-for provision represents the legislature’s attempt at preventing a local jurisdiction from awarding more than the minimum incentive necessary to induce a firm to locate within the jurisdiction. However, while a firm receiving the incentive is well aware of the minimum incentive necessary, the municipality is not.”
“This paper conducts a comprehensive assessment of the effectiveness of Chicago’s TIF program in creating economic opportunities and catalyzing real estate investments at the neighborhood scale. This paper uses a unique panel dataset at the block group level to analyze the impact of TIF designation and investments on employment change, business creation, and building permit activity. After controlling for potential selection bias in TIF assignment, this paper shows that TIF ultimately fails the ‘but-for’ test and shows no evidence of increasing tangible economic development benefits for local residents.” (emphasis added)
In the paper, the author clarifies:
“To clarify these findings, this analysis does not indicate that no building activity or job crea-tion occurred in TIFed block groups, or resulted from TIF projects. Rather, the level of these activities was no faster than similar areas of the city which did not receive TIF assistance. It is in this aspect of the research design that we are able to conclude that the development seen in and around Chicago’s TIF districts would have likely occurred without the TIF subsidy. In other words, on the whole, Chicago’s TIF program fails the ‘but-for’ test.
Later on, for emphasis:
“While the findings of this paper are clear and decisive, it is important to comment here on their exact extent and external validity, and to discuss the limitations of this analysis. First, the findings do not indicate that overall employment growth in the City of Chicago was negative or flat during this period. Nor does this research design enable us to claim that any given TIF-funded project did not end up creating jobs. Rather, we conclude that on-average, across the whole city, TIF was unsuccessful in jumpstarting economic development activity — relative to what would have likely occurred otherwise.” (emphasis in original)
The author notes that these conclusions are specific to Chicago’s use of TIF, but should “should serve as a cautionary tale.”
The paper reinforces the problem of using tax revenue for private purposes, rather than for public benefit: “Essentially, Chicago’s extensive use of TIF can be interpreted as the siphoning off of public revenue for largely private-sector purposes. Although, TIF proponents argue that the public receives enhanced economic opportunity in the bargain, the findings of this paper show that the bargain is in fact no bargain at all.”
TIF is social engineering
TIF represents social engineering. By using it, city government has decided that it knows best where development should be directed. In particular, the Wichita city council has decided that Old Town and downtown development is on a superior moral plane to other development. Therefore, we all have to pay higher taxes to support this development. What is the basis for saying Old Town developers don’t have to pay for their infrastructure, but developers in other parts of the city must pay?
TIF doesn’t work
Does TIF work? It depends on what the meaning of “work” is.
If by working, do we mean does TIF induce development? If so, then TIF usually works. When the city authorizes a TIF project plan, something usually gets built or renovated. But this definition of “works” must be tempered by a few considerations.
Does TIF pay for itself?
First, is the project self-sustaining? That is, is the incremental property tax revenue sufficient to repay the TIF bonds? This has not been the case with all TIF projects in Wichita. The city has had to bail out two TIFs, one with a no-interest and low-interest loan that cost city taxpayers an estimated $1.2 million.
The verge of corruption
Second, does the use of TIF promote a civil society, or does it lead to cronyism? Randal O’Toole has written:
“TIF puts city officials on the verge of corruption, favoring some developers and property owners over others. TIF creates what economists call a moral hazard for developers. If you are a developer and your competitors are getting subsidies, you may simply fold your hands and wait until someone offers you a subsidy before you make any investments in new development. In many cities, TIF is a major source of government corruption, as city leaders hand tax dollars over to developers who then make campaign contributions to re-elect those leaders.”
We see this in Wichita, where the regular recipients of TIF benefits are also regular contributors to the political campaigns of those who are in a position to give them benefits. The corruption is not illegal, but it is real and harmful, and calls out for reform. See In Wichita, the need for campaign finance reform.
The effect of TIF on everyone
Third, what about the effect of TIF on everyone, that is, the entire city or region? Economists have studied this matter, and have concluded that in most cases, the effect is negative.
“TIF districts grow much faster than other areas in their host municipalities. TIF boosters or naive analysts might point to this as evidence of the success of tax increment financing, but they would be wrong. Observing high growth in an area targeted for development is unremarkable.”
So TIF districts are good for the favored development that receives the subsidy — not a surprising finding. What about the rest of the city? Continuing from the same study:
“If the use of tax increment financing stimulates economic development, there should be a positive relationship between TIF adoption and overall growth in municipalities. This did not occur. If, on the other hand, TIF merely moves capital around within a municipality, there should be no relationship between TIF adoption and growth. What we find, however, is a negative relationship. Municipalities that use TIF do worse.
We find evidence that the non-TIF areas of municipalities that use TIF grow no more rapidly, and perhaps more slowly, than similar municipalities that do not use TIF.” (emphasis added)
In a different paper (The Effects of Tax Increment Financing on Economic Development), the same economists wrote “We find clear and consistent evidence that municipalities that adopt TIF grow more slowly after adoption than those that do not. … These findings suggest that TIF trades off higher growth in the TIF district for lower growth elsewhere. This hypothesis is bolstered by other empirical findings.” (emphasis added)
“This article addresses the claim by examining the impact of TIF adoption on municipal employment growth in Illinois, looking for both general impact and impact specific to the type of development supported. Results find no general impact of TIF use on employment. However, findings suggest that TIF districts supporting industrial development may have a positive effect on municipal employment, whereas TIF districts supporting retail development have a negative effect on municipal employment. These results are consistent with industrial TIF districts capturing employment that would have otherwise occurred outside of the adopting municipality and retail TIF districts shifting employment within the municipality to more labor-efficient retailers within the TIF district.” (emphasis added)
These studies and others show that as a strategy for increasing the overall wellbeing of a city, TIF fails to deliver prosperity, and in fact, causes harm.