The new State of Downtown Wichita report for 2017 is missing something. What is it, and why is it missing?
Recently the Wichita Business Journal reported:
When you’re Jeff Fluhr, you don’t spend much time in park — it’s usually full speed ahead.
It was no different when a couple of members of the Wichita Business Journal’s newsroom visited with the president of Downtown Wichita and the Greater Wichita Partnership in early October.
On this day, Fluhr was excited to pass out copies of the 42-page 2017 “State of Downtown” report, which had just been released. 1
The new report is something better than before. 2 Actually, it’s what is left out that marks a step forward for Downtown Wichita, which is the new name for the Wichita Downtown Development Corporation.
Downtown Wichita brochure.Previous versions of the report prominently mentioned the number of daytime workers in downtown Wichita. 3The number most often given was 26,000. But that number is missing from this year’s report. Unless I overlooked it, there is no mention of the number of workers in downtown Wichita.
Why was this number omitted from this year’s report? Earlier this year I found out that the U.S. Census Bureau data series which was the source of this statistic is not a valid measure of the number of people working downtown. That’s because the series counts all the employees of the Wichita public school district as downtown workers solely because the district’s headquarters building is downtown.4 This means the statistic is not valid and meaningful, because most school workers don’t work at the downtown building. Instead, they’re working in schools and other facilities dispersed throughout the district. A similar anomaly exists for Wichita city workers: All are counted as though they work in the city hall building. 5
When I asked Jeff Fluhr, the president of Downtown Wichita, about this he referred my question to Jeremy Hill, the Director of Center for Economic Development and Business Research at Wichita State University. This was — seemingly — reasonable as CEDBR supplied the number to Fluhr’s organization. Hill’s response was unsatisfactory in resolving the issue. In conclusion, Hill wrote to me: “Although the center systematically questions all data sources (federal, state, private, and nonprofit) for reasonableness, limited resources (e.g. time and costs) prevent us from validating and/or cross checking every statistic. In this situation, the center used the appropriate source for the research question and the total number of people estimated to work downtown was within reason.”
The Census Bureau OnTheMap application for downtown Wichita, zip code 67202. Click for larger.LODES data for census block 201730043001036, showing 7,740 workers.Here’s what concerns me. This data comes from a Census Bureau application called “OnTheMap.” When using the OnTheMap application for downtown Wichita, which is zip code 67202, there are two large bright blue dots that stand out from all others. These represent the two highest concentrations of workers in downtown Wichita. One is Census block 201730043001036, which has 7,740 employees. This is a one square block area from First to Second Streets, and Wichita to Water Streets. That block, for the year of this data, held the Wichita school district headquarters building.
7,740 employees is a lot. It’s about one-fourth of the total downtown employee count claimed by Downtown Wichita and CEDBR. It’s more employees than McConnell Air Force Base has, and about twice as many that work at Koch Industries in Wichita.
Importantly, this number is eleven times the number that work at Cargill, a company which Wichita is granting many millions of dollars in incentives just to retain the company in Wichita.
Promotional material on the former Henry’s building. Click for larger.We just have to wonder: Didn’t anyone look at this data in a serious and critical manner? A quick glance at the data by CEDBR, much less “systematically” checking for “reasonableness” should have led to questions. A quick look by Downtown Wichita staff should have spurred these inquiries: Who do all these people work for in that one block? This is a wonderful success story! How can we replicate this great accomplishment in other blocks in downtown Wichita?
And didn’t anyone at the City of Wichita — council members and bureaucrats alike — wonder about these numbers?
That didn’t happen. Or maybe it did, and someone in authority nonetheless decided to proceed to use a statistic that doesn’t mean what city leaders say it means.
That’s why I wrote it was seemingly reasonable for Fluhr to refer me to CEDBR with my questions about the data. In retrospect, it is clear this is a multi-year episode of incompetence, ineptitude, or dishonesty.
But at least this statistic is no longer used.
I asked Cindy Claycomb, who is Chair of the Executive Committee of Downtown Wichita, about this. She replied that all data sources are listed in the report, and that the board relies on the expertise of the Wichita Downtown Development Corporation staff to decide what is presented in each year’s report. She said Jeff Fluhr was the best person to address my concerns. He, as we saw, demurred to CEDBR at WSU.
(By the way, Claycomb is nearly certain to be elected to the Wichita City Council in November. Jeff Fluhr is now, besides president of Downtown Wichita, also president of Greater Wichita Partnership, the new organization regional governments rely on for economic development.)
Trends of business activity in downtown Wichita. Click for larger.So: How many jobs are in downtown Wichita? There is another series of census data that is better, but not perfect, as it counts private-sector employees only. That data shows 13,581 workers in downtown Wichita for 2015. 6 But what’s remarkable — and disappointing — about this data series is its trend: It’s going down. The recent peak was 16,658 workers in 2008. By 2015 that number was down by 18 percent. (Again, these are private sector workers only.)
In summer 2017 the district moved its headquarters away from downtown to the former Southeast High School. It will be a few years before this is reflected in Census Bureau data. ↩
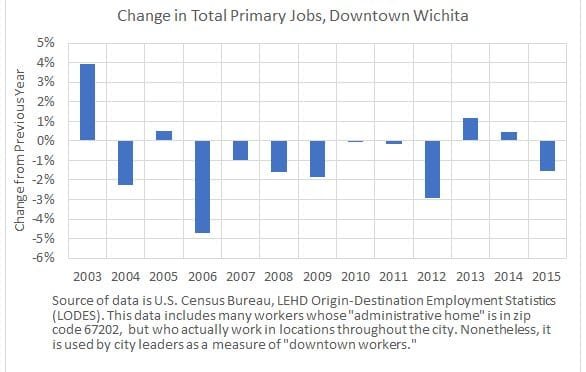
By the measure of jobs used by the City of Wichita, downtown jobs declined in 2015.
Jobs in downtown Wichita, according to LEHD Origin-Destination Employment Statistics. Click for larger.Annual change in jobs, according to LEHD Origin-Destination Employment Statistics. Click for larger.According to a series of data from the United States Census Bureau, the number of jobs in downtown Wichita declined by 1.6 percent from 2014 to 2015.
The data, known as LEHD Origin-Destination Employment Statistics, or LODES, was updated in September to include data from 2015. 1 Downtown Wichita is defined in this case as zip code 67202, which is the same definition used by the city of Wichita, Wichita Downtown Development Corporation, and Center for Economic Growth and Business Research at Wichita State University.
As can be seen in the nearby charts, the number of jobs has been on a mostly downhill trend.
There is, however a serious problem with this data series, as it includes workers whose “administrative home” is downtown, even though they work somewhere else. The Census Bureau makes this caveat clear to users of this data. 2 Because all Wichita school district employees have an “address” of 201 N. Water in downtown Wichita, they appear in the LODES data series as employees with that address.
Trends of business activity in downtown Wichita. Click for larger.It is a serious mistake to count all Wichita school district employees as downtown workers. Most school employees work in schools and other sites scattered throughout the city, not in downtown. Further, this year the school district moved its administrative offices to the former Southeast High School building at Lincoln and Edgemoor. That’s in zip code 67218, not 67202. The effect of this on the LODES statistics (it will appear that some 7,000 workers have moved out of downtown Wichita) probably won’t appear for two or three years.
Click for larger.Even if we use the data series promoted by the Wichita Downtown Development Corporation, the trend in jobs is in the wrong direction. WDDC promotes the large investment in downtown Wichita, by both private and public sources. 3 But employment is trending in the opposite direction. 4
But this data series is not useful as a measure of the number of people working in downtown Wichita, as it overstates the true number. The LODES data is widely cited by the City of Wichita and affiliated agencies such as WDDC and the Wichita Chamber of Commerce. 5 It appears prominently in the State of Downtown report produced by WDDC, generally released on May of each year. So far, there is no report for this year.
—
Notes
U.S. Census Bureau. LEHD Origin-Destination Employment Statistics Data (2002-2015) (computer file). Washington, DC: U.S. Census Bureau, Longitudinal-Employer Household Dynamics Program Available at https://lehd.ces.census.gov/data/#lodes. ↩
Wichita economic development efforts viewed in context.
Greater Wichita Partnership is the organization with primary responsibility for economic development in the Wichita area. Data provided by GWP shows that since 2004, GWP takes credit for creating an average 1,847 jobs per year through its economic development efforts. 1
To determine whether this is an impressive amount, we need context.
Over the past ten years the labor force for the Wichita MSA has averaged 314,877 each month (in May 2017 it was 306,809), and there were an average of 295,785 people working each month (May 2017 value was 293,763).
So one level of context is that the jobs for which GWP credits itself amount to 1,847 of 295,785 jobs, or 0.6 percent of the number of people working.
Click for larger.Another way to look at this level of job creation is to consider it in relation to the number of hires. Over the past ten years, the national average monthly rate of hires is about 3.4 percent, meaning that each month 3.4 percent of jobs have a new person filling them, or the jobs are newly-created. With an average of 295,785 people working in the Wichita MSA each month, this means that about 10,057 jobs have a new worker, each month. That’s 120,684 per year. With GWP taking credit for 1,847 jobs, this means that GWP’s efforts are responsible for 1.5 percent of the new hires each year.
Another context: Employment in the Wichita MSA reached a peak of 312,100 in July 2008. In June 2017 it was 298,800. To get back to the peak, Wichita needs 13,300 new jobs. At the GWP rate of 1,847 per year, it will take seven more years to recover.
All this shows that the efforts of our economic development machinery are responsible for small proportions of the jobs we need to create. This assumes that the data regarding jobs and investment that GWP provides is correct.
Here’s one example of problems with the data GWP provides. GWP reported that companies made investments of $1.2 billion in 2016 when the average for years before that was $138 million. That looks like an impressive jump. This figure, however, contains over one billion dollars of investment by Spirit Aerosystems projected to occur over the next five years. Not in 2016, but possible over the next five years. Yet GWP presents this investment as through it occurred in 2016.
Furthermore, when Spirit asked the city for authority to issue $280 bonds over five years, it told the city this would result in 349 new jobs over the same time period. That’s creating jobs at the rate of 70 per year. These jobs are welcome, but we need thousands of jobs per year. 2
Does GWP deserve credit? GWP says, “We only incorporate data and dollar amounts from projects which we helped attract, retain or expand; we do not include announcements that we have not assisted with.” 3 “Helped” and “assisted” are not very precise. How much “help” did Spirit need to decide to remain in Wichita, except for hundreds of millions of dollars in forgiven taxes? That is something the people of Wichita pay for, not GWP.
We must also be concerned about the reliability of GWP statistics. Earlier this year GWP was prominently promoting on its website the success of NetApp, a technology company. The problem is that NetApp never met the job creation numbers GWP promoted, and in fact, had been downsizing its Wichita operations. 4
Still, GWP promoted NetApp as a success. An important question is, the NetApp jobs that were announced but never created: Are they included in the jobs and investment totals GWP provides? We don’t know, because GWP will not disclose the data used to build its report.
There are other instances of GWP’s predecessor, Greater Wichita Economic Development Coalition (GWEDC), promoting Wichita as home to companies that had closed their Wichita facilities, or were in the process of closing. 5
GWP also promotes this on its website: “Downtown Wichita is work central, boasting 26,000 daytime workers in the financial, healthcare, education, oil & gas and creative services industries.” This claim of 26,000 workers is based on blatant misuse and misrepresentation of U.S. Census data, and GWP leadership has known of this for several months. 6 Still, the use of incorrect data remains.
Capacity to create
When the Wichita area offered incentives to a company that planned to add 50 jobs, the president of the chamber of commerce told commissioners that staff worked very hard to acquire these jobs. He called it “a great moment” in economic development. 7 But 50 jobs, while welcome, is just a drop in the bucket compared to what Wichita needs.
For Spirit to create 349 jobs over five years, we must let the company escape paying property tax and sales tax on $280 million of property.
For BG Products to add 11 well-paying jobs, we must let them avoid paying $204,280 per year in property taxes and $368,417 in sales tax.
In order to prepare the incentives package for another company, several events took place. There was a visit to the company. Then another visit and tour. Then economic development officials helped the company apply for benefits from the Kansas Department of Commerce. Then these officials worked closely with Wichita city staff on an incentive package. City documents stated that the expansion will create 28 jobs over the next five years. Obtaining these jobs took a lot of effort from Wichita and Kansas economic development machinery. Multiple agencies and fleets of bureaucrats at GWEDC, the City of Wichita, Sedgwick County, and the State of Kansas were involved. Wichita State University had to be involved. All this to create 5.6 jobs per year for five years.
This illustrates a capacity problem. Acquiring these jobs took a lot of bureaucratic effort, which has a cost. It required expensive incentives. Occasionally the city works with a large number of jobs, as in the recent case of Cargill. But those jobs required many expensive incentives, and no jobs were created. The incentives and effort were spent simply to persuade Cargill to remain in Wichita instead of moving elsewhere.
All this assumes, of course, that the incentives are necessary. Either that, or there is a larger problem. If companies can’t afford to make investments in Wichita unless they receive exemptions from paying taxes, we must conclude that taxes are too high. It’s either that, or these companies simply don’t want to participate in paying for the cost of government like most other companies and people do.
Civic leaders say that our economic development policies must be reformed. So far that isn’t happening. Our leaders say that we will no longer use cash incentives. But cash incentives like forgivable loans were a minor part of the incentives Wichita and the State of Kansas used. Furthermore, forgiveness of taxes is just as good as receiving cash. 8
The large amount of bureaucratic effort and cost spent to obtain relatively small numbers of jobs lets us know that we need to do something else to grow our local economy. We need to create a dynamic economy, focusing our efforts on creating an environment where growth can occur organically without management by government. Dr. Art Hall’s paper Embracing Dynamism: The Next Phase in Kansas Economic Development Policy provides much more information on the need for this. 9
In particular, Hall writes: “Embracing dynamism starts with a change in vision. Simply stated, the state government of Kansas should abandon its prevailing policy vision of the State as an active investor in businesses or industries and instead adopt the policy vision of the State as a caretaker of a competitive ‘platform’ — a platform that seeks to induce as much commercial experimentation as possible.” But our economic development policies are that of an “active investor,” and the cost of incentives increases the cost of experimentation.
Another thing we can do to help organically grow our economy and jobs is to reform our local regulatory regime.Kansas Policy Institute released a study of regulation and its impact at the state and local level. This is different from most investigations of regulation, as they usually focus on regulation at the federal level.
The study is titled “Business Perceptions of the Economic Impact of State and Local Government Regulation.” It was conducted by the Hugo Wall School of Public Affairs at Wichita State University. Click here to view the entire document.
Following is an excerpt from the introduction by James Franko, Vice President and Policy Director at Kansas Policy Institute. It points to a path forward.
Surprising to some, the businesses interviewed did not have as much of a problem with the regulations themselves, or the need for regulations, but with their application and enforcement. Across industries and focus group sessions the key themes were clear — give businesses transparency in what regulations are being applied, how they are employed, provide flexibility in meeting those goals, and allow an opportunity for compliance.
Sometimes things can be said so often as to lose their punch and become little more than the platitudes referenced above. The findings from Hugo Wall are clear that businesses will adapt and comply with regulations if they are transparent and accountable. Many in the public can be forgiven for thinking this was already the case. Thankfully, local and state governments can ensure this happens with minimal additional expense.
A transparent and accountable regulatory regime should be considered the “low hanging fruit” of government. Individuals and communities will always land on different places along the continuum of appropriate regulation. And, a give and take will always exist between regulators and the regulated. Those two truisms, however, should do nothing to undermine the need for regulations to be applied equally, based on clear rules and interpretations, and to give each business an opportunity to comply. (emphasis added)
Creating a dynamic economy and a reformed regulatory regime should cost very little. The benefits would apply to all companies — large or small, startup or established, local or relocations, in any industry.
Our civic leaders say that our economic development efforts must be reformed. Will the path forward be a dynamic economy and reformed regulation? Or will it be more bureaucracy, chasing jobs a handful at a time?
—
Notes
Greater Wichita Partnership – 2017 Investment Request. Part of the February 15, 2017 Sedgwick County Commission meeting. Available at https://goo.gl/hk6RHB. ↩
“Spirit is now requesting a new Letter of Intent (LOI) to issues IRBs in an amount not to exceed $280,000,000 for a period of five years. … Spirit projects it will create 349 new jobs over the next five years as a result of these expansions. In addition to the $280,000,000 Spirit expects to invest in facilities over the next five years, it also projects approximately $825,000,000 of capital investment in new machinery and equipment for a total capital investment in excess of $1 billion dollars.” Wichita City Council agenda packet for May 3, 2016. ↩
Personal correspondence from Andrew Nave, GWP executive vice president of economic development. ↩
In this episode of WichitaLiberty.TV: Bob Weeks and Karl Peterjohn discuss issues regarding the Wichita and Kansas economies. View below, or click here to view at YouTube. Episode 163, broadcast September 3, 2017.
Shownotes
Wichita employment trends. While the unemployment rate in the Wichita metropolitan area has been declining, the numbers behind the decline are not encouraging.
Downtown Wichita business trends. There has been much investment in Downtown Wichita, both public and private. What has been the trend in business activity during this time?
Wichita downtown plan focused on elite values, incorrect assumptions. One of the themes of those planning the future of downtown Wichita is that the suburban areas of Wichita are bad. The people living there are not cultured and sophisticated, the planners say. Suburbanites live wasteful lifestyles. Planners say they use too much energy, emit too much carbon, and gobble up too much land, all for things they’ve been duped into believing they want.
Charts shown in the show: (Click charts for larger versions.)
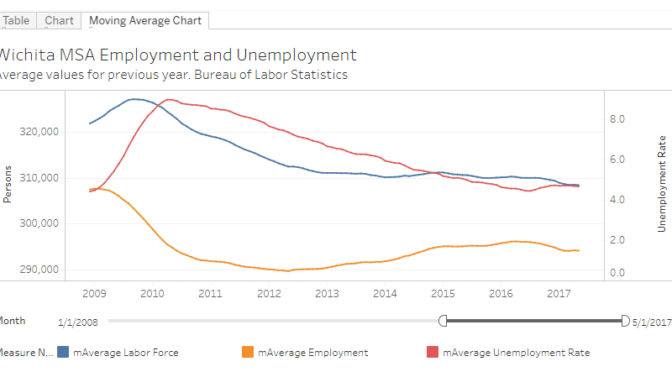
While the unemployment rate in the Wichita metropolitan area has been declining, the numbers behind the decline are not encouraging.
The unemployment rate, a widely-cited measure of the health of an economy, is not an absolute measure. Instead, it is a ratio, specifically the ratio of the number of unemployed people to the number of people in the labor force. (The labor force, broadly, is the number of persons working plus those actively looking for work. 1)
It is entirely possible that the unemployment rate falls while the number of people employed also falls. This is the general trend in Wichita for the past seven years or so. Here are some figures from Bureau of Labor Statistics, part of the United States Department of Labor: 2
The May 2017 unemployment rate declined to just about half the January 2011 rate. The number of employed persons rose by 1.1 percent. The labor force fell by 3.7 percent.
If we consider only unemployment rate, it looks like the Wichita area is prospering. But the unemployment rate hides bad news: The number of jobs increased only slightly, and the labor force fell. While it’s good that there are more people working, the decline in the labor force is a problem.
In the nearby chart you can see these effects. The unemployment rate has been declining, although it has recently increased slightly. The labor force has been declining. The number of employed persons has increased, although it has recently declined.
To use an interactive visualization of employment data for Wichita, click here.
Example from the visualization. Click for larger.
—
Notes
The labor force, specifically the civilian labor force, are those people working, plus those people actively searching for work, minus people under 16 years of age, minus people living in institutions (for example, correctional facilities, long-term care hospitals, and nursing homes), minus people on active duty in the Armed Forces.
BLS defines unemployed people as: “Persons aged 16 years and older who had no employment during the reference week, were available for work, except for temporary illness, and had made specific efforts to find employment sometime during the 4-week period ending with the reference week. Persons who were waiting to be recalled to a job from which they had been laid off need not have been looking for work to be classified as unemployed.”
The unemployment rate is “the number unemployed as a percent of the labor force.”
Bureau of Labor Statistics. Glossary. Available at https://www.bls.gov/bls/glossary.htm. ↩
Bureau of Labor Statistics. Labor Force Statistics from the Current Population Survey. Available at https://www.bls.gov/cps/. ↩
Charts of employment in the Wichita metro area, along with Kansas and the United States.
Since 1990 the country has experienced three recessions. For the first two, Wichita was able to catch up with the employment growth experienced by the entire nation.
For the most recent recession, however, this hasn’t been the case. In fact, as time has progressed since 2010, the gap between Wichita and the nation has grown. Wichita is falling farther behind. You can also see evidence of this in the chart of one-year and five-year changes in employment. The peaks for the five-year series have become shorter and narrower, indicating weaker recoveries from recessions.
Source of data is Bureau of Labor Statistics, an agency of the United States Department of Labor, 1 specifically the Current Employment Statistics program. 2 Charts created by the author. The charts of employment are indexed so that relative changes may be compared. Clicking charts may produce larger versions.
Wichita MSA employment since 1990.Wichita MSA employment since 2010.Changes in Wichita MSA employment since 1990.Five-Year change in Wichita MSA employment.
—
Notes
“The Bureau of Labor Statistics of the U.S. Department of Labor is the principal Federal agency responsible for measuring labor market activity, working conditions, and price changes in the economy. Its mission is to collect, analyze, and disseminate essential economic information to support public and private decision-making. As an independent statistical agency, BLS serves its diverse user communities by providing products and services that are objective, timely, accurate, and relevant.” Bureau of Labor statistics. About BLS.https://www.bls.gov/bls/infohome.htm. ↩
In this episode of WichitaLiberty.TV: John Todd joins Bob Weeks and Karl Peterjohn to discuss issues involving the City of Wichita, including the future of Naftzger Park and economic development. View below, or click here to view at YouTube. Episode 157, broadcast July 9, 2017.
Article link: An information resource regarding the future of Naftzger Park in downtown Wichita
Article link: Downtown Wichita business trends: There has been much investment in Downtown Wichita, both public and private. What has been the trend in business activity during this time?
Article link: Downtown Wichita jobs, sort of: The claim of 26,000 workers in downtown Wichita is based on misuse of data so blatant it can be described only as malpractice.
The Wichita Eagle’s coverage of the number of workers in Downtown Wichita isn’t fake news, just wrong news.
A recent Wichita Eagle article reported on the number of workers in downtown Wichita, designated as zip code 67202: “The 67202 ZIP code had lost nearly 15 percent of its businesses and 20 percent of its employees in the decade ending in 2015, according to the U.S. Census’s County Business Pattern data. The loss of the State Office Building in 2016 and the Wichita school district’s downtown office this summer — employees are moving to the former Southeast High School — will make that decline steeper.” 1
Trends of business activity in downtown Wichita. Click for larger.In the first sentence, the reporter is correct. The trend in the number of business establishments, the number of employees, and the annual payroll is downwards. 2
But the second sentence reveals a misunderstanding of the meaning of two sets of Census Bureau data. According to the Census Bureau’s description of the County Business Pattern data — that’s the data referenced in the article — the two events mentioned will not change the CBP data. That’s because governmental agencies are not included in CPB data. The Census Bureau plainly explains:
“Statistics are available on business establishments at the U.S. level and by State, County, Metropolitan area, ZIP Code, and Congressional District Levels. … CBP covers most NAICS industries excluding crop and animal production; rail transportation; National Postal Service; pension, health, welfare, and vacation funds; trusts, estates, and agency accounts; private households; and public administration. CBP also excludes most establishments reporting government employees.” 3
LODES data for census block 201730043001036, showing 7,740 workers.A second set of Census Bureau data known as LODES will change with the departure of USD 259 from zip code 67202. LODES is the source of 26,000 downtown Wichita workers claimed by Wichita State University’s Center for Economic Development and Business Research, the Wichita Downtown Development Corporation, the Greater Wichita Partnership, the City of Wichita, and other agencies. An earlier Eagle article from May 10 just scratched the surface on this topic. 4 That article described the Census Bureau data as erroneous. But there is no error in the data, as the Census Bureau plainly explains what the data means. 5 The error was in the application of the data by someone who used it to represent something it does not represent.
Readers of the Wichita Eagle may be thoroughly confused by now. Can we expect a correction or explanation? The Eagle says no.
A research project by The Brookings Institution illustrates the performance of the Wichita-area economy.
Metro Monitor from The Brookings Institution rates metropolitan areas on several indicators. For this year’s report, the most recent data included is from 2015.
For this year’s report, the news for the Wichita area is mixed. For the period 2010 to 2015, Wichita ranks 88th in growth, 69th in prosperity, and 44th in inclusion. (The 100 largest metro areas were ranked.)
Looking at just the most recent years, 2014 to 2015, Wichita ranks 73rd in growth, 42nd in prosperity, and 9th in inclusion. That’s moving in the right direction. So perhaps there is hope for progress, in that the rankings for the most recent years are better than the rankings for the past five years.
There is good news in these numbers, too. Wichita does well in most measures of “Inclusion,” which Brookings describes: “Inclusion indicators measure how the benefits of growth and prosperity in a metropolitan economy — specifically, changes in employment and income — are distributed among individuals. Inclusive growth enables more people to invest in their skills and to purchase more goods and services. Thus, inclusive growth can increase human capital and raise aggregate demand, boosting prosperity and growth.”
Wichita’s productivity ranking is good, also.
Brookings computed a measure called “Metro area competitive shift.” It’s described as “The difference between the actual job growth and the expected job growth. It indicates whether the metro area overperformed or underperformed given its industrial structure.” For the period 2010 to 2015, Wichita scored -4.2 percent. For 2014 to 2015, the measure is -0.5 percent. Again, movement in the right direction.
Looking at more recent data gathered from the Bureau of Labor Statistics through April 2017, we see that at a time private sector employment in the entire nation is rising steadily, in Wichita (and Kansas) employment rose at a slower rate, and has been (roughly) level since 2016.
Looking forward, the employment situation may not improve, or improve only slowly. Recently Wichita State University’s Center for Economic Growth and Business Research revised its forecast downward: “Revised employment numbers showed that Wichita’s economic growth came to a screeching halt in October of 2016. Even though employment growth presumably stopped, there is lacking evidence that the slowed employment growth is systemic. Employment growth is expected to pick up marginally, but multiple headwinds could derail that growth.” 1
Other data from BLS that I’ve charted through the Federal Reserve Bank of St. Louis show that Wichita’s unemployment rate is going down, and so is the civilian labor force. Manufacturing employment is far below previous levels, and is on a slow downward trend. You may view the Wichita dashboard here. A similar dashboard for Kansas is here.


 For this year’s report, the news for the Wichita area is mixed. For the period 2010 to 2015, Wichita ranks 88th in growth, 69th in prosperity, and 44th in inclusion. (The 100 largest metro areas were ranked.)