Tag: Government spending
-

Pentagon Transformation: Hegseth Announces “Department of War” Overhaul at National War College
In a speech echoing Donald Rumsfeld’s words from September 10, 2001, Defense Secretary Pete Hegseth declared war on the Pentagon’s own bureaucracy – canceling the 300-day requirements process, collapsing 3-8 year acquisition timelines to under one year, and warning defense contractors to embrace “wartime speed” or be “gone.” The transformation renames the Department of Defense…
-
The $80 Billion Nuclear Bet: Understanding the Trump Administration’s Westinghouse Deal
The core question is not whether nuclear power has technical merit. Rather, it’s whether this particular arrangement represents sound policy or a costly mistake that mixes industrial policy with crony capitalism. Is this another step towards Trump’s version of state capitalism, or even outright socialism?
-

Fact-Checking Claims in the “One Big Beautiful Bill” (July 2025)
In July 2025, President Donald Trump and Republican leaders advanced a sweeping legislative package nicknamed the “One Big Beautiful Bill Act,” encompassing tax changes, immigration measures, and budget provisions. Supporters tout it as a historic boon for American taxpayers and security, while opponents warn of severe consequences. Below we examine several major claims related to…
-
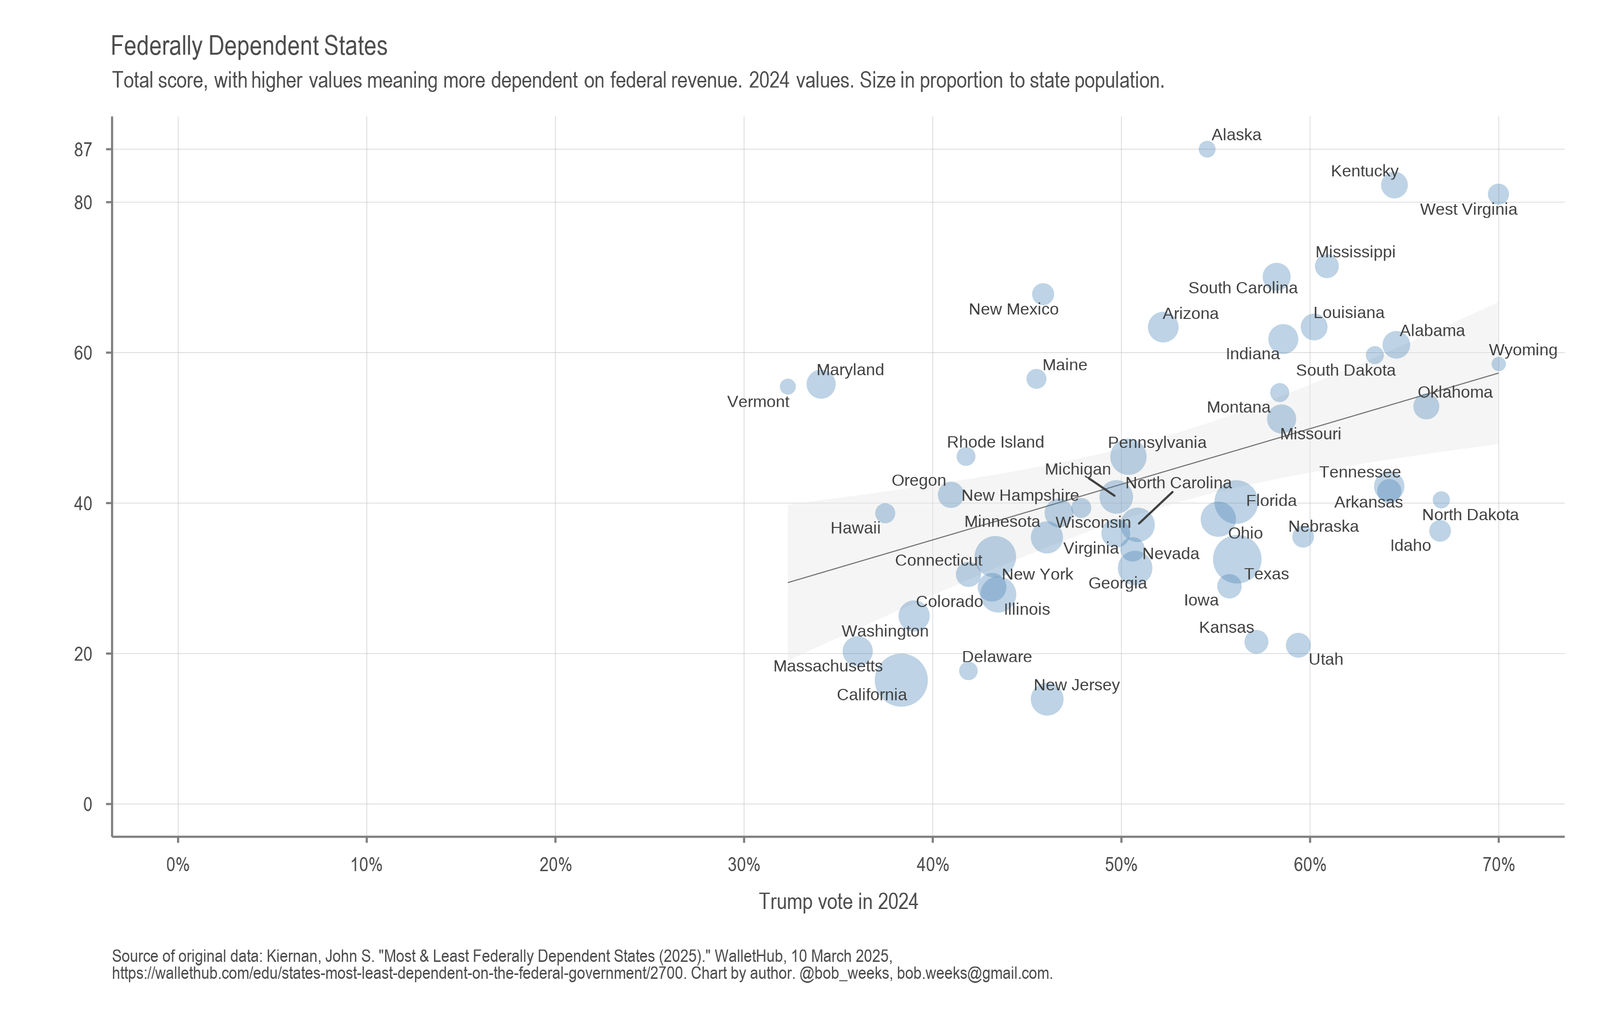
Federally Dependent States
Examining state political sentiment and dependence on federal government.
-
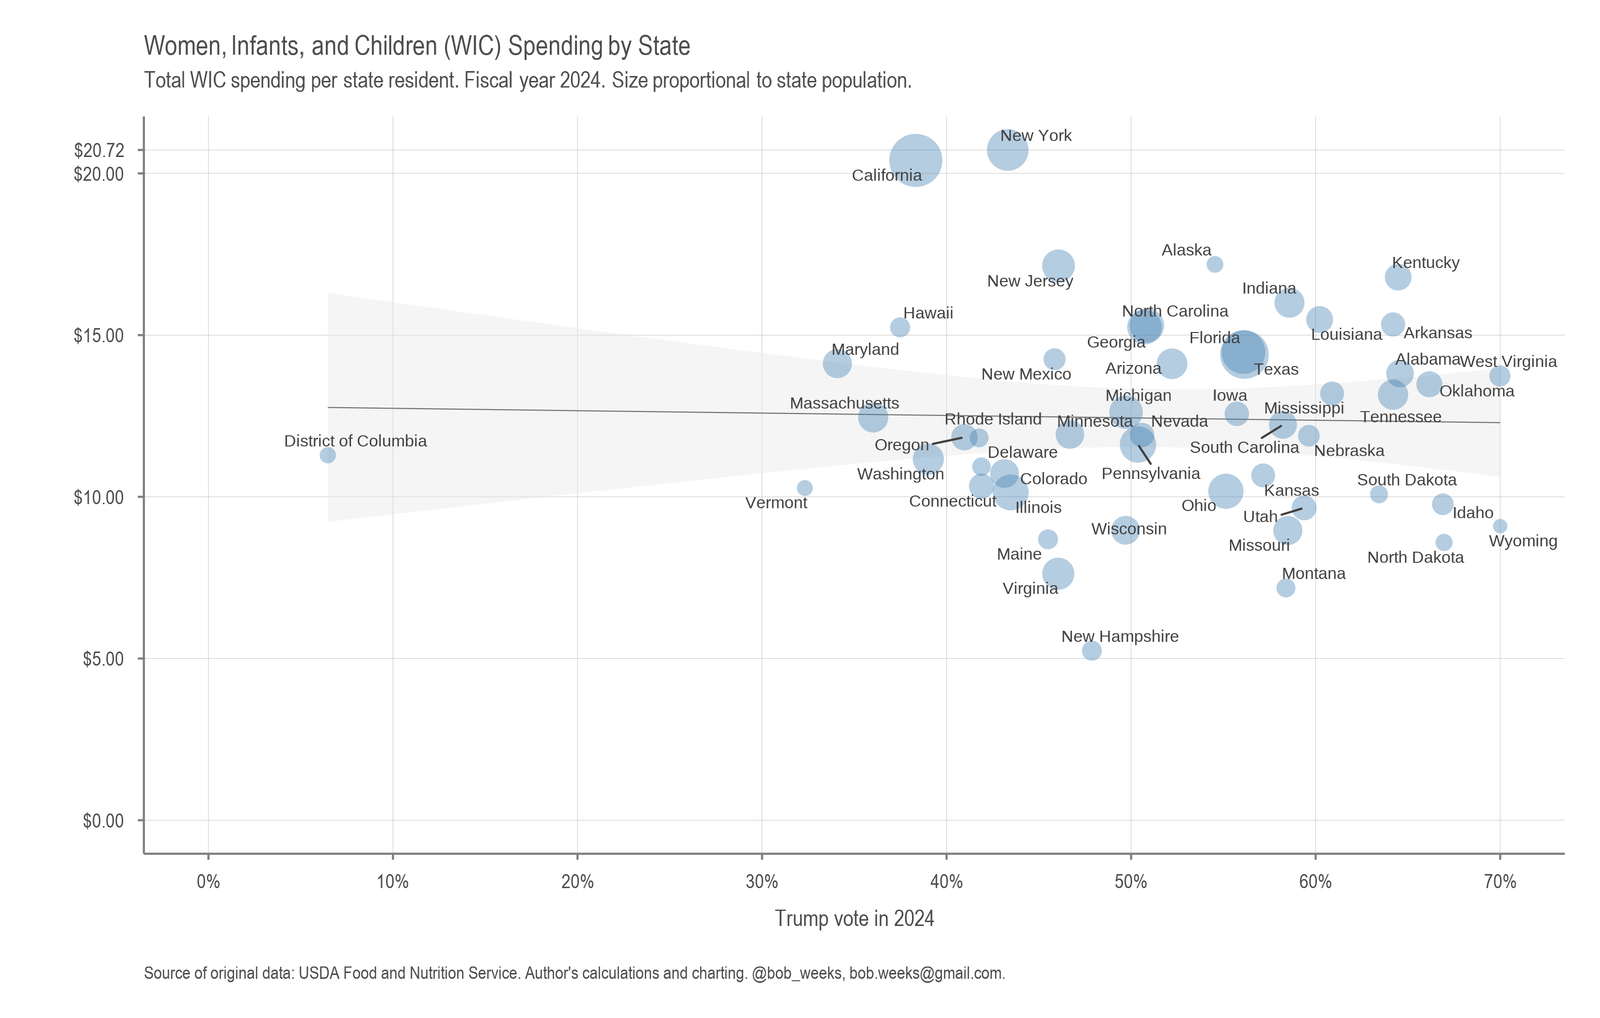
Women, Infants, and Children (WIC) Spending by State
Participation and spending on WIC by state political sentiment.
-
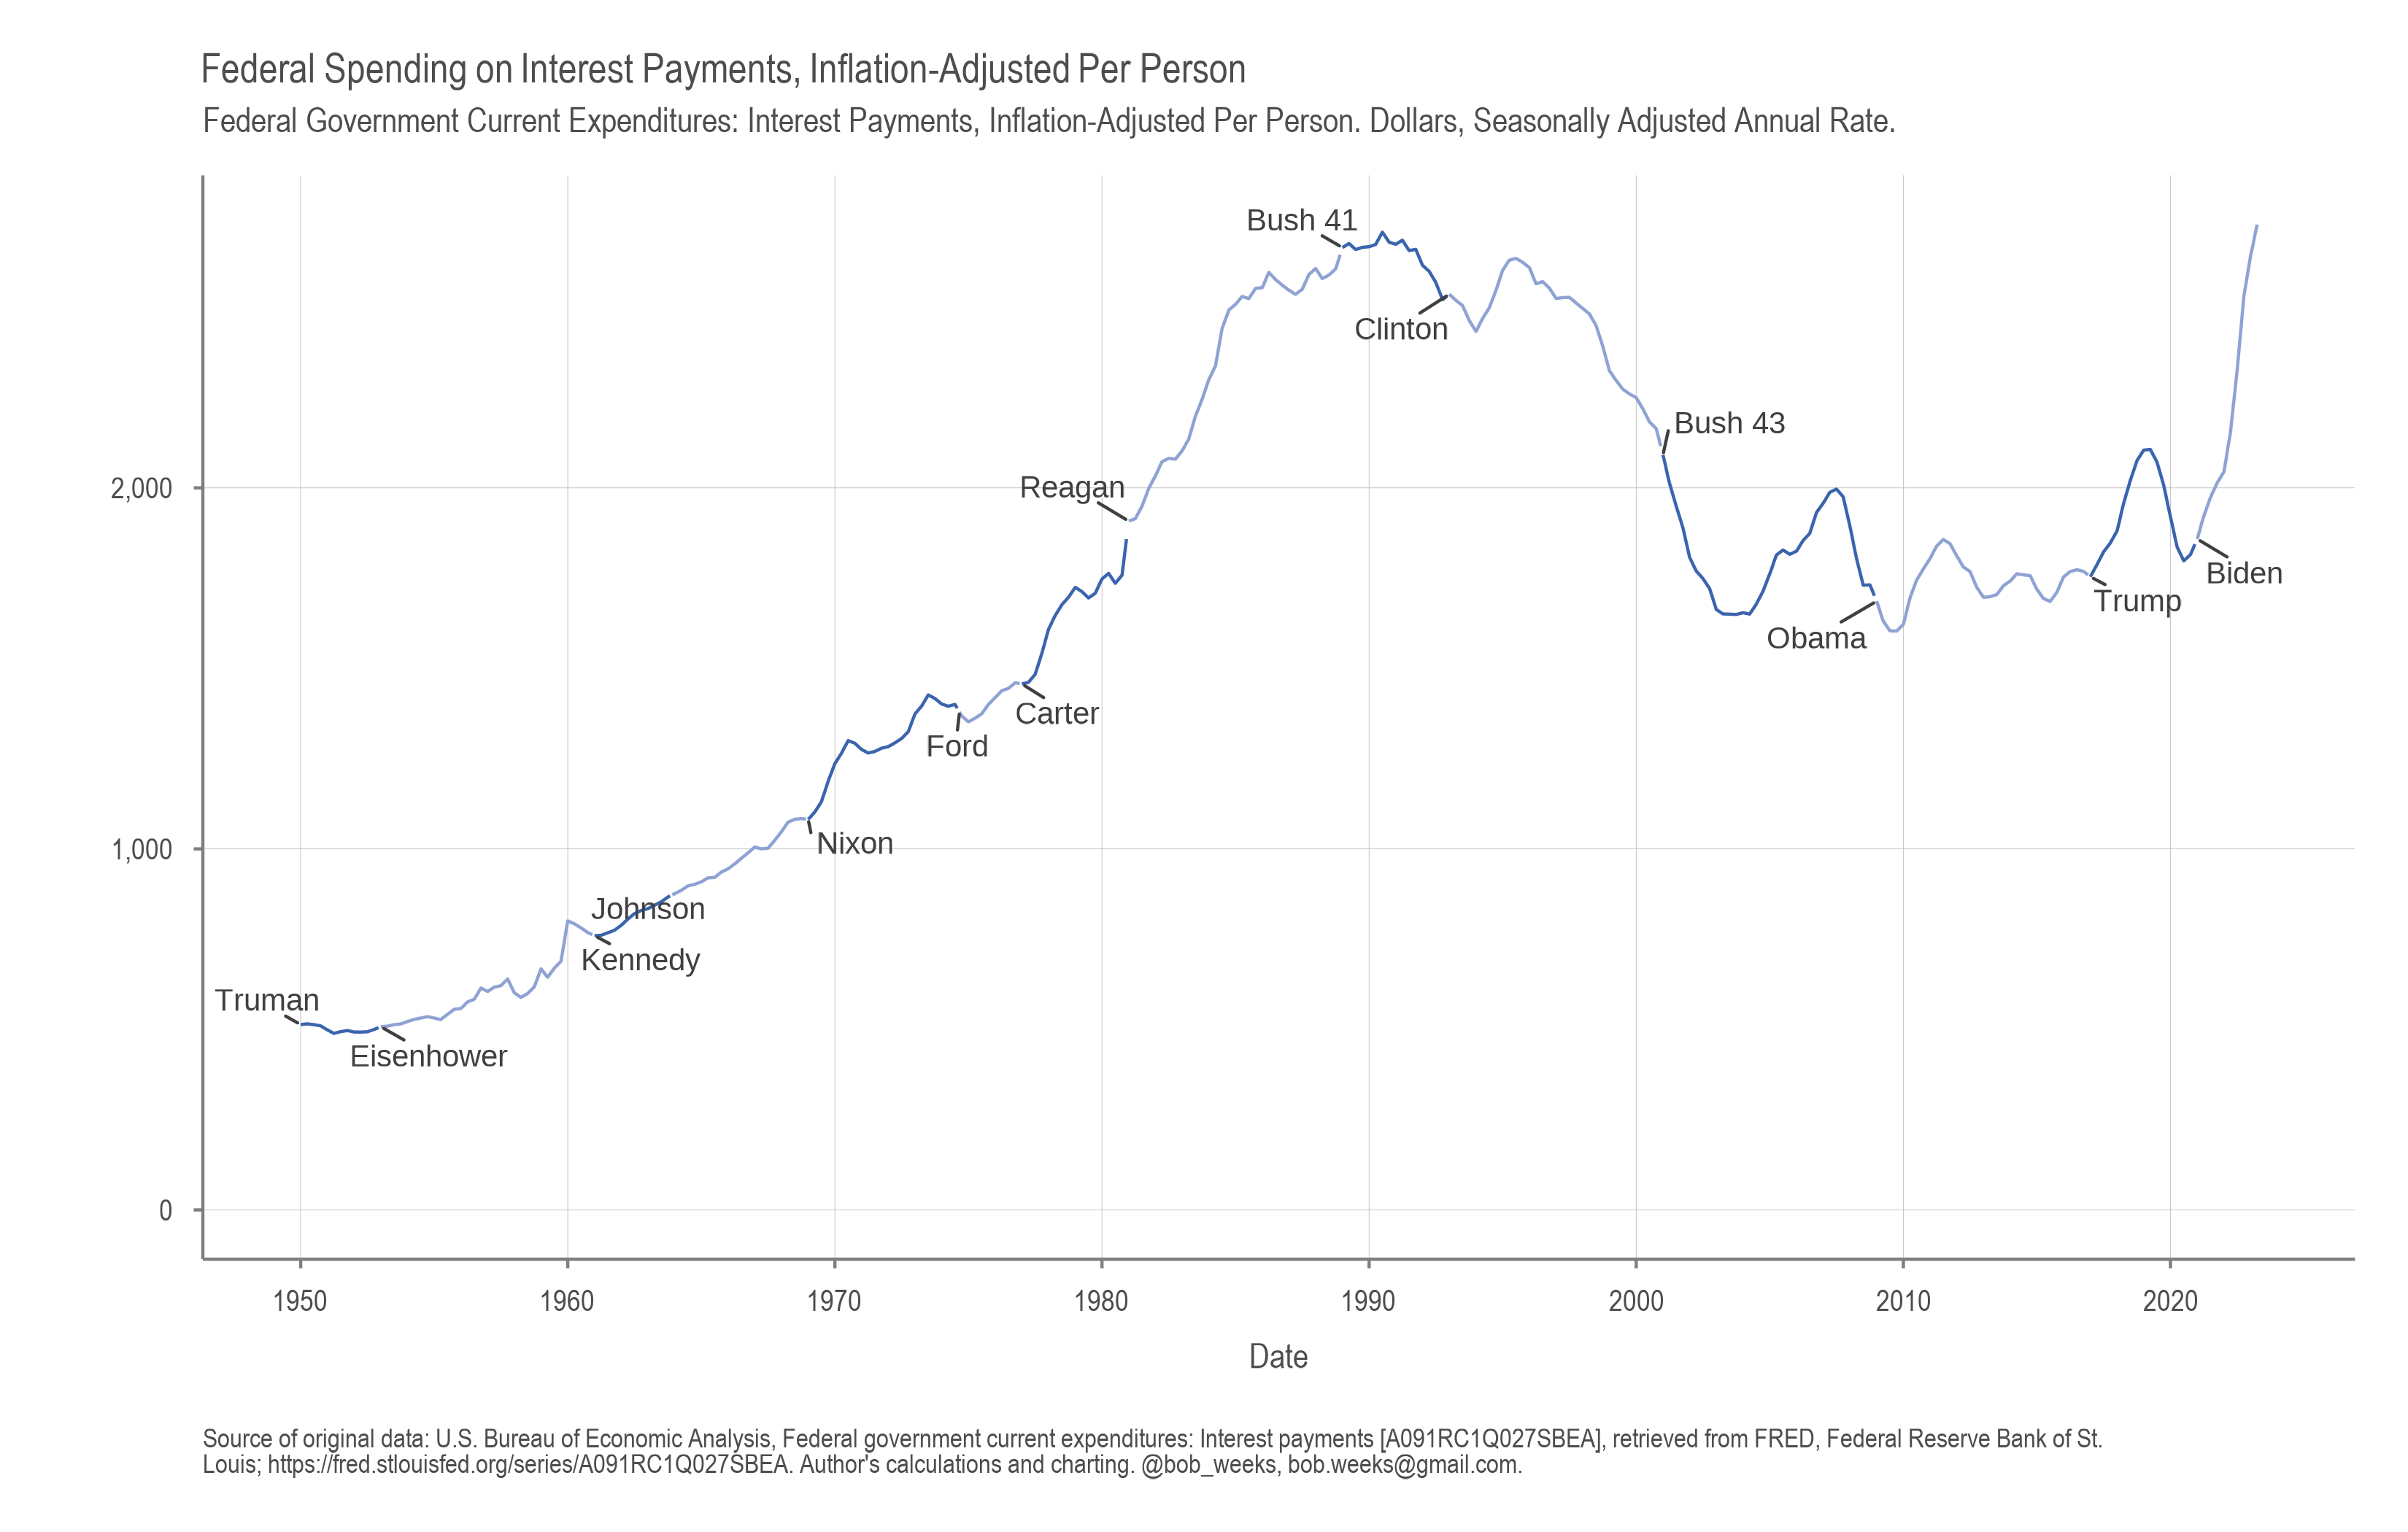
Federal Spending on Interest Payments, Inflation-Adjusted Per Person
-
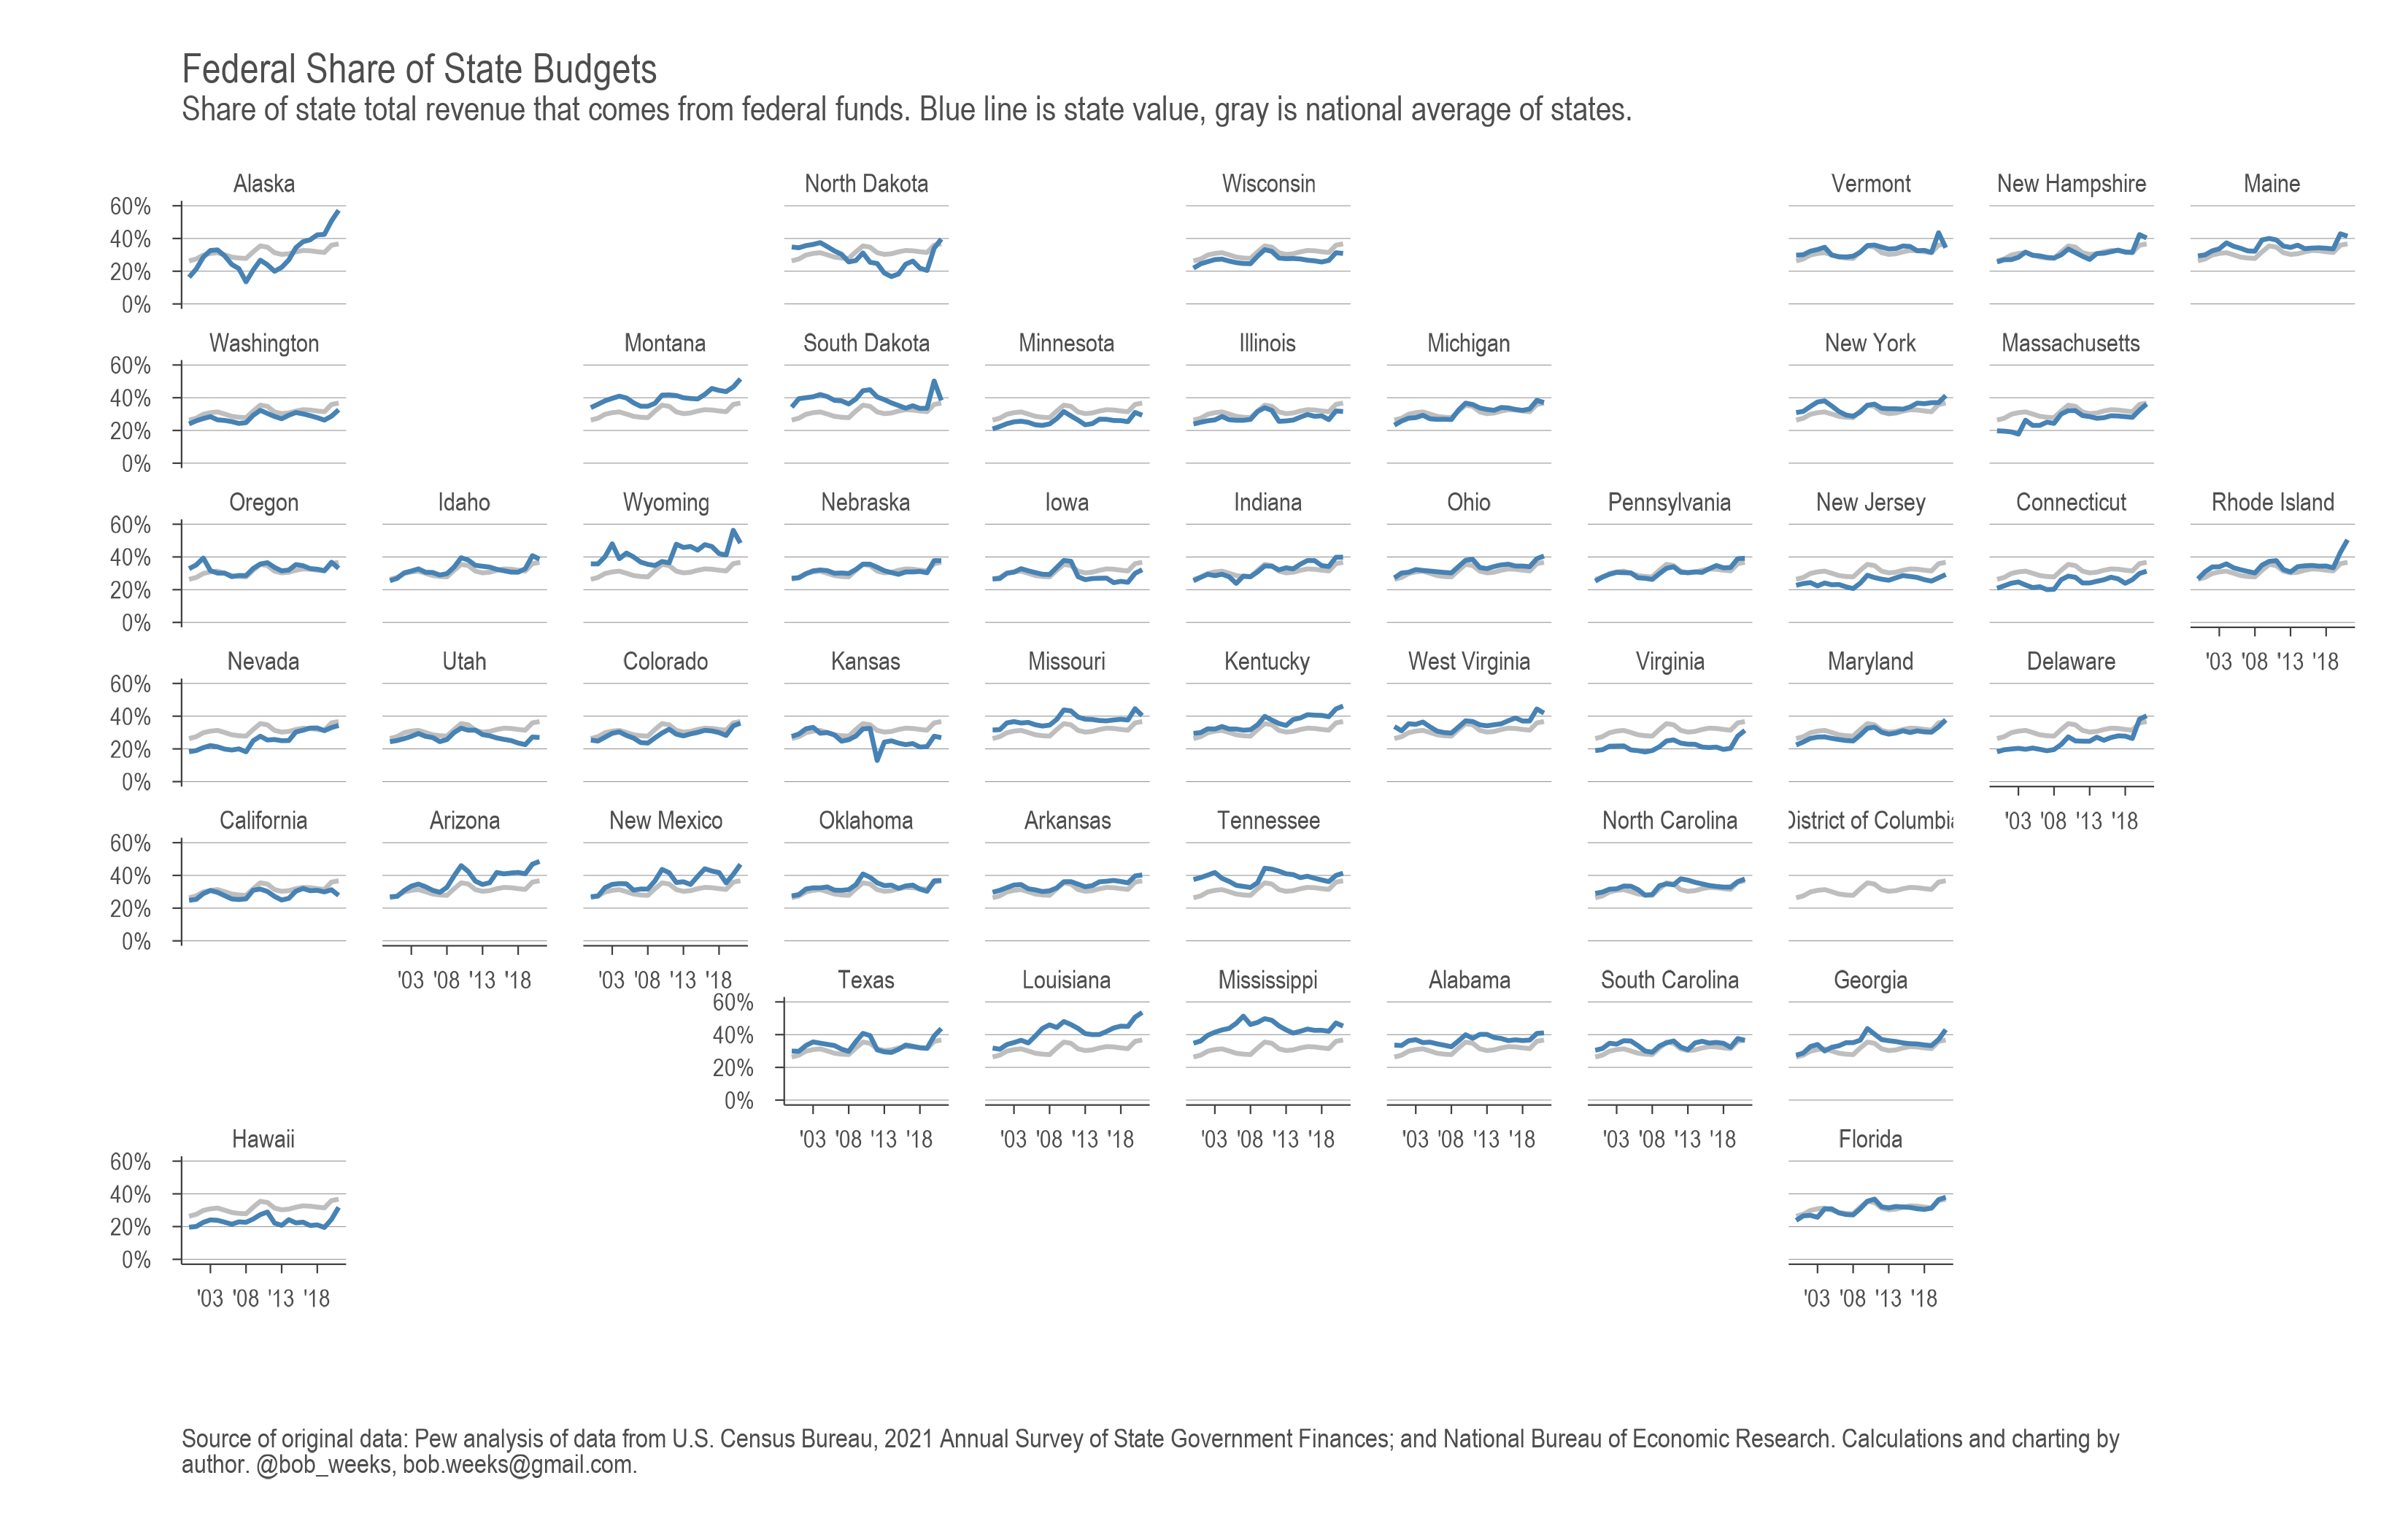
Federal Share of State Budgets
The share of state revenue from federal sources varies widely among states.
-
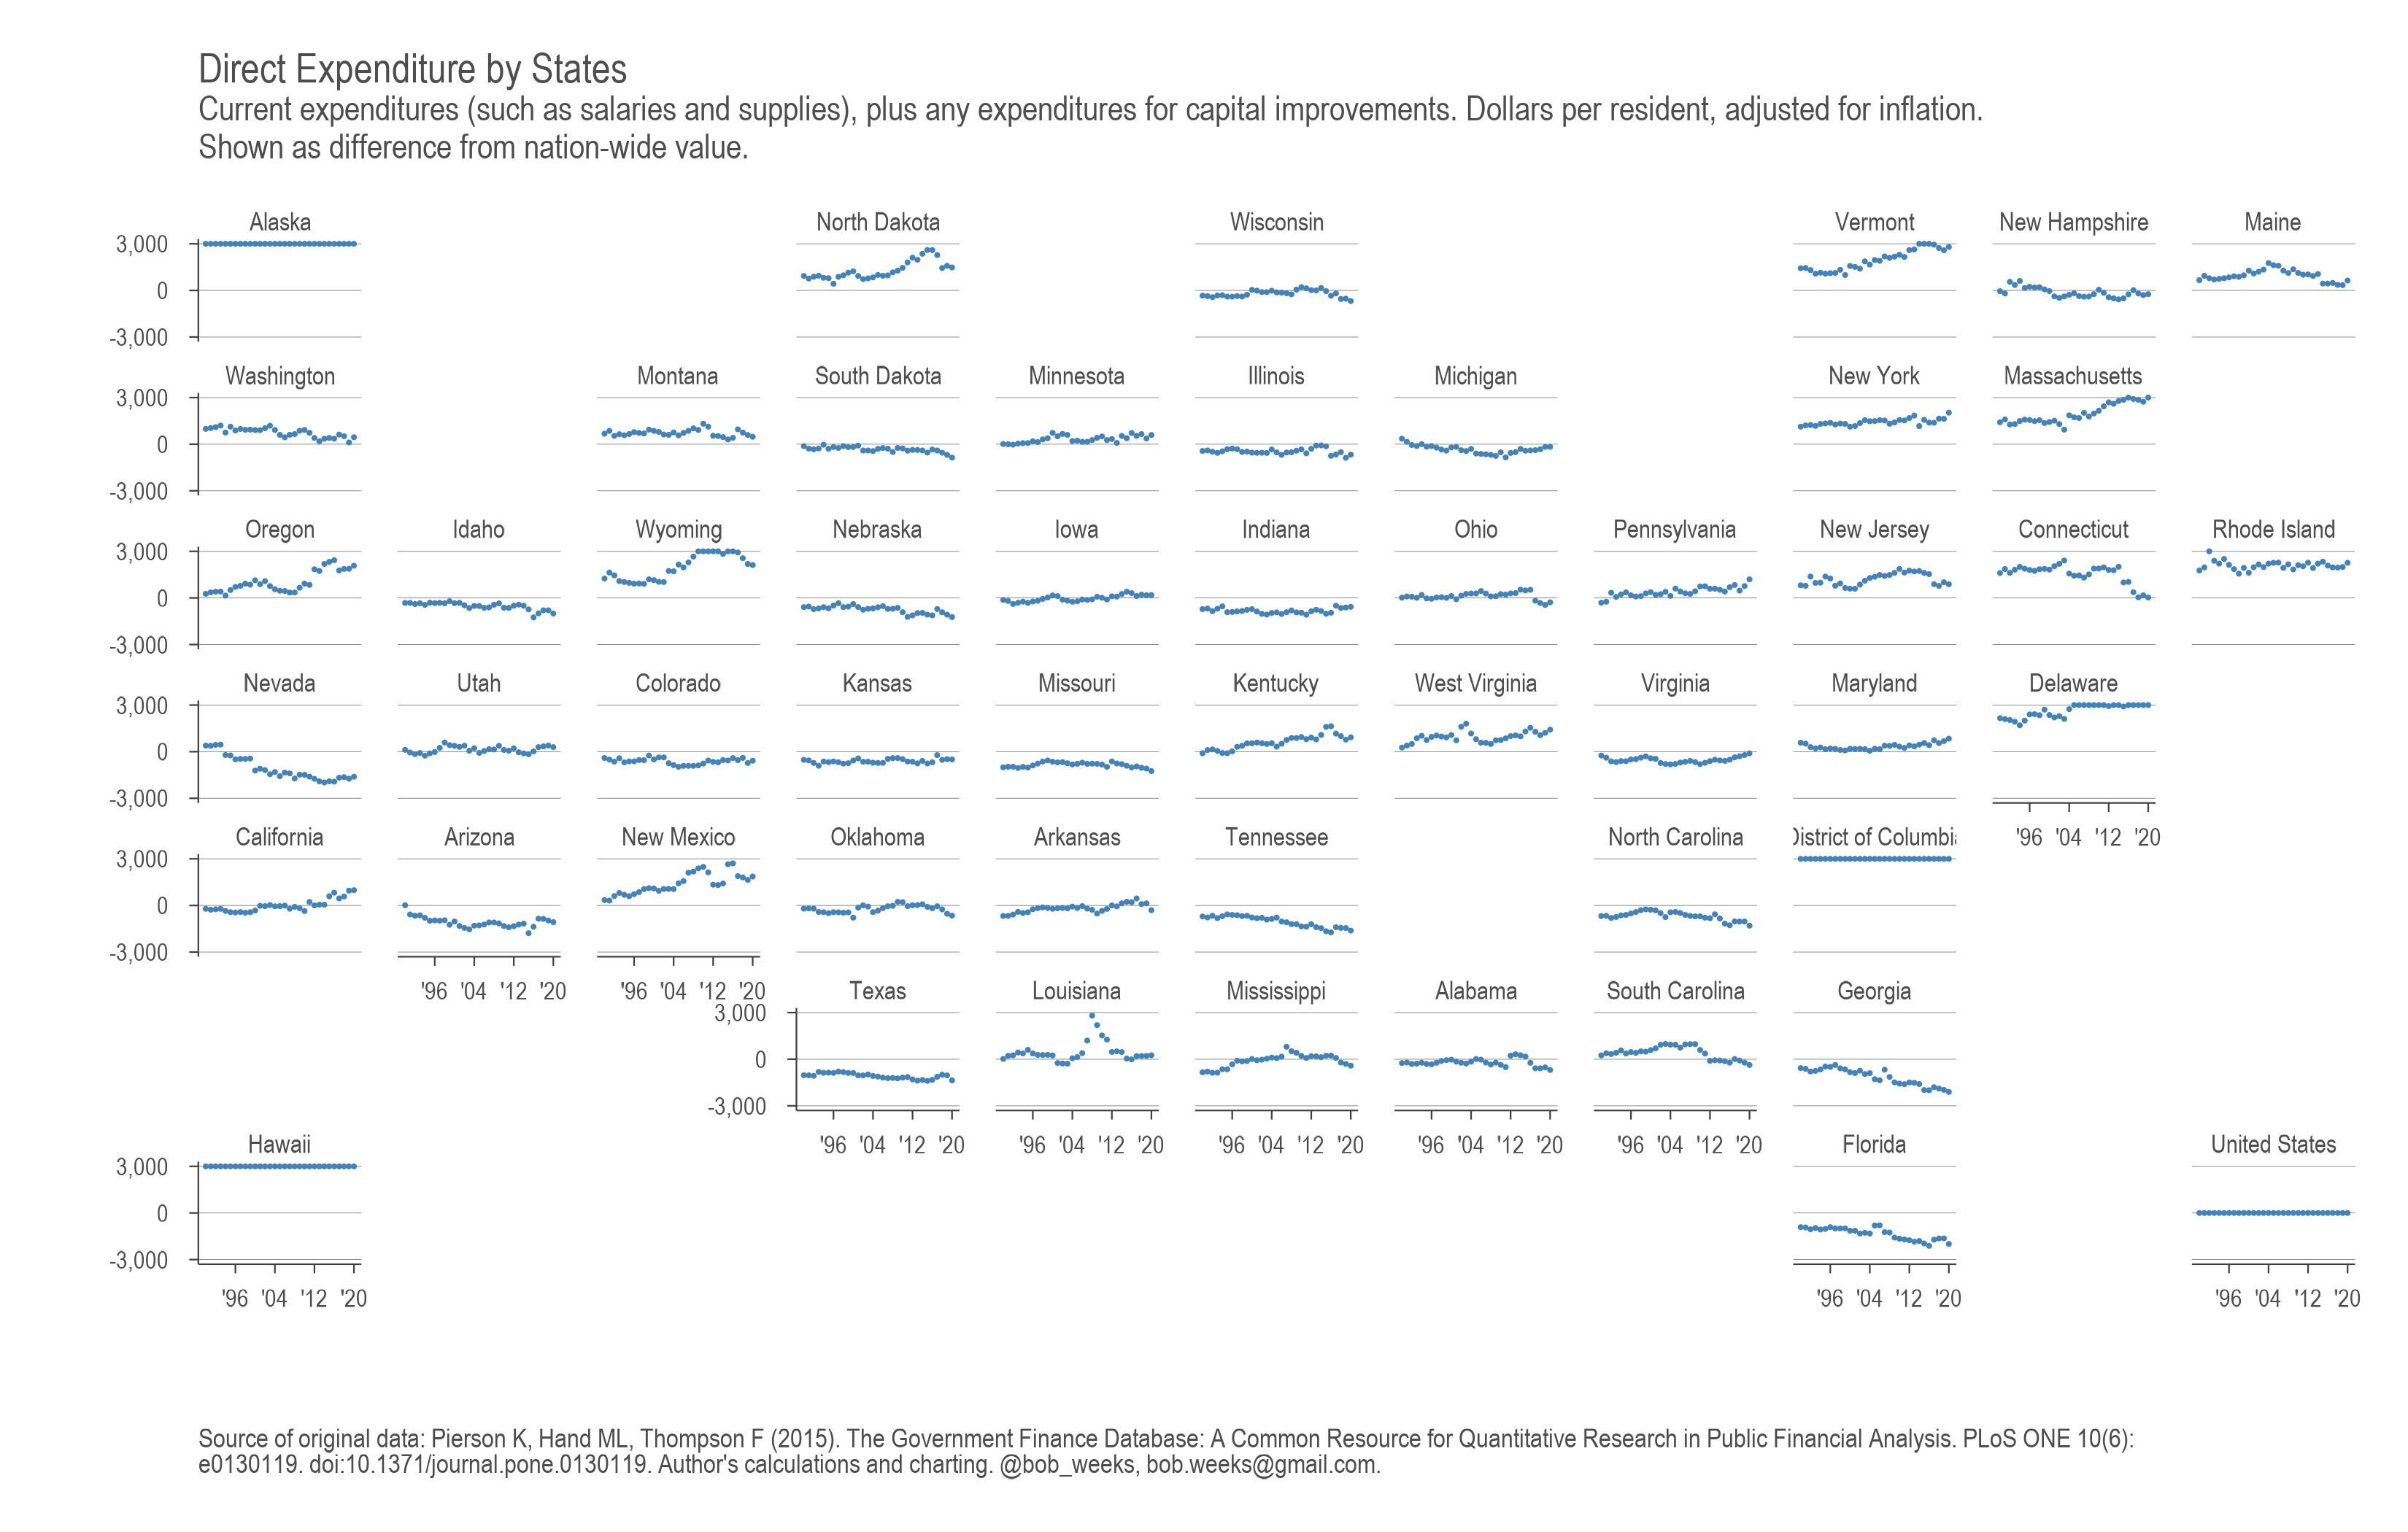
Direct Expenditure by States
Current expenditures (such as salaries and supplies), plus any expenditures for capital improvements. Dollars per resident, adjusted for inflation. Shown as difference from nation-wide value.
-
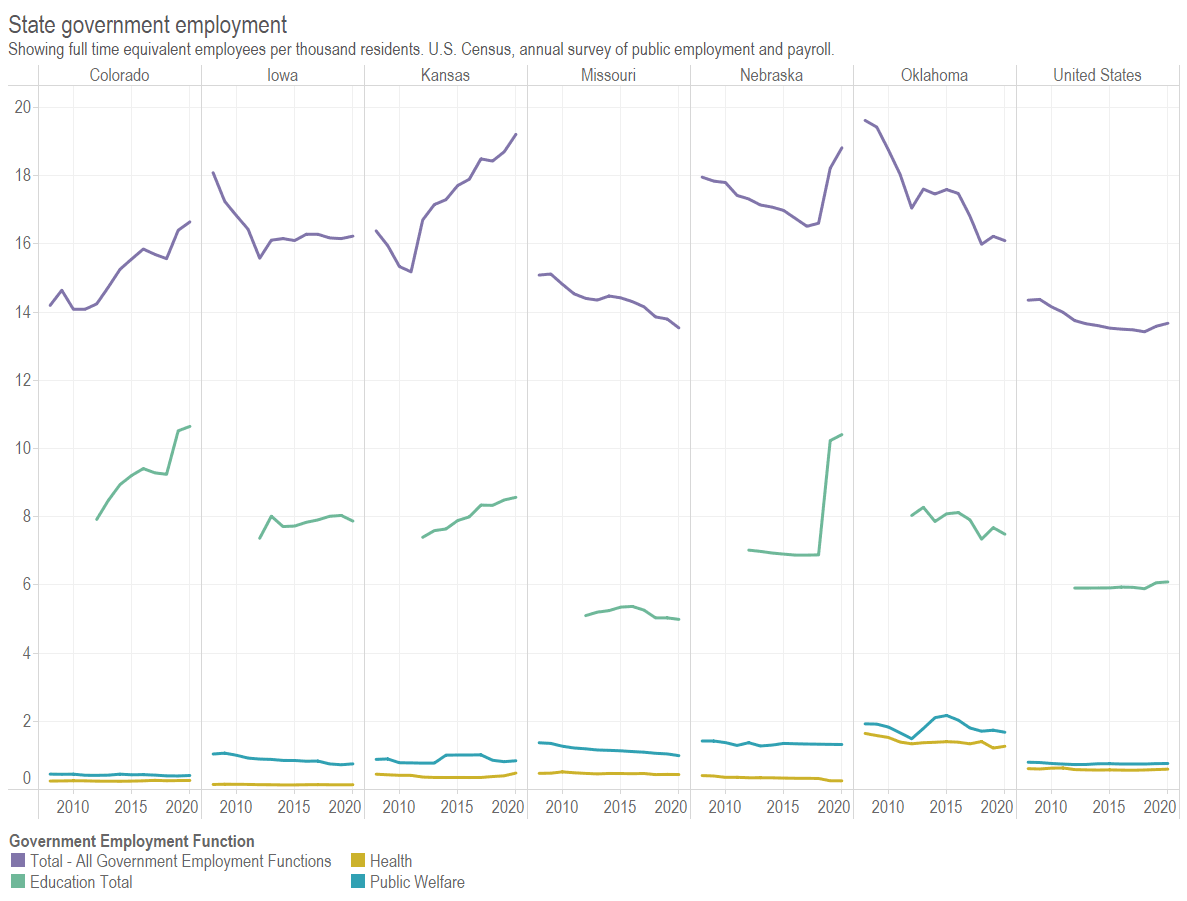
State government employees in Kansas
Kansas has more state government employees per resident than most states, and the trend is rising.
-

Kansas school spending
Kansas school district spending, updated through 2020 and adjusted for inflation.
-
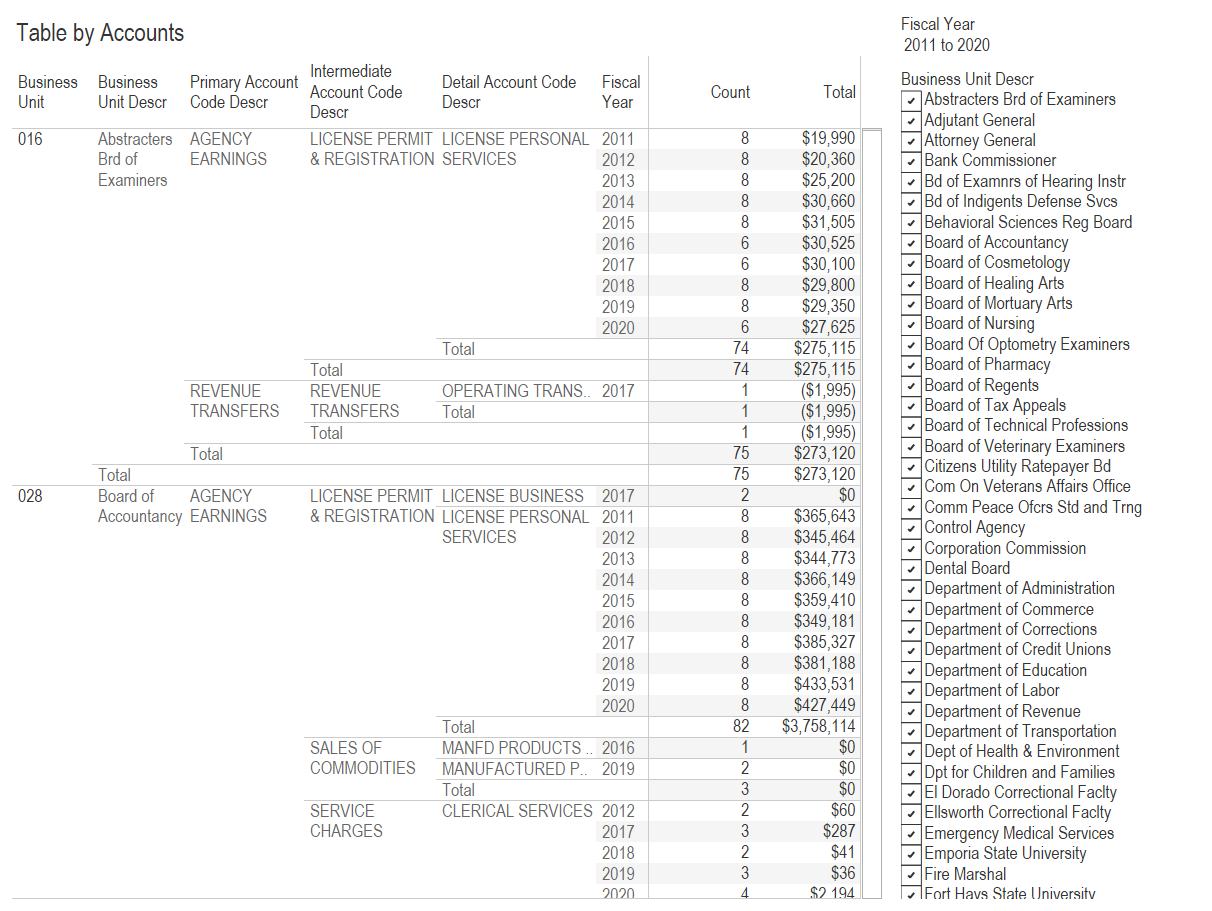
Kansas agency revenue
Data regarding State of Kansas agency revenue presented in an interactive visualization, with data through fiscal year 2020.
-
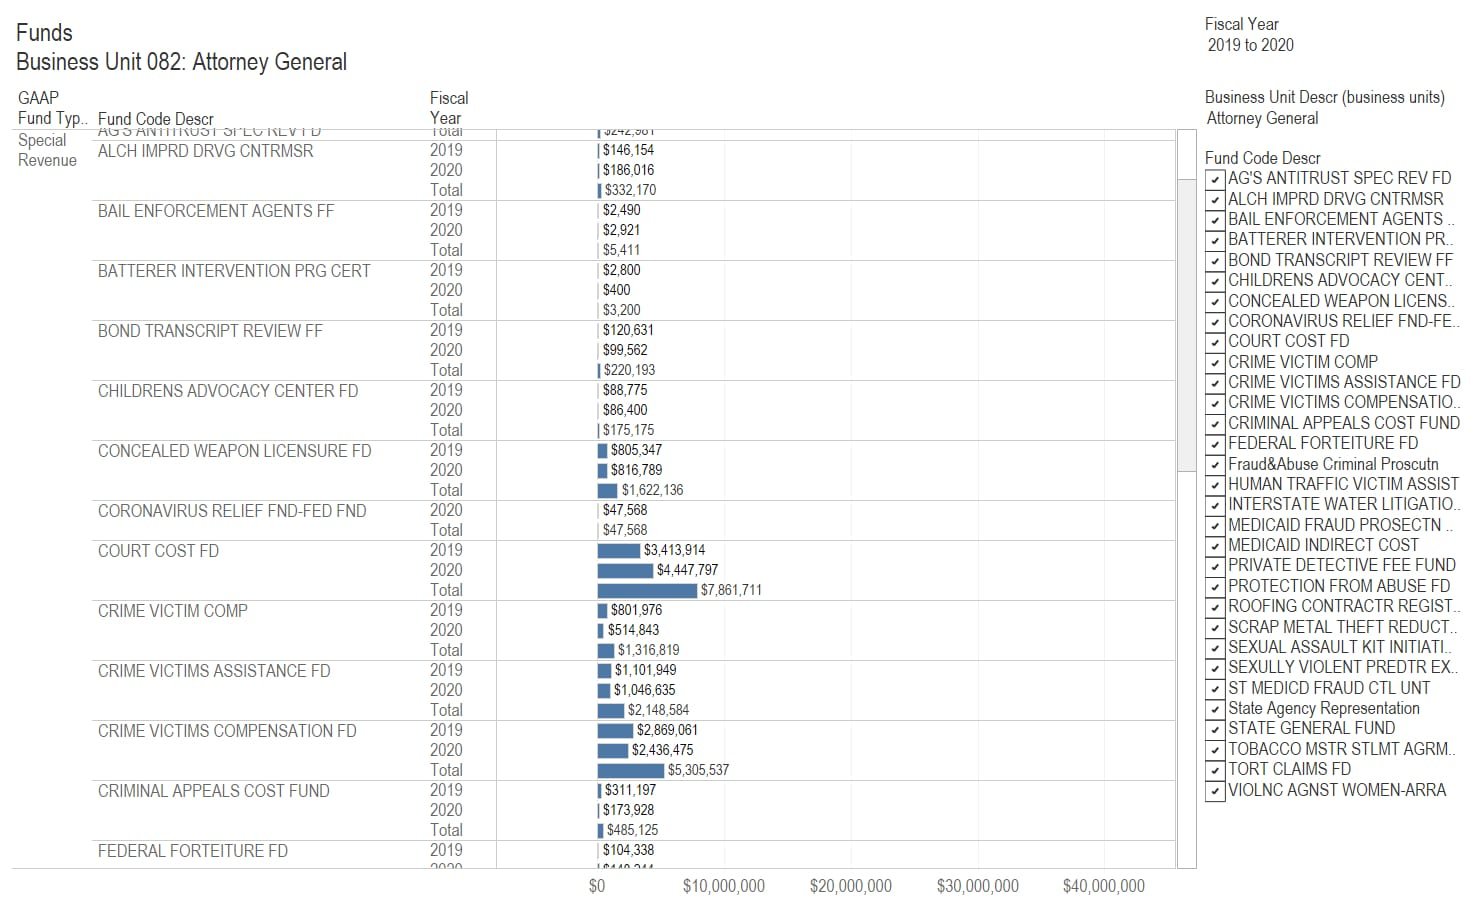
Kansas agency expenditures
Data regarding State of Kansas agency spending presented in an interactive visualization, with data through fiscal year 2020.