Tag: Featured
-

New metropolitan rankings regarding knowledge-based industries and entrepreneurship
New research provides insight into the Wichita metropolitan area economy and dynamism.
-
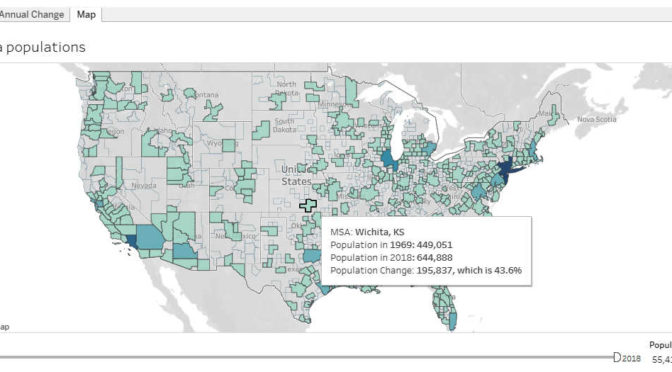
Updated: Metropolitan populations
A visualization of the population of metropolitan statistical areas, now with annual data from 1969 through 2018.
-

Wichita airport traffic
Traffic is rising at the Wichita airport. How does it compare to others?
-

Updated: Populations of the states
An interactive table and charts of populations in the states and regions, from 1929 through 2018.
-
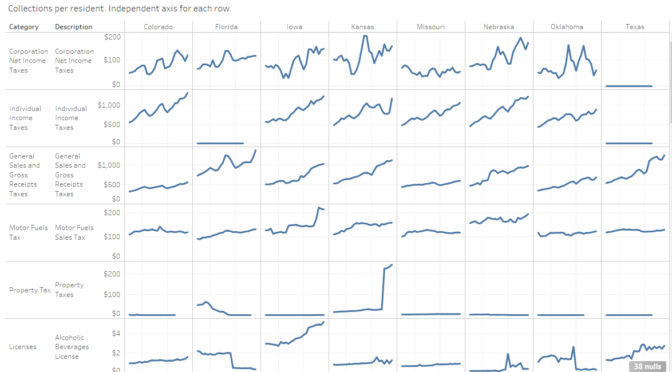
Updated: State government tax collections
Kansas personal income tax collections rose by $372 per person in 2018, an increase of 46.5 percent.
-
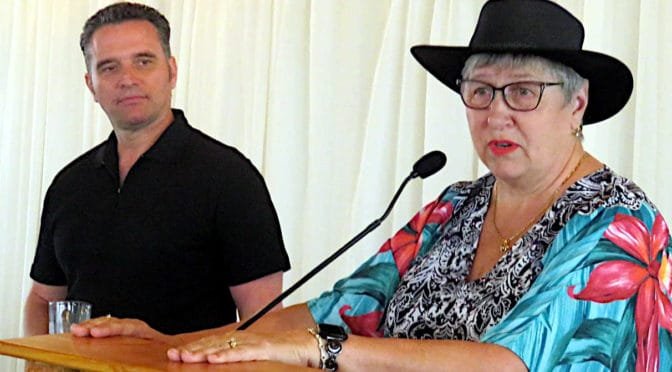
From Pachyderm: Kansas legislative wrap up
From the Wichita Pachyderm Club, a legislative wrap up featuring Representative Brenda Landwehr and Senator Ty Masterson. This was recorded May 31, 2019.
-

Naftzger Park, according to Wichita Mayor Jeff Longwell
He had an opportunity to learn the true history of Naftzger Park in downtown Wichita. But Mayor Jeff Longwell didn’t learn, or maybe he doesn’t care.
-
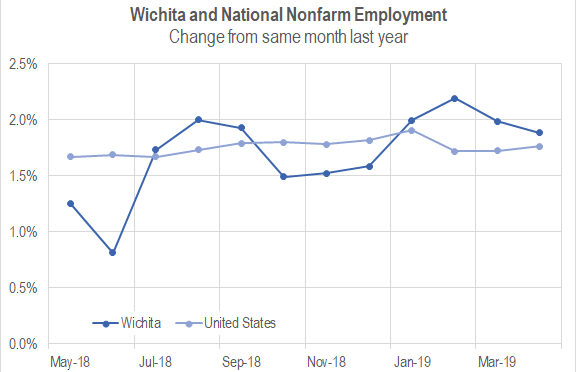
Wichita jobs and employment, April 2019
For the Wichita metropolitan area in April 2019, the labor force is up, the number of unemployed persons is down, the unemployment rate is down, and the number of people working is up when compared to the same month one year ago. Seasonal data shows small declines in labor force and jobs from March.
-
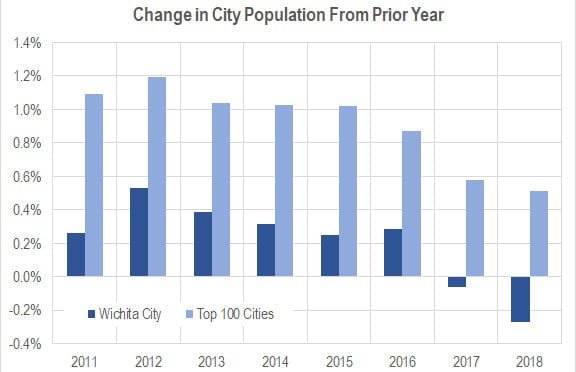
Wichita population, 2018
The City of Wichita lost 1,052 in population from 2017 to 2018, a decline of 0.27 percent.
-

Sedgwick County job growth continues strong pace
In the fourth quarter of 2018, Sedgwick County continued strong job growth.
-

What could be done with WaterWalk
There is an opportunity for Wichita to break the logjam holding up development at WaterWalk.
-
King of Freight move a step sideways
A Wichita firm plans to move its offices to what was billed as the city’s premier entertainment district.