Tag: Featured
-

Kansas sees large drop in test scores
Using demographically-adjusted scores, Kansas falls in state rankings of National Assessment of Educational Progress (NAEP).
-

Longwell: ‘There is no corruption’
Wichita Mayor Jeff Longwell says there is no corruption involving him, but this is only because of loose and sloppy Kansas and Wichita laws.
-

From Pachyderm: Save Century II
From the Wichita Pachyderm Club: Speakers promoting the saving of the Century II convention and performing arts center in downtown Wichita.
-

Questions for Mayor Jeff Longwell
Wichita Mayor Jeff Longwell urges Wichitans to reach out to him with questions through email and social media.
-
Wichita jobs and employment, September 2019
For the Wichita metropolitan area in September 2019, the labor force is up, the number of unemployed persons is down, the unemployment rate is down, and the number of people working is up when compared to the same month one year ago. Seasonal data shows small increases in labor force and jobs from August.
-
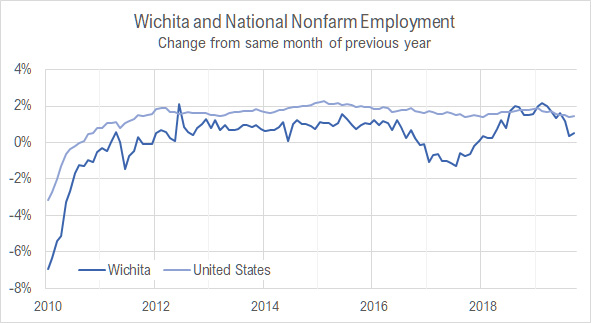
The cause of the low unemployment rate in Wichita
The unemployment rate for Wichita and the nation is nearly equal over the last eight years. Job growth for Wichita, however, has been much slower than the nation, and the labor force for Wichita is actually smaller than in January 2011. This is what has led to a low unemployment rate in Wichita: Slow job…
-

Wichita jobs and momentum
Given recent data and the CEDBR forecasts, Wichita’s momentum is a slowly growing economy, with the rate of growth declining.
-

From Pachyderm: Dr. Amy Bragg Carey, President of Friends University
From the Wichita Pachyderm Club: Dr. Amy Bragg Carey, President of Friends University. Her topic was “The Role of Friends University in Our Community.” This audio presentation or podcast was recorded on October 25, 2019.
-

From Pachyderm: Alan Cobb, Kansas Chamber of Commerce
From the Wichita Pachyderm Club: Alan Cobb, President and Chief Executive officer, Kansas Chamber of Commerce.
-

State and local government employees and payroll
Looking at the number of government employees in proportion to population, Kansas has many compared to other states, and especially so in education.
-

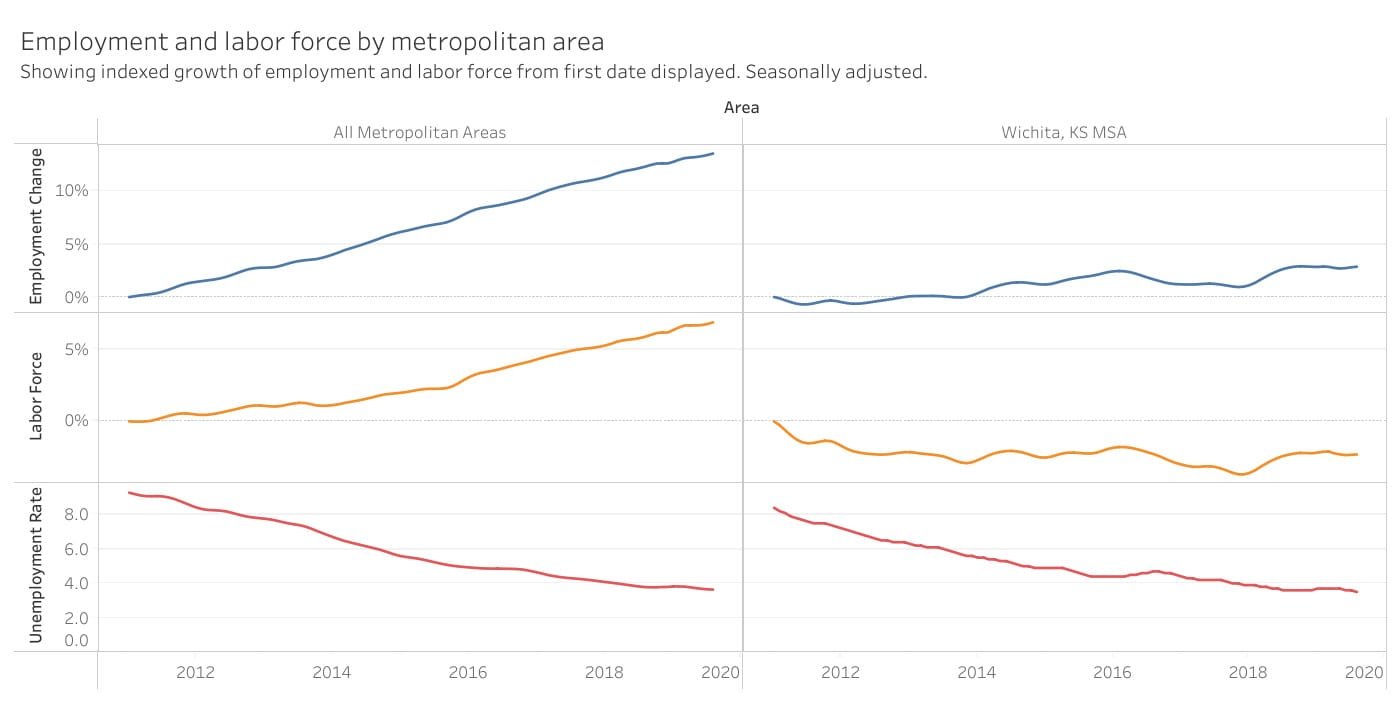
Looking at jobs in Wichita
Examining job creation in Wichita as compared to the state and the nation.
-

Checking a Jeff Longwell for Mayor political ad
An ad from the Jeff Longwell for Mayor Committee contains a false claim.