Tag: Featured

  • Updated: Economic indicators in the states

    Updated: Economic indicators in the states

    Economic indicators in the states, an interactive visualization.

    The Federal Reserve Bank of Philadelphia calculates two indexes that track and forecast economic activity in the states and the country as a whole.

    The coincident index is a measure of current and past economic activity for each state. The leading index predicts the six-month growth rate of the state’s coincident index. Positive values mean the coincident index is expected to rise in the future six months, while negative values mean it is expected to fall. (For more detail, see Visualization: Economic indicators in the states.)

    In the coincident index, the effects of the response to the pandemic are evident. Before the pandemic, the coincident index for Kansas was growing at about the same rate as the nation.

    The coincident index is available through July 2020, while the leading index is available through February. I was not able to learn why the leading index has not been updated.

    A nearby chart shows index values for the last five years for Kansas, some nearby states, and the United States. You can access the visualization and create your own charts here: Visualization: Economic indicators in the states.

    Example from the visualization. Click for larger.
    Example from the visualization, ending before the pandemic. Click for larger.
  • Kansas jobs, July 2020

    Kansas jobs, July 2020

    The employment situation in Kansas continued to improve in July 2020 as the response to the pandemic continued to affect the economy.

    Data released today from the Bureau of Labor Statistics, part of the United States Department of Labor, shows the effect of the pandemic and the response to it on employment in Kansas for July 2020.

    (Click charts and tables for larger versions.)

    Using seasonally adjusted data, from June 2020 to July 2020, nonfarm employment in Kansas rose by 8,188 (0.6 percent). Over the year, the number of Kansas nonfarm jobs for July 2020 was lower by 68,000 (4.8 percent) over the same month last year. This is using seasonally adjusted data. The non-adjusted figure is 65,500 fewer jobs (4.7 percent).

    Over the year (July 2019 to July 2020), the Kansas labor force is down by 4,763 (0.3 percent) using seasonally adjusted data, with an increase of 8,188 (0.6 percent) over the last month. Non-seasonal data shows a rise of 5,498 (0.4 percent) in the labor force over the year.

    Of note: While the number of jobs and working people rose by large amounts in July, both are smaller than before the response to the pandemic.

    The number of unemployed persons fell from June 2020 to July 2020 by 4,015 (3.6 percent). The unemployment rate was 7.2 percent in July, up 4.1 percentage points from one year ago, and down 0.3 percentage points from last month.

    Comparing Kansas to the nation: Using seasonal data, the number of Kansas nonfarm jobs is 4.78 percent lower than 12 months ago, while nationally, the same statistic is 7.53 percent lower. Non-seasonal data shows the number of Kansas nonfarm jobs is 4.66 percent lower than 12 months ago, while nationally, the same statistic is 7.70 percent lower.

    Click charts and tables for larger versions.

    In the following chart showing job changes from the previous month, the magnitude of the changes in April through July overwhelms the other months. The rise in July employment is smaller than the rise in May and June.

    In the following chart of job levels from the same month one year ago, the July figures show the loss of jobs becoming less pronounced, a trend that has lasted three months.

    The June release contained figures for industry groups. The following chart shows the number of employees in July 2019 and July 2020.

    This chart uses the same data, showing the percent change from July 2019. The Leisure and hospitality category is still the lowest, proportionally, followed by Mining and logging. Construction showed the smallest proportional loss.

  • Airport traffic statistics, 2019

    Airport traffic statistics, 2019

    Airport traffic data presented in an interactive visualization, updated through 2019.

    This visualization holds data from TranStats, a service of the Bureau of Transportation Statistics (BTS), which is the independent statistical agency within the United States Department of Transportation (DOT). While monthly data is available, this visualization holds annual totals.

    The nearby example shows data starting in 2010 for the nation and Wichita. The visualization holds data for all U.S. airports with scheduled flights.

    A few observations regarding Wichita airport traffic as compared to the nation:

    • Since 2014, passenger traffic (departing passengers) at the Wichita airport is higher, but traffic for the nation as a whole is much higher, although the rate of increase for Wichita is rising.
    • The number of scheduled departures has been declining in Wichita until 2019, when there was a slight increase
    • The number of available seats on departing flights from Wichita has been mostly level until an increase in 2019.
    • Load factor for Wichita and the nation has been rising.

    To view and use the interactive visualization, click here.

    Example from the visualization, showing Wichita compared to all airports. Click for larger.
  • Wichita property tax on commercial property: High

    Wichita property tax on commercial property: High

    An ongoing study reports that property taxes on commercial and industrial property in Wichita are high. In particular, taxes on commercial property in Wichita are among the highest in the nation.

    Click for larger.

    The study is produced by Lincoln Institute of Land Policy and Minnesota Center for Fiscal Excellence. It’s titled “50 State Property Tax Comparison Study” and may be read here. It uses a variety of residential, apartment, commercial, and industrial property scenarios to analyze the nature of property taxation across the country. I’ve gathered data from selected tables for Wichita.

    In Kansas, residential property is assessed at 11.5 percent of its appraised value. Commercial property is assessed at 25 percent of appraised value, and public utility property at 33 percent. (Appraised value is the market value as determined by the assessor. Assessed value is multiplied by the mill levy rates of taxing jurisdictions to compute tax.)

    This means that commercial property faces 2.104 times the property tax rate as residential property, according to this study. (1)The ratio of 25 to 11.5 is 2.174, so some small factors have a role. The U.S. average is 1.713. Whether higher assessment ratios on commercial property as compared to residential property is desirable public policy is a subject for debate. But because Wichita’s ratio is high, it leads to high property taxes on commercial property.

    For residential property taxes, Wichita ranks below the national average. For a property valued at $150,000, the effective property tax rate in Wichita is 1.19 percent, while the national average is 1.34 percent. The results for a $300,000 property were similar.

    Of note is the property taxes on a median-valued home. In this case, Wichita is a bargain, due to our lower housing prices. A home at the median value in Wichita pays $1,655 in taxes, while the nationwide average is $4,562. (The median home value in Wichita is $139,800 and for the nation, $326,392, according to this report.)

    Looking at commercial property, Wichita taxes are high. For example, for a $100,000 valued property, the study found that the national average for property tax is $2,206 or 1.84 percent of the property value. For Wichita the corresponding values are $3,229 or 2.69 percent, ranking seventh-highest among the 50 largest cities. Wichita property taxes are 46 percent higher than the national average, for this scenario.

    For industrial property taxes, the situation in Wichita is better, with Wichita ranking near the middle of the 50 largest cities. For an industrial property worth $1,000,000, taxes in Wichita are $29,372. The national average is $30,498.

    References

    References
    1The ratio of 25 to 11.5 is 2.174, so some small factors have a role.

  • Wichita aerospace manufacturing concentration

    Wichita aerospace manufacturing concentration

    Wichita leaders want to diversify the area economy. Has there been progress?

    In the wake of layoffs at Textron Aviation and Spirit Aerosystems, Wichita’s leaders shifted their attention to the need to diversify the Wichita metropolitan area economy. This has been a recognized need for a long time. 1

    Recently the Wichita Eagle published an article addressing this matter. 2 It did not, however, cite any statistics that measure the diversity — or lack of — in the Wichita economy.

    One way to measure the concentration of an industry in a location is by the proportion of employment in that industry. The Bureau of Labor Statistics provides the number of employees by industry for metropolitan areas. I’ve gathered the data for the Wichita MSA for two industries: Aerospace Product and Parts Manufacturing (NAICS code 3364) and all manufacturing. I compare it to total private sector employment. This data is not adjusted for seasonality, as some are available only in that manner. Data is through June 2020.

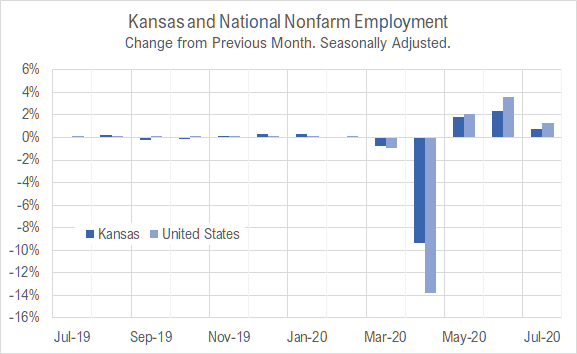
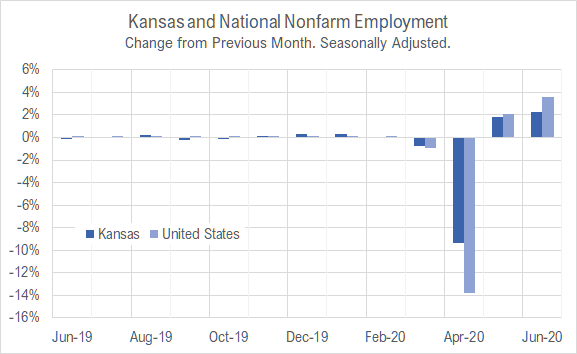
    First, note the effects on employment due to the response to the pandemic.

    Here are the employment ratios.


    As the charts illustrate, there was a large downward shift in the two industry’s share of employment around the time of the Great Recession. Since then, the ratios have been more stable, with a slow decline until a small reversal of that trend over the last two years until the effects of the pandemic. That caused the ratios of employment in manufacturing to fall.

    The charts of employment ratio changes from the same month one year ago confirms: Manufacturing and aerospace employment has grown faster than total private employment for the last two years or so, until the pandemic.


    Another way to measure the concentration of industry is through location quotients. The Bureau of Labor Statistics provides these, most notably for counties as part of the Quarterly of Census and Wages. 3 As described by BLS, “Location quotients are useful for studying the composition of jobs in an area relative to the average, or for finding areas that have high concentrations of jobs in certain occupations. As measured here, a location quotient shows the occupation’s share of an area’s employment relative to the national average.” 4

    Further: “For example, a location quotient of 2.0 indicates that an occupation accounts for twice the share of employment in the area than it does nationally, and a location quotient of 0.5 indicates the area’s share of employment in the occupation is half the national share.”

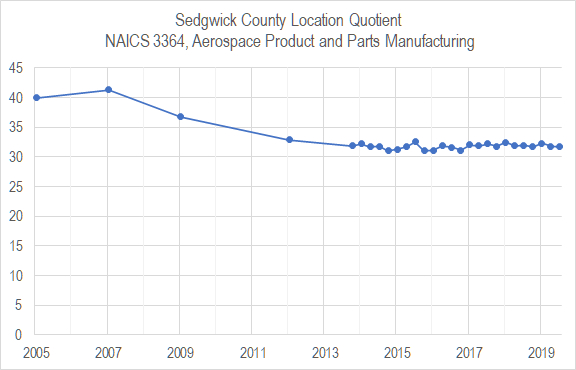
    This data is available by industry. I’ve gathered data for Aerospace Product and Parts Manufacturing (NAICS code 3364) for Sedgwick County and present it in a nearby chart. Data is through the end of 2019, and so does not reflect the pandemic.

    First, note that the location quotient is large, averaging around 32 in recent years. This means the concentration of workers in this industry in Sedgwick County is 32 times the concentration nationwide.

    Second, the location quotient fell from 2007 through 2014. Since then, it has been steady.

    Has the Wichita area diversified its economy? Based on these two measures, the answer is yes. That increase in diversity coincided with a large decline in aviation-related employment, with that decline being larger than the decline in all Wichita-area private-sector employment. That was not planned or desired. It was a result of worldwide trends, most notably the Great Recession.

    But since 2014, concentration in aviation-related employment has changed little, meaning no progress in diversification.


    Notes

    1. See, for example: Roe, John. Where To From Here? Surviving The Coming Bad Times Will Require A Direction, Wichita Eagle, February 7, 1993.
    2. Stringer, Megan. Aviation is key to Wichita. For workers, what does a diversified economy mean? Wichita Eagle, July 26, 2020. Available at https://web.archive.org/web/20200728163347/https://www.kansas.com/news/business/aviation/article244420152.html.
    3. Bureau of Labor Statistics. Quarterly Census of Employment and Wages. Available at https://www.bls.gov/cew/datatoc.htm.
    4. Bureau of Labor Statistics. Using Location Quotients to Analyze Occupational Data. Available at https://www.bls.gov/oes/highlight_location_quotients.htm.
  • Kansas jobs, June 2020

    Kansas jobs, June 2020

    The employment situation in Kansas continued to improve in June 2020 as the response to the pandemic continued to affect the economy.

    Data released today from the Bureau of Labor Statistics, part of the United States Department of Labor, shows the effect of the pandemic and the response to it on employment in Kansas for June 2020.

    (Click charts and tables for larger versions.)

    Using seasonally adjusted data, from May 2020 to June 2020, nonfarm employment in Kansas rose by 30,200 (2.3 percent). Over the year, the number of Kansas nonfarm jobs for June 2020 was lower by 78,400 (5.5 percent) over the same month last year. This is using seasonally adjusted data. The non-adjusted figure is 77,200 fewer jobs (5.4 percent).

    Over the year (June 2019 to June 2020), the Kansas labor force is down by 3,633 (0.2 percent) using seasonally adjusted data, with a decrease of 25,316 (1.7 percent) over the last month. Non-seasonal data shows a fall of 3,176 (0.2 percent) in the labor force over the year.

    Of note: While the number of jobs and working people rose by large amounts in June, both are still much smaller than before the response to the pandemic.

    The number of unemployed persons fell from May 2020 to June 2020 by 40,492 (26.8 percent). The unemployment rate was 7.5 percent in June, up 4.4 percentage points from one year ago, and down 2.5 percentage points from last month.

    Comparing Kansas to the nation: Using seasonal data, the number of Kansas nonfarm jobs is 2.30 percent lower than 12 months ago, while nationally, the same statistic is 3.61 percent lower. Non-seasonal data shows the number of Kansas nonfarm jobs is 5.42 percent lower than 12 months ago, while nationally, the same statistic is 8.72 percent lower.

    Click charts and tables for larger versions.

    In the following chart showing job changes from the previous month, the magnitude of the changes in April through June overwhelms the other months. The rise in June employment is larger than experienced in any other month during the past year.

    In the following chart of job levels from the same month one year ago, the June figures show the loss of jobs becoming less severe.

    The June release contained figures for industry groups. The following chart shows the number of employees in June 2019 and June 2020.

    This chart uses the same data, showing the percent change from June 2019. The Leisure and hospitality category is still the lowest, proportionally. Construction showed the smallest proportional loss.

  • Kansas GDP

    Kansas GDP

    In the first quarter of 2020, the Kansas economy contracted at the annual rate of 3.1 percent, compared to 2.1 percent growth in the previous quarter. While GDP fell in all states, Kansas performed relatively well, with only four states contracting less.

    In the first quarter of 2020, the Kansas economy contracted at the annual rate of 3.1 percent in real (inflation-adjusted) dollars, according to statistics released today by Bureau of Economic Analysis, a division of the United States Department of Commerce. GDP for the quarter was at the annual rate of $175,124 million. The first quarter consists of the months of January, February, and March.

    This the first quarter to be affected by the response to the pandemic, as BEA noted in the release:

    The 2020 Q1 estimates of GDP by state were impacted by the response to the spread of COVID-19, as governments issued “stay-at-home” orders. This led to rapid changes in demand, as businesses and schools switched to remote work or canceled operations, and consumers canceled, restricted, or redirected their spending. The full economic effects of the COVID-19 pandemic cannot be quantified in the GDP by state estimates for 2020 Q1 because the impacts are generally embedded in source data and cannot be separately identified.

    The Kansas rate of -3.1 percent ranked fifth among the states, meaning Kansas avoided the effects of the pandemic more than most states. While GDP fell in all states, Kansas performed relatively well, with only Nebraska, South Dakota, Texas, and North Dakota contracting less. The national rate was -5.0 percent, with the rate for the Plains states at -3.6 percent. (For this data, BEA defines Plains states as Iowa, Kansas, Minnesota, Missouri, Nebraska, North Dakota, and South Dakota.)

    Over the last ten quarters, Kansas has averaged quarterly growth rates of 1.2 percent in annual terms. For the nation, the rate was 1.7 percent. For the Plains states, it was 1.4 percent.

    For the complete release at BEA, click on Gross Domestic Product by State, 1st Quarter 2020.

    I also have developed an interactive visualization of this data over time. To access, click on Visualization: Quarterly Real Gross Domestic Product by state and industry.

    Click for larger.
  • Metropolitan employment and labor force

    Metropolitan employment and labor force

    A visualization of employment, labor force, and the unemployment rate for metropolitan areas, now with data through May 2020.

    How does the Wichita metropolitan area compare with others regarding employment, labor force, and unemployment rate? The Bureau of Labor Statistics, part of the United States Department of Labor, has data that provides the answer.

    I’ve gathered data from BLS and present it in an interactive visualization with tables, charts, and a map. This monthly data is from 1990 to May 2020, which is the last month for which BLS has produced data for metropolitan areas. Click here to learn more and use the visualization. Below is an example from the visualization.

    Click for larger.
  • Wichita jobs and employment, May 2020

    Wichita jobs and employment, May 2020

    For the Wichita metropolitan area in May 2020, the number of unemployed persons is up, the unemployment rate is up, and the number of people working is down, all by large amounts, when compared to the same month one year ago, but improving from April.

    Data released yesterday by the Bureau of Labor Statistics, part of the United States Department of Labor, shows the effects of the response to the pandemic in the Wichita Metropolitan Statistical Area for May 2020.

    Click charts and tables for larger versions.

    Total nonfarm employment fell from 307,500 last May to 285,000 in May 2020, a loss of 22,500 jobs (7.3 percent). (This data is not seasonally adjusted, so month-to-month comparisons are not valid.) For the same period, employment in the nation fell by 11.7 percent. The unemployment rate in May 2020 was 13.9 percent, up from 3.2 percent one year ago.

    Considering seasonally adjusted data from the household survey, the labor force rose by 4,407 persons (1.3 percent) in May 2020 from April 2020, the number of unemployed persons fell by 14,143 (23.2 percent), and the unemployment rate was 14.2 percent, down from 18.2 percent in April. The number of employed persons not working on farms rose to 283,562 in May from 273,826 the prior month, an increase of 9,736 persons (3.6 percent).

    The following chart of the monthly change in the labor force and employment shows the magnitude of the drop in April overwhelming other months, and then a positive change in May.

    The following chart of changes from the same month one year ago shows a similar same trend — fewer jobs, although the labor force grew.

    The following chart of changes in employment from the same month of the previous year shows months when the Wichita MSA performed better than the nation. For April and May 2020, the two full months first affected by the pandemic, we see the decline in employment Wichita has not been as severe as the nation..

    The following two charts show changes in jobs for Wichita and the nation over longer periods. The change is calculated from the same month of the previous year. For times when the Wichita line was above the nation, Wichita was growing faster than the nation. This was often the case during the decades starting in 1990 and 2000. Since 2010, however, Wichita has rarely outperformed the nation and sometimes has been far below the nation.