Tag: Featured
-

Kansas school employment
Kansas school employment rose for the current school year.
-

Kansas tax receipts
Kansas tax receipts by category, presented in an interactive visualization. Now with data through December 2019.
-
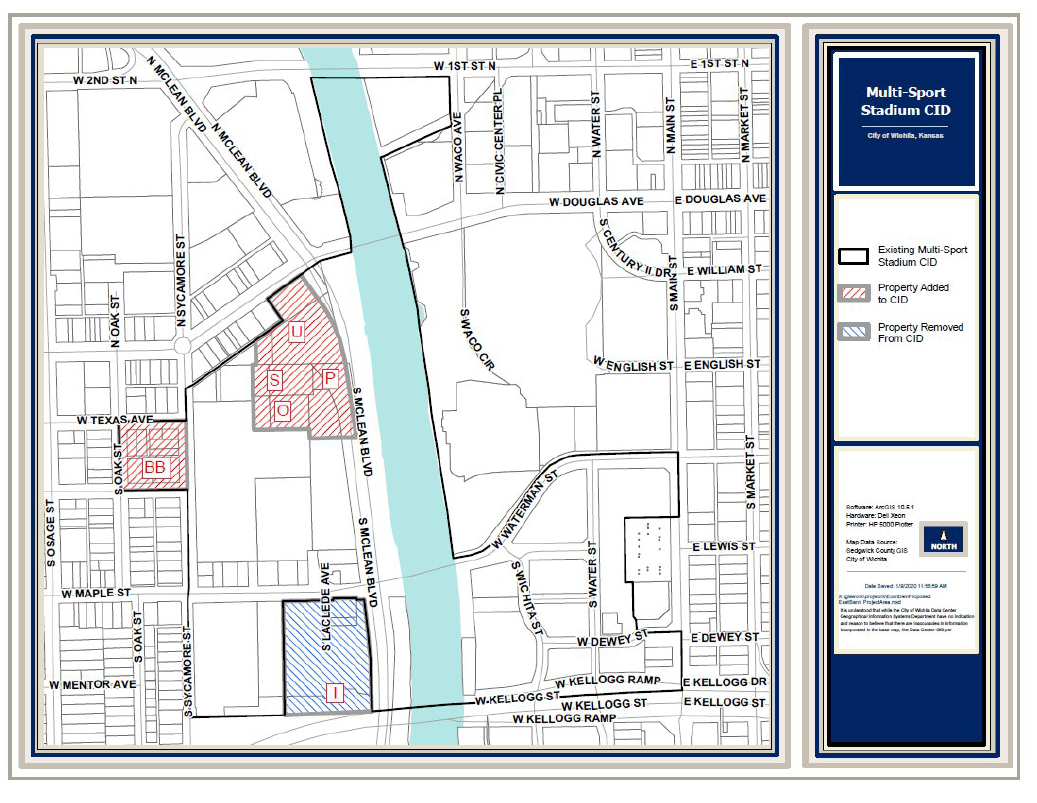
Wichita taxing district to expand
The City of Wichita plans to expand a special tax district.
-

Wichita property tax rate: Up
The City of Wichita property tax mill levy rose for 2019.
-

Wichita should post fulfilled records requests
When the City of Wichita fulfills records requests, it should make those records available to everyone.
-

Wichita jobs and employment, December 2019
For the Wichita metropolitan area in December 2019, the labor force is up, the number of unemployed persons is down, the unemployment rate is down, and the number of people working is up when compared to the same month one year ago. Seasonal data shows small increases in labor force and jobs from November.
-

Naftzger Park event management agreement ambiguous
The profit-sharing agreement for Naftzger Park event management contains ambiguity that could lead to disputes.
-

Wichita public schools, by the charts
Data from the annual report for the 2018-2019 school year for USD 259, the Wichita, Kansas public school district.
-

Wichita legal notices an easy start on the path to transparency
Kansas law requires publication of certain notices in newspapers, but cities like Wichita could also make them available in other ways that are easier to use.
-

All Kansas Republicans should have a voice
A presidential nominating caucus or primary would allow Trump skeptics in Kansas to have their say. It could provide a safety valve, a way to release the pressure that builds up from being told they are traitors to not only their party but to the country as well.
-

Kansas jobs, December 2019
Employment and the labor force rose in Kansas in December 2019 compared to the prior month. Kansas continues to perform well in year-over-year growth when compared to the nation.
-

Century II resource center
Updated and refreshed: A resource of information about the Century II Performing arts and Convention Center in Wichita.