Tag: Featured
-
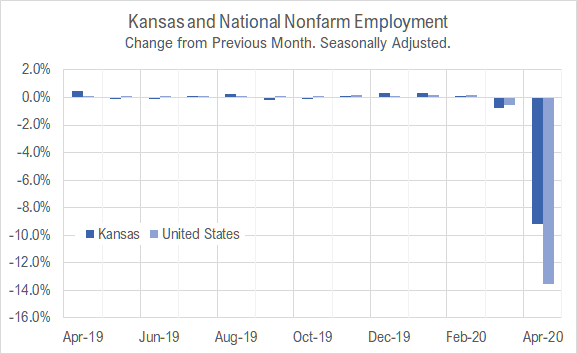
Kansas jobs, April 2020
Employment fell sharply in Kansas in April 2020 as the response to the pandemic unfolded.
-
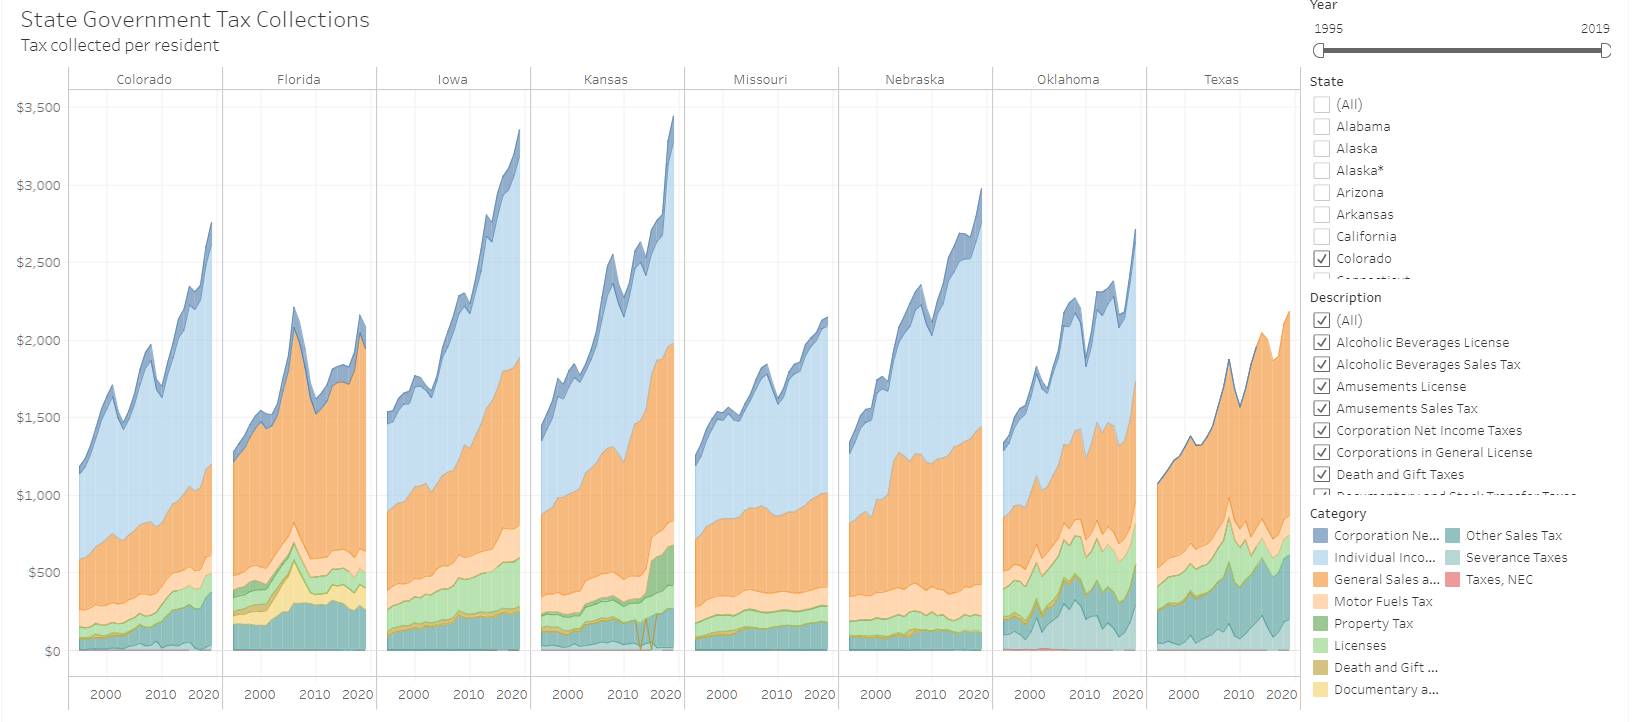
State government tax collections for 2019
Kansas state government tax collections rose to $3,443 per person in 2019, an increase of 5.0 percent from 2018.
-

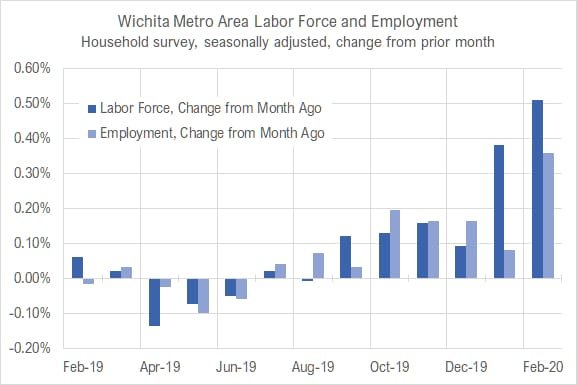
Wichita jobs and employment, March 2020
For the Wichita metropolitan area in March 2020, the labor force is up, the number of unemployed persons is up, the unemployment rate is down, and the number of people working is up when compared to the same month one year ago. Seasonal data shows increases in labor force and jobs from February, with the…
-
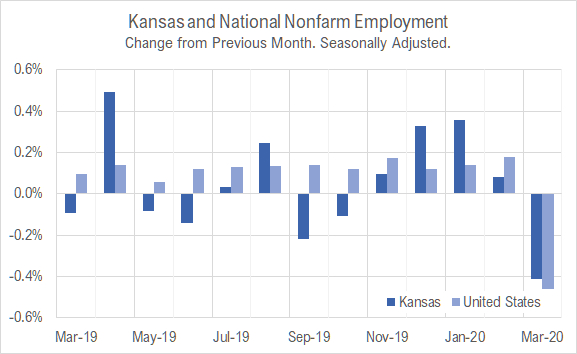
Kansas jobs, March 2020
Employment fell in Kansas in March 2020 compared to the prior month, but it still higher than last March. It is unclear how the pandemic has affected this data
-

Metropolitan employment and labor force
A visualization of employment, labor force, and unemployment rate for metropolitan areas, now with data through February 2020.
-
Wichita jobs and employment, February 2020
For the Wichita metropolitan area in February 2020, the labor force is up, the number of unemployed persons is up, the unemployment rate is up, and the number of people working is up when compared to the same month one year ago. Seasonal data shows increases in labor force and jobs from January.
-
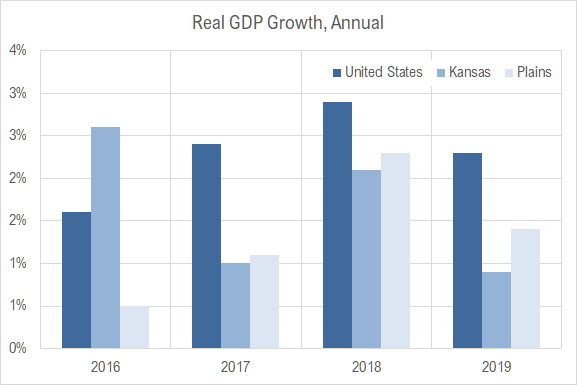
Kansas GDP
In 2019, the Kansas economy grew at the annual rate of 0.9 percent, down from 2.1 percent the previous year, and ranked forty-fifth among the states.
-
Kansas jobs, February 2020
Employment and the labor force rose in Kansas in February 2020 compared to the prior month, although employment growth was smaller.
-

Kansas personal income
For 2019, the rate of personal income growth in Kansas was near the middle of the states.
-

Wichita jobs and employment, January 2020
For the Wichita metropolitan area in January 2020, the labor force is up, the number of unemployed persons is down, the unemployment rate is down, and the number of people working is up when compared to the same month one year ago. Seasonal data shows increases in labor force and jobs from December.
-

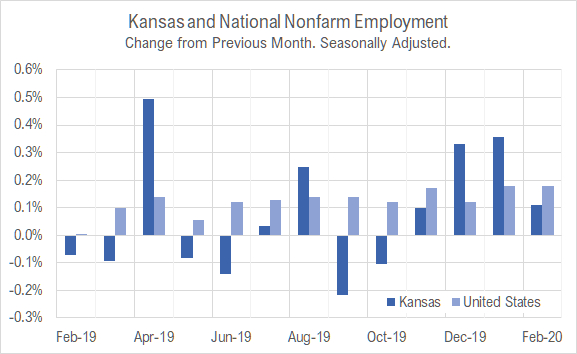
Kansas jobs, January 2020
Employment and the labor force rose in Kansas in January 2020 compared to the prior month. Kansas outperformed the nation in job growth the past two months.
-

Intrust Bank Arena economic impact holds mistake
A report on the economic impact of the first ten years of operation of the Intrust Bank Arena in downtown Wichita incorrectly reported tax revenue.