For the Wichita metropolitan area in February 2021, the number of unemployed persons is up, the unemployment rate is up, and the number of people working is down when compared to the same month one year ago. The recent trend is more positive.
Data released by the Bureau of Labor Statistics, part of the United States Department of Labor, shows the effects of the response to the pandemic in the Wichita Metropolitan Statistical Area for February 2021.

Click charts and tables for larger versions.
Total nonfarm employment fell from 306,700 in February 2020 to 282,300 in February 2021, a loss of 24,400 jobs (8.0 percent). (This data is not seasonally adjusted, so month-to-month comparisons are not valid.) For the same period, employment in the nation fell by 5.9 percent. The unemployment rate in February 2021 was 6.4 percent, up from 3.8 percent the same month one year prior.
Considering seasonally adjusted data from the household survey, the labor force fell by 212 persons (0.1 percent) in February 2021 from January 2021, the number of unemployed persons fell by 286 (1.4 percent), and the unemployment rate was 6.3 percent, down from 6.4 percent in January. The number of employed persons not working on farms rose to 301,295 in February from 301,221 the prior month, an increase of 74 persons (0.0 percent).
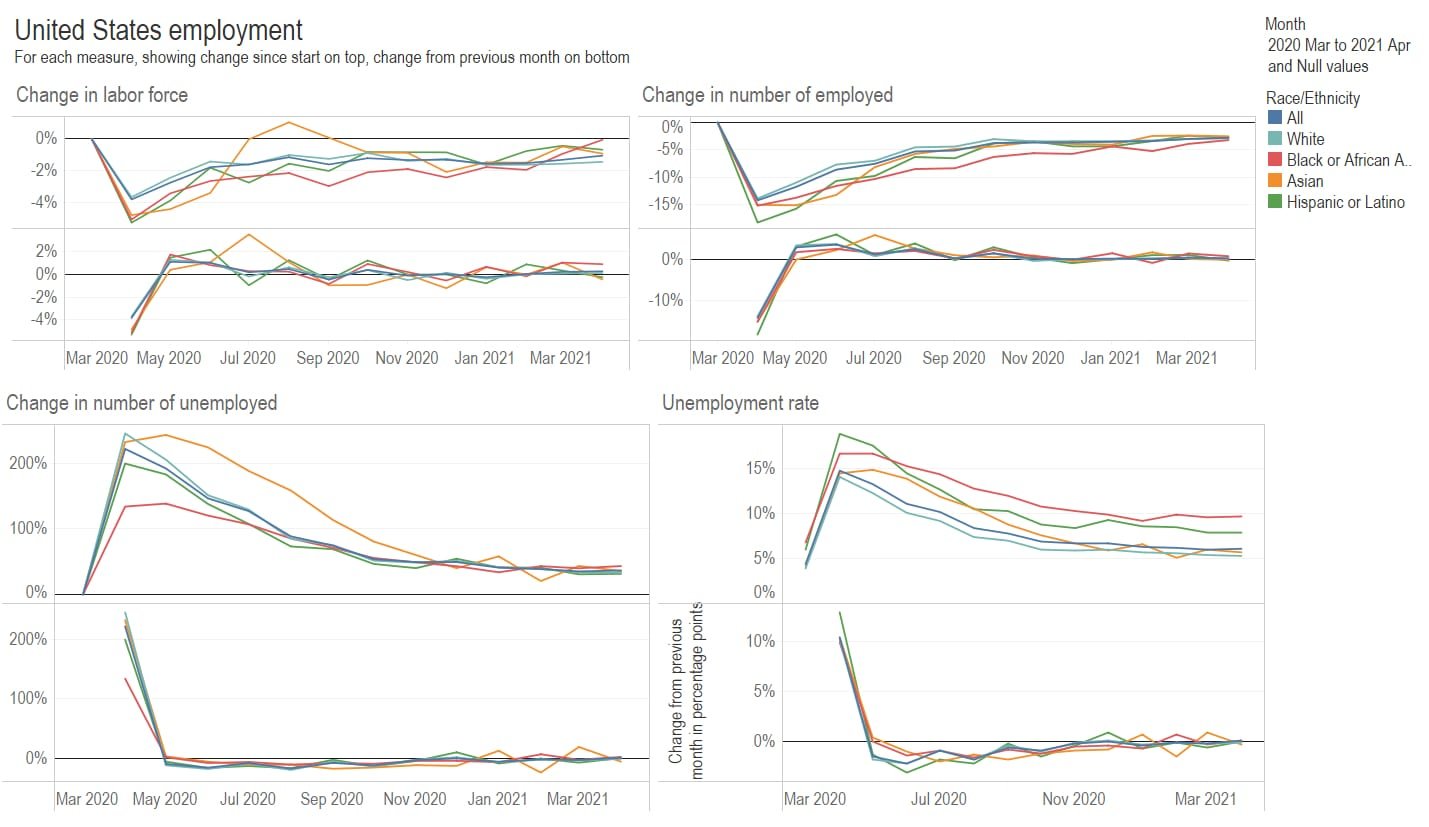
The following chart of the monthly change in the labor force and employment in Wichita shows the magnitude of the drop in employment in April 2020 overwhelming other months, and then both positive and negative changes in employment for the following months. The rate of job growth is generally small except for October. The number of people in the labor force has both grown and shrank.

The following chart of changes from the same month one year ago shows a similar trend — fewer jobs, although the difference has become smaller as more people return to work.

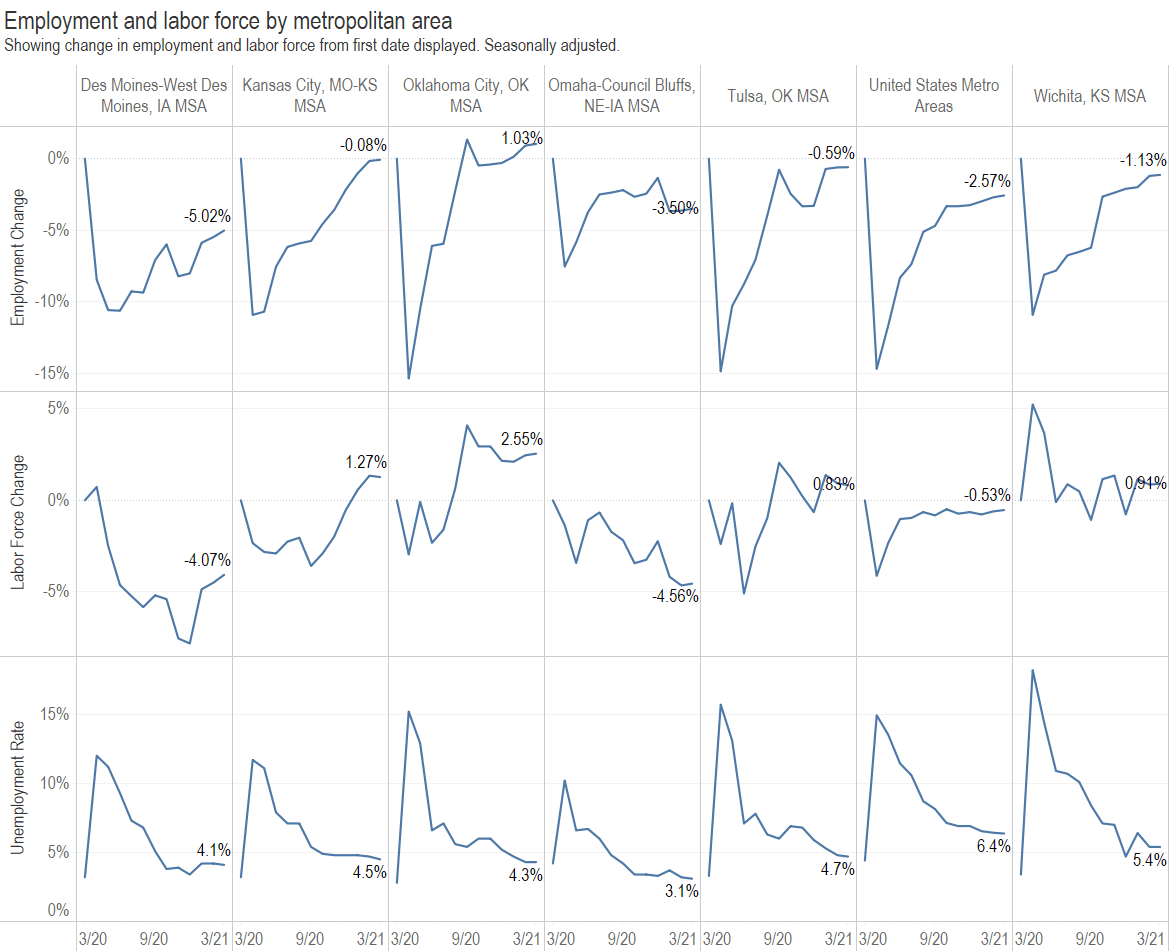
The following chart of changes in employment from the same month of the previous year shows months when the Wichita MSA performed better than the nation before the pandemic. In months affected by the pandemic, we see the loss in employment Wichita has not been as severe as the nation, although that is not the case in recent months.
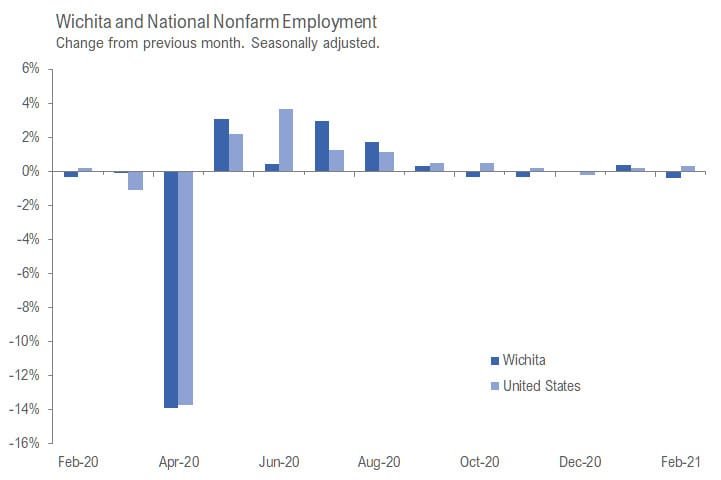
The following chart shows the monthly change in nonfarm jobs for Wichita and the nation. Since September, the changes have been relatively small, with gains and losses.
The following two charts show changes in jobs for Wichita and the nation over longer periods. The change is calculated from the same month of the previous year. For times when the Wichita line was above the nation, Wichita was growing faster than the nation. This was often the case during the decades starting in 1990 and 2000. Since 2010, however, Wichita has rarely outperformed the nation and sometimes has been far below the nation.
(For data on all metropolitan areas in the nation, see my interactive visualization Metro area employment and unemployment. It is updated through February 2021.)
The link to the archived version of the BLS news release for this month may be found here.