A popular meme on social media is true, but doesn’t convey its intended message. (more…)
Tag: Energy
Presidential Data Explorer Updated
Explore the economic record of presidents, starting with Harry S Truman. Updated with recent data. (more…)
Presidential Data Explorer Updated
Explore the economic record of presidents, starting with Harry S Truman. Updated with recent data. (more…)
BP Oil Executive ‘Brice Cromwell’
A popular social media post makes a bogus appeal to authority. (more…)
Weekly Gasoline Purchases
A popular Facebook post makes claims about gasoline purchases that aren’t correct, or even close. (more…)
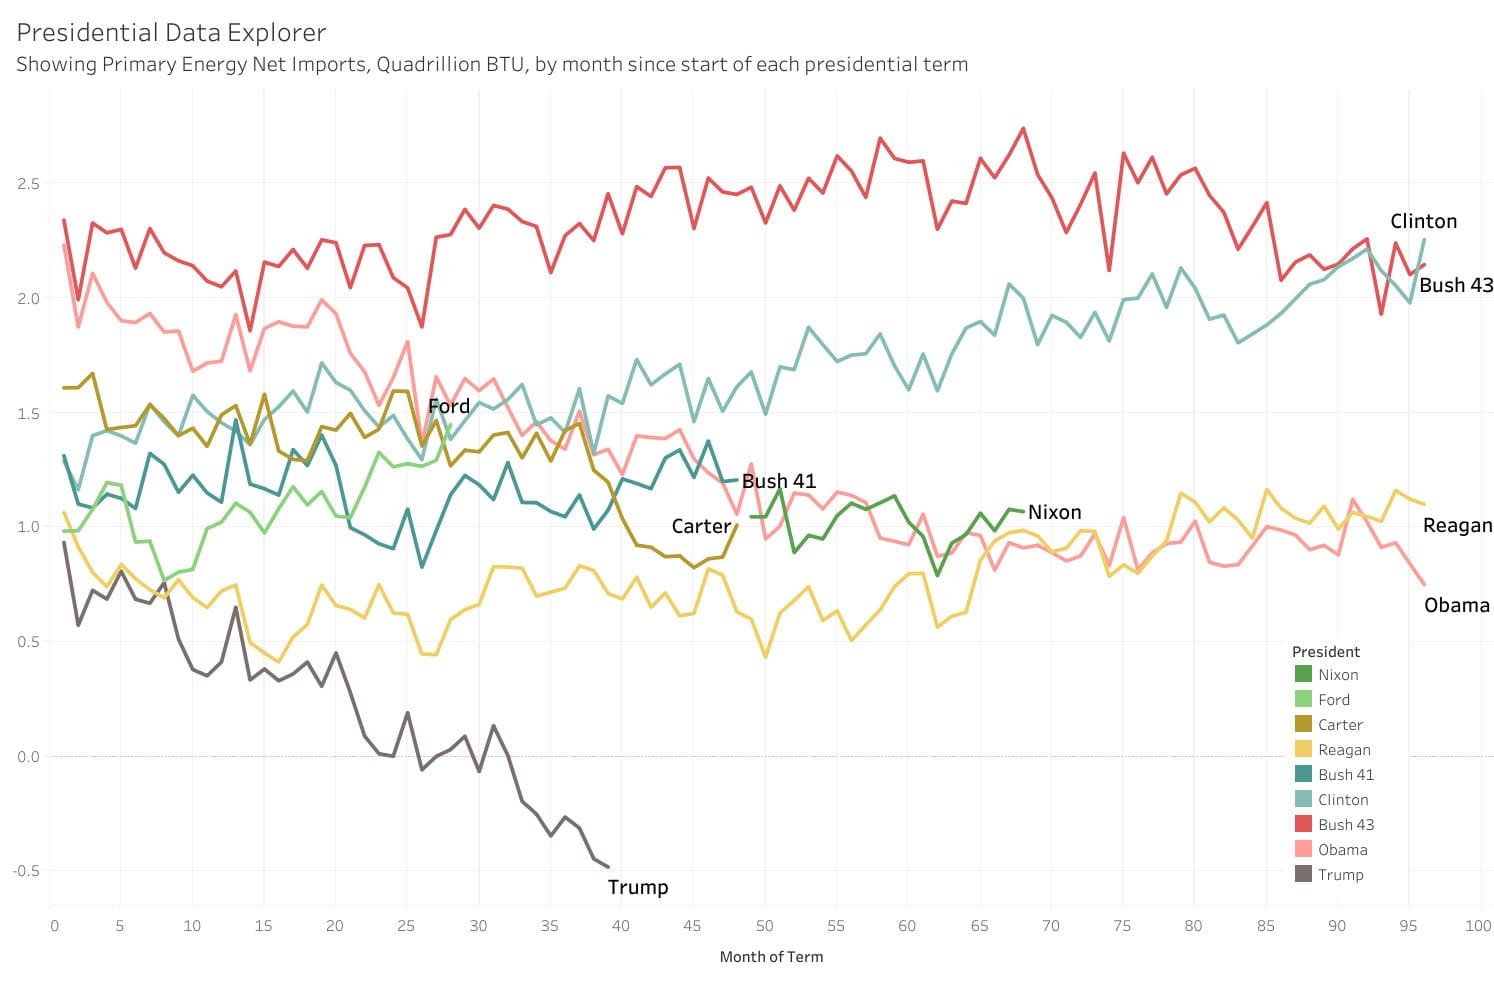
Added to presidential data explorer: Primary Energy Net Imports
Explore the economic record of presidents through the lens of energy independence.
To examine the record of presidents regarding economics, I gathered data from several sources and present it in an interactive visualization. New to the visualization is Primary Energy Net Imports. When this number is negative, it means the United States is exporting more energy than it imports. This data comes from the U.S. Energy Information Administration.
Primary energy is “Energy in the form that it is first accounted for in a statistical energy balance, before any transformation to secondary or tertiary forms of energy. For example, coal can be converted to synthetic gas, which can be converted to electricity; in this example, coal is primary energy, synthetic gas is secondary energy, and electricity is tertiary energy.”
For each president, data is presented by month, with the first month of each president’s term having number one. Presidents that served two full terms have data up to month 96 of their term, while others have fewer months.
Data is shown in several views:
- A table.
- A timeline chart showing the monthly value of a statistic by month for each president. There are two versions.
- A chart showing the change in the absolute value of a statistic by month for each president.
- A chart showing the proportional change in the value of a statistic for each president.
- Grids of the same data.
Click here to learn more about the data and access the visualization.
From Pachyderm: Westar Energy
From the Wichita Pachyderm Club: Don Sherman, Vice President Community Relations and Strategic Partners with Westar Energy introduced Jeff Beasley, Vice President of Customer Care with Westar for an informative presentation titled, “An overview of Westar Energy — Solar, Conservation, Community.”
This was recorded August 12, 2016. Click here for the audio presentation. Click here for the slides.
Energy subsidies for electricity production
To compare federal subsidies for the production of electricity, we must consider subsidy values in proportion to the amount of electricity generated, because the magnitude is vastly different.
When comparing federal subsidies for the production of electricity, it’s important to look at the subsidy values in proportion to the amount of electricity generated. That’s because the scales vary widely. For example, in 2010 for the United States, as can be seen in the accompanying table, coal accounted for the production of 1,851 billion kWh (or megawatt hours) of electricity production. That’s 44.9 percent of all electricity produced. Solar power accounted for the production of 1,851 billion kWh, which is 0.025 percent of all electrical production.
Solar power, however, received 8.2 percent of all federal subsidies, or about 328 times its share of production.
The nearby table and chart are based on data from the Energy Information Administration (EIA), Direct Federal Financial Interventions and Subsidies in Energy in Fiscal Year 2010 through the Congressional Research Service, along with the author’s calculations.
Of particular interest is wind power, as it receives subsidy in the form of cash equivalent tax credits, and many states (including Kansas) have mandates forcing its use. For the year covered in the table, wind accounted for 2.3 percent of U.S. electricity generation. It received 42.0 percent of federal energy subsidies.
Abengoa, Kansas ethanol plant operator, may seek bankruptcy
A company that has a taxpayer-guaranteed loan may be entering bankruptcy. Will taxpayers have to pay?
(Updated November 30) Spanish energy giant Abengoa has taken preliminary steps that could lead to bankruptcy filing.
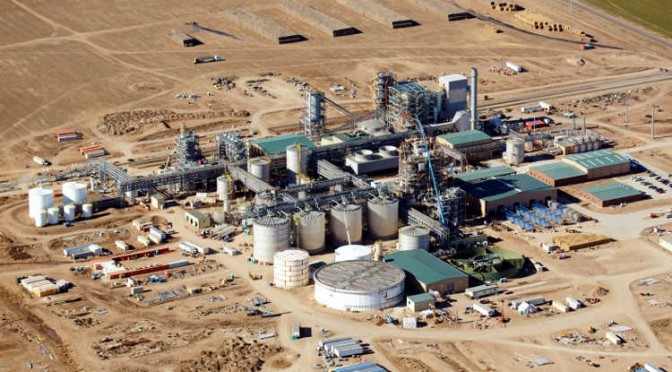
Of relevance to Kansas — and the country at large — is the Abengoa cellulosic ethanol plant near Hugoton. That plant received a $132.4 million loan guarantee from the United States government under the same program that benefited Solyndra. That company cost taxpayers over $500 million when it defaulted on its taxpayer-guaranteed loan.
Does a bankruptcy filing by Abengoa place U.S. taxpayers on the hook for the company’s guaranteed loan? If so, are taxpayers liable for the entire $132.4 million or some smaller portion?
The answer is this: We don’t know. I’ve asked for, and have received the loan guarantee agreement. It’s unclear to me what would happen if Abengoa entered bankruptcy.
Following, reporting from the Wall Street Journal. It mentions “debt-fueled expansion,” some of which is a liability of the U.S. taxpayer.
Spain’s Abengoa Files for Creditor Protection
The company’s debt-fueled expansion in the boom years is handicapping growth todayMADRID — Spanish renewable energy and engineering firm Abengoa SA said on Wednesday that it is filing for preliminary creditor protection, an initial step that could lead to the largest bankruptcy case in the country’s history.
The potential demise of Abengoa is an extreme example of a Spanish company whose debt-fueled expansion during the country’s boom years has handicapped its ambitions for growth today.
The company is one of the world’s top builders of power lines transporting energy across Latin America and a top engineering and construction business, making massive renewable-energy power plants in places from Kansas to the U.K.
Continue reading at Wall Street Journal.